
Analysis of Data: Common Descriptive and Summary Statistics
Summary statistics are a good place to start the analysis; however, be careful not to interpret data using only summary statistics. In addition, it is important to check the distribution of the data – most environmental data are not normally distributed.
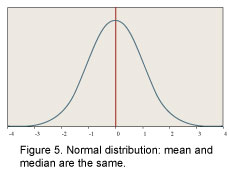
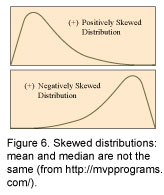
They are the same if the distribution is symmetric (Figure 5); in a skewed distribution, the mean is pulled towards a tail (Figure 6).
 It is important to be able to identify outliers in data and understand the implications of and data analysis with and without outliers.
-
Arithmetic mean – sum of the observations (data) divided by the number of observations.
Median – the midpoint of a distribution (observations in order from smallest to largest).
Distributions (is the data normally distributed?)
Geometric mean – often useful summaries for skewed data, such as bacteria (E. coli).
Measures of variability (standard deviation, coefficient of variability, skewness.)
Box and whisker plots (five number summary) describe the center and the spread of the data.
They are the same if the distribution is symmetric (Figure 5); in a skewed distribution, the mean is pulled towards a tail (Figure 6).
Quick Links
Decision Tools
Objective
Temporal & Spatial Scale
Monitoring Considerations
Sampling Design
Data Analysis
Pollutant Properties
Resources
Additional Information
Glossary
National Water Quality Handbook
Contacts:
Nancy Mesner
Extension Water Quality
Specialist
Utah State University
435-797-7541
nancy.mesner@usu.edu
Ginger Paige
Water Resources Specialist
University of Wyoming
307-766-2200
gpaige@uwyo.edu

- ©2011 University of Wyoming |
- Disclaimer |
- Site questions or comments |
- Last updated: June 14, 2011