|
IECM 13.1 User Manual > Modules Included with the IECM > Pulverized Coal (PC) Plant > GET RESULTS > CO2 Capture, Transport & Storage > 1. Solid Sorbents TSA > Solid Sorbents TSA Diagram |
|
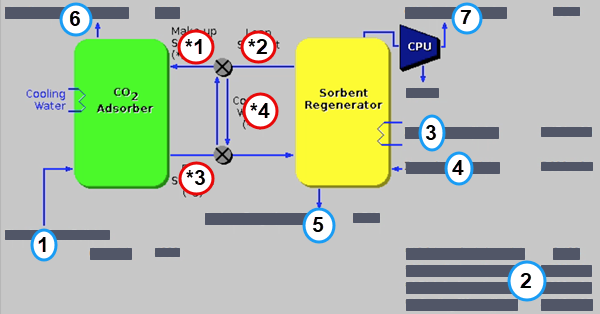
The Solid Sorbents TSA Diagram result screen shows the major flows into and out of the solid sorbents TSA system:
PC: GET RESULTS: CO2 Capture, Transport & Storage: 1. Solid Sorbents TSA: Solid Sorbents TSA Diagram
The following values are shown:
•Area 1: Flue Gas from Polisher: This is the flow rate of flue gas exiting the SO2 polisher and entering the CO2 adsorber.
•Area 2: Sorbent & Cooling Water: Although these values are reported in the lower right part of the diagram, they correspond with the specified areas in the middle.
•*1 Makeup Sorb: This is the flow rate of makeup sorbent entering the adsorber.
•*2 Lean Sorbent: This is the flow rate of lean sorbent leaving the regenerator and entering the adsorber.
•*3 Rich Sorbent: This is the flow rate of rich sorbent leaving the adsorber and entering the regenerator.
•*4 Cooling Water: Water and steam are used to transfer heat between the heat exchangers.
•Area 3: Regen Steam: This is the steam used to heat the solids in the regenerator.
•Area 4: Purge Steam: This is the steam used to achieve the desired CO2 partial pressure in the regenerator.
•Area 5: Sorbent Purge: This is the total purge flow rate exiting the regenerator.
•Area 6: Flue Gas to Stack: This is the flow rate of flue gas leaving the adsorber.
•Area 7: CO2 Product: This is the flow rate of CO2 product from the cryogenic purification unit (CPU).
Copyright © 2022-2026 University of Wyoming. All rights reserved. Visit us at https://www.iecm-online.com/