|
IECM 13.1 User Manual > Modules Included with the IECM > Pulverized Coal (PC) Plant > GET RESULTS > CO2 Capture, Transport & Storage > 4. Pipeline Transport > Pipeline Transport Diagram |
|
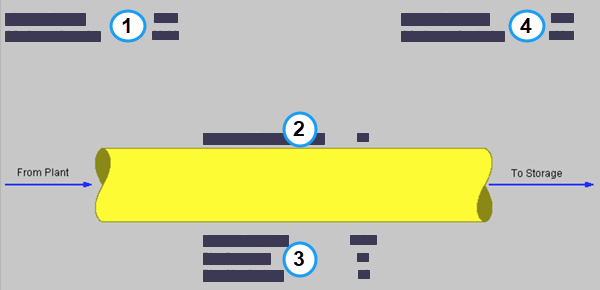
The Pipeline Transport Diagram result screen shows the major flows into and out of the pipeline transport system in all plant types:
PC: GET RESULTS: CO2 Control: 4. Pipeline Transport: Pipeline Transport Diagram
The following values are shown:
•Area 1: From Plant:
•Pressure In: This is the pressure of the CO2 from the plant into the pipeline in absolute pounds per square inch.
•CO2 Stream In: This is the flow of the CO2 from the plant into the pipeline in actual cubic feet per minute.
•Area 2: To CO2 Transport System:
•No. of Booster Pumps: This is the number of booster pumps used (if any).
•Area 3: Pipeline Characteristics:
•Ground Temperature: Average ground temperature that the pipeline traverses.
•Pipe Segments: Total number of pipe segments from plant to injection site.
•Pipe Size: Outer diameter of the pipe in inches.
•Area 4: To Storage:
•Pressure Out: This is the pressure of the CO2 when it enters the storage site in absolute pounds per square inch.
•CO2 Stream Out: This is the flow of the CO2 from the pipeline into the storage site in actual cubic feet per minute.
Copyright © 2022-2026 University of Wyoming. All rights reserved. Visit us at https://www.iecm-online.com/