|
IECM 13.1 User Manual > Modules Included with the IECM > Integrated Gasification Combined Cycle (IGCC) Plant > GET RESULTS > CO2 Capture, Transport & Storage > 2. Selexol CO2 Capture > Selexol CO2 Capture Diagram |
|
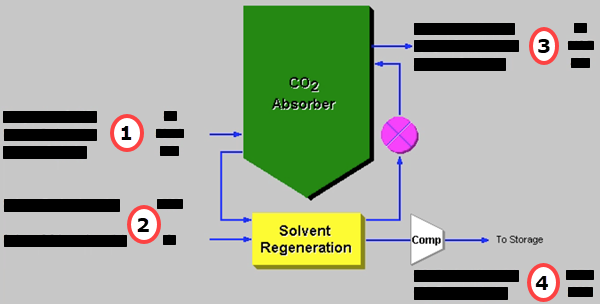
The Selexol CO2 Capture Diagram result screen shows the major flows into and out of the Selexol CO2 capture system:
IGCC: GET RESULTS: CO2 Capture, Transport & Storage: 2. Selexol CO2 Capture: Selexol CO2 Capture Diagram
Each result is described briefly below:
•Area 1: Syngas In
•Temperature In: Temperature of the syngas entering the CO2 absorber unit.
•Syngas In: Flow rate of the syngas entering the CO2 absorber unit.
•Pressure In: Pressure of the syngas entering the CO2 absorber unit.
•Area 2: Solvent
•Recirculation: This is the total flow rate of Selexol solvent through the system.
•Makeup: Flow rate of Selexol solvent added to the regenerator.
•Area 3: Syngas Out
•Temperature Out: Temperature of the syngas exiting the CO2 absorber unit.
•Syngas Out: Flow rate of the syngas exiting the CO2 absorber unit.
•Pressure Out: Pressure of the syngas exiting the CO2 absorber unit.
•Area 4: CO2 Product
•CO2 Product: Flow rate of the CO2 product exiting the regenerator.
•CO2 Pressure: CO2 product pressure entering the pipeline.
Copyright © 2022-2026 University of Wyoming. All rights reserved. Visit us at https://www.iecm-online.com/