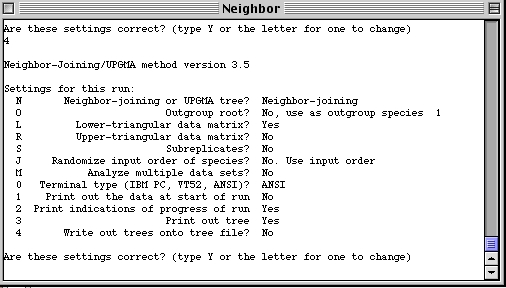
Fig. 1. Sample program window for PHYLIP's Neighbor subroutine. Typing in the letters or numbers in the column (N, O, L, R etc.) toggles the options for the analyses.
Return to Main Index page
Download a 1-page "how-to" doc on hand-building UPGMA and neighbor-joining trees.
Download an Excel spreadsheet showing how to build UPGMA, Fitch-Margoliash or Neighbor-joining trees by hand
For the interested: download some comments on the ape phylogeny-building (especially useful if trying the methods that are more complex than UPGMA)
We will use the program PHYLIP to build neighbor-joining, UPGMA and Fitch-Margoliash trees from distance matrix input.
Consider the great ape example I worked through with an Excel spreadsheet (link above). These are Jukes-Cantor distances based on number of mtDNA sequence differences. [See Glossary and pp. 91-93 of Hall, B.G. 2001. Phylogenetic Trees Made Easy. Sinauer, for more on evolutionary models of nucleotide change and Jukes-Cantor].
Human Chimp Gorilla Orangutan Gibbon Human � 0.015 0.045 0.143 0.198 Chimp � 0.03 0.126 0.179 Gorilla � 0.092 0.179 Orangutan � 0.179 Gibbon �
We will see how to run this matrix through PHYLIP's Neighbor routine, to generate a UPGMA and a neighbor-joining tree. The first step is to arrange the data in suitable format as an input file (preferably named "infile"). PHYLIP has fairly good documentation files but sometimes the easiest way is to learn by example. The input file will be text-only, have the name infile and need to be in the same directory as the program.
Download Word document PHYLIPinfo.doc
The great ape file will look like:
One of the main sources of input file problems is forgetting to pad the OTU names to at least 10 spaces. That is, if the OTU name is OTU1, then you need to have at least six spaces before the first distance number (adding more is fine).5
Human 0.015 0.045 0.143 0.198
Chimp 0.03 0.126 0.179
Gorilla 0.092 0.179
Orangutan 0.179
Gibbon
Double-click the Neighbor program icon to launch the program and you will get a screen something like:
Fig. 1. Sample program window for PHYLIP's Neighbor subroutine. Typing in the letters or numbers in the column (N, O, L, R etc.) toggles the options for the analyses.
You toggle between choices in this menu by typing the letters in the column on the left. Typing N will change the routine from Neighbor-joining to UPGMA, typing O will bring up a dialog line asking the number of the OTU you want to use as an outgroup, etc. Once you are satisfied that all the options are correct (some are ones you will rarely or never use) type Y and the program will run. A file named outfile will then appear in the directory that infile and the program are in. After changing the R option above to tell it that the input file is upper triangular, the output file is:
5 PopulationsThe tree is very inelegant, but it conveys the essential elements, and we have all the branch lengths in the bottom table. The program also produces a treefile in the New Hampshire convention format:Neighbor-Joining/UPGMA method version 3.57c
Neighbor-joining method
Negative branch lengths allowed
+Gorilla
!
! +---Orangutan
--3--1
! +-------Gibbon
!
! +Human
+--2
+Chimpremember: this is an unrooted tree!
Between And Length
------- --- ------
3 Gorilla 0.00575
3 1 0.04025
1 Orangutan 0.05700
1 Gibbon 0.12200
3 2 0.02425
2 Human 0.01575
2 Chimp -0.00075
(Gorilla:0.00575,(Orangutan:0.05700,Gibbon:0.12200):0.04025,(Human:0.01575,
Chimp:-0.00075):0.02425);
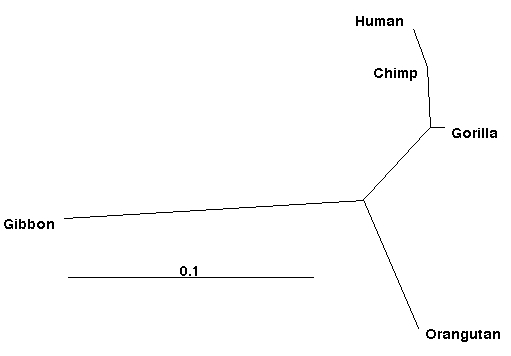
Although this looks somewhat impenetrable, the parentheses, colons, commas and numbers contain all the information needed to draw a tree with a program like TreeView (see my Web genetic software document for where to download that -- it is on the PC's in BioSci 302). Imported into TreeView the resulting (unrooted) tree looks like:
We could use a drawing program to add branch lengths, thicken the lines or make other presentation changes, but even in this form it is considerably improved over the PHYLIP diagram. Note that the chimp branch is so short (in fact the estimate is negative) that it shows only as a crook in the tree. If we wanted, we could use some sort of rooting procedure (e.g., midpoint rooting) to turn this into a rooted tree. OR, we could do the analysis with an explicit outgroup and root it that way.
Fig. 2. An unrooted tree (radial tree option in Tree View) for the great ape analysis, as drawn by the program TreeView, using the output "treefile" from PHYLIP. Unlike the cladogram option, this tree shows amounts of evolutionary change (and therefore has a scale).
If we use the UPGMA option in Neighbor and the phylogram option in TreeView we get the following:
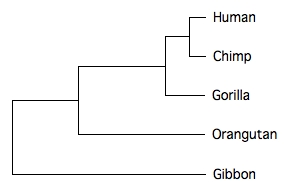
__ 0.01
Fig. 3. The great ape analysis presented in UPGMA format (branch lengths equal and right-justified. The rectangular format is traditional for UPGMA (emphasizes the equal rate of change along all the branches, which is the major assumption of the UPGMA approach). The tree is rooted. We count only the horizontal distances. Note the scale (= time or amount of evolutionary change). The difference between a cladogram and a phylogram is that the cladogram focuses only on the topology (what is a sister taxon to what), whereas the phylogram also conveys information about the rate of evolutionary change along the branches.