|
IECM 13.1 User Manual > Using the IECM > Analysis Tools > Uncertainty > View or Graph Samples |
|
The View or Graph Samples screen is very similar to the Choose Dependent Variable(s) screen in the Sensitivity Analysis tool. In this example, uncertainty has been added to the Gross Electrical Output, and a cumulative probability graph of the Internal Electricity Price is being shown:
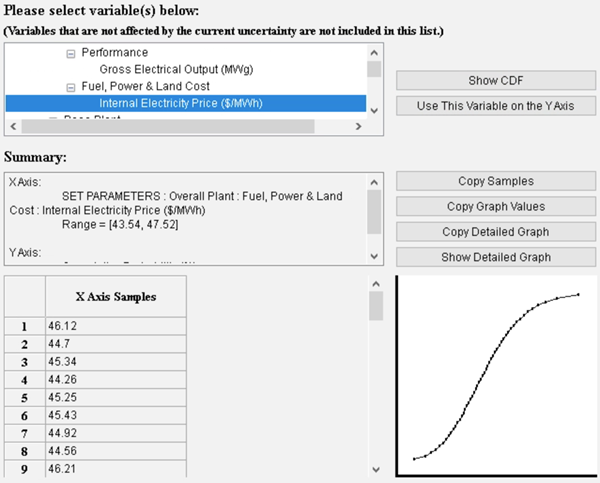
View or Graph Samples - Internal Electricity Price
The differences between this screen and the Choose Dependent Variable(s) sensitivity analysis screen are:
•The parameters and results listed are those affected by the current uncertainty
•The chosen variable is displayed on the X Axis; cumulative probability is shown on the Y Axis by default. There are two buttons in the upper right corner, next to the variable chooser:
•Show CDF: puts the cumulative probability (CDF) on the Y Axis
•Use This Variable on the Y Axis: puts the currently selected variable on the Y Axis.
•The table on the lower left part of the screen shows the samples ordered by sample number. This is not the same as the graph; in the graph, they are ordered by cumulative probability. If you are doing batch processing, you may find it helpful to browse results using this table.
•The Copy... buttons have been moved down, and the Copy Table to Clipboard button is replaced by two buttons:
•Copy Samples: This copies a table containing the samples ordered by sample number to the clipboard. If you are doing batch processing , this is the table you want.
•Copy Graph Values: This copies a table containing the samples ordered by X Axis value to the clipboard . This table corresponds with the graph.
If you prefer, you can select the X and/or Y axis by locating the variable in the interface screens and selecting Use this Parameter/Result as the X/Y Axis on a Graph from the parameter right-click menu or the result right-click menu.
|
Note: |
|
Performance table and cost table units are not currently supported on the View or Graph Samples screen. |
Copyright © 2022-2026 University of Wyoming. All rights reserved. Visit us at https://www.iecm-online.com/