|
IECM 13.1 User Manual > A Case Study > Graphs |
|
On the GET RESULTS: Base Plant: 1. Boiler: O&M Cost screen, locate the Total Variable Costs line. This line is toward the middle of the left table and is highlighted in yellow. Right-click this line and choose Display a Graph of this Result from the menu that pops up:
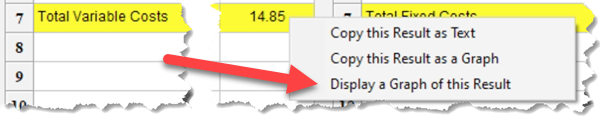
Total Variable Costs Right-click Menu
A graph of the value will display. The graph should look something like this:
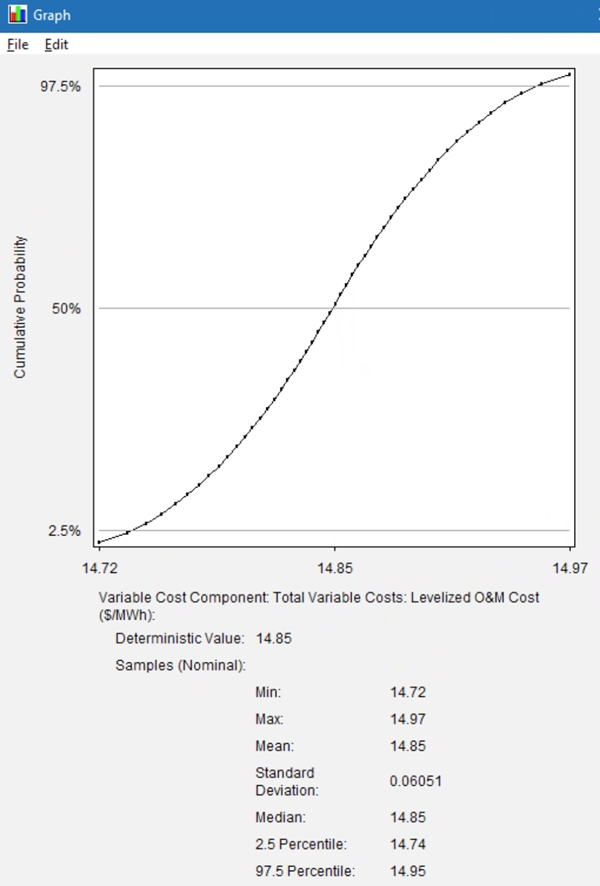
Graph of Total Variable Costs (uncertainty on Boiler Efficiency)
When you first bring up a graph, there may be a short delay as all result samples are calculated. Once all the samples are calculated, there should be little more than a split-second delay when you choose another graph. (However, if you change the plant configuration or input values and then return to GET RESULTS, the samples will have to be recalculated, causing another delay.)
While all of the values displayed in diagrams and tables are deterministic, some have uncertainty in their calculation. If there is no uncertainty in the value's calculation, the graph displays (No Uncertainty). If uncertainty is present, the graph displays a curve of all possible values.
Additional options for viewing graphs are available in the Uncertainty tool in the ANALYSIS TOOLS program area.
Copyright © 2022-2026 University of Wyoming. All rights reserved. Visit us at https://www.iecm-online.com/