|
IECM 13.1 User Manual > A Case Study > Get Results > Base Plant > Boiler Diagram |
|
The first screen in the 1. Boiler process type is the Boiler Diagram. This screen displays an icon for the boiler and values for major flows in and out of it.
Since the Boiler Diagram is the first screen in the Base Plant technology, it will be automatically selected when you click Base Plant. The screen should look like this:
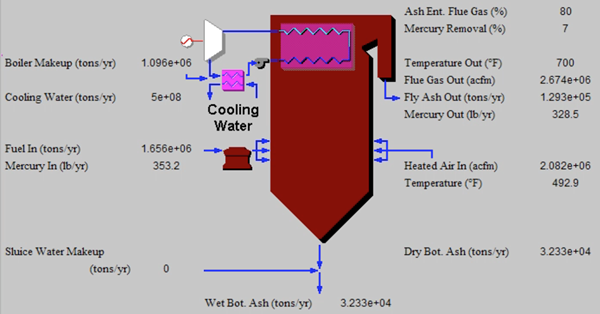
GET RESULTS: Base Plant: 1. Boiler: Boiler Diagram
The flow rates are shown in annual average units (tons/yr) due to the unit change made earlier. Due to the trace flow rates of mercury, its flow rate is reported in lb/yr.
Copyright © 2022-2026 University of Wyoming. All rights reserved. Visit us at https://www.iecm-online.com/