|
IECM 13.1 User Manual > Using the IECM > Getting Results > Diagram Screens > Other Diagrams |
|
Many technologies and process types include one or more diagrams to help you visualize what is going on in that area of the plant. These diagrams typically include things like temperatures and total flow rates. For example, the following diagram is shown on GET RESULTS: Base Plant: 1. Boiler: Boiler Diagram for a Pulverized Coal (PC) plant:
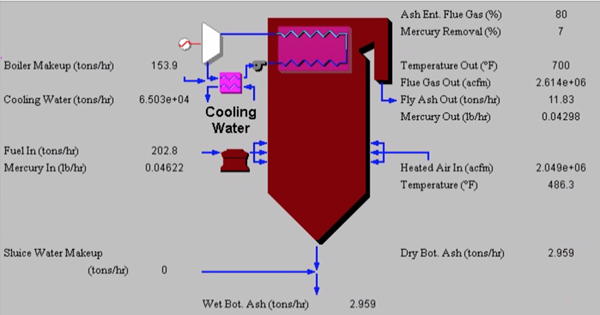
GET RESULTS: Base Plant: 1. Boiler: Diagram
This is very similar to the technology overview diagram shown in SET PARAMETERS. It is typically the same diagram, except that this version includes results rather than just labels.
The units used for flow rates on result diagrams are determined by the Result Flow Rates and Result Time Period units selected in CONFIGURE PLANT: Unit Systems .
Diagrams do not include economic results; those are all presented in tables.
Copyright © 2022-2026 University of Wyoming. All rights reserved. Visit us at https://www.iecm-online.com/