|
IECM 13.1 User Manual > Modules Included with the IECM > Pulverized Coal (PC) Plant > GET RESULTS > CO2 Capture, Transport & Storage > 1. Chemical Looping > Chemical Looping Diagram |
|
The Chemical Looping Diagram result screen shows the major flows into and out of the chemical looping CO2 control system:
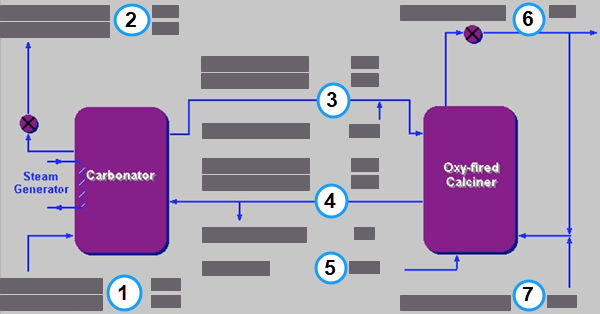
PC: GET RESULTS: CO2 Control: 1. Chemical Looping: Chemical Looping Diagram
The following values are shown:
•Area 1: Flue Gas Entering the Carbonator:
•Flue Gas In: This is the flow rate of flue gas entering the carbonator.
•Temperature: This is the temperature of flue gas entering the carbonator.
•Area 2: Flue Gas Exiting the Carbonator:
•Flue Gas Out: This is the flow rate of flue gas exiting the carbonator.
•Temperature: This is the temperature of the flue gas exiting the carbonator.
•Area 3: Rich Sorbent Exiting the Carbonator:
•Rich Sorbent: This is the flow rate of rich sorbent exiting the carbonator.
•Temperature: This is the temperature of rich sorbent exiting the carbonator.
•Makeup LS: This is the flow rate of makeup sorbent (Limestone).
•Area 4: Lean Sorbent Exiting the Calciner:
•Lean Sorbent: This is the flow rate of lean sorbent exiting the calciner.
•Temperature: This is the temperature of lean sorbent exiting the calciner.
•Solids Purge: This is the sorbent purge flow rate.
•Area 5: Coal Entering the Calciner:
•Coal: This is the flow rate of coal entering the calciner.
•Area 6: CO2 Product Exiting the Sorbent Regenerator:
•CO2 Product: This is the CO2 (and impurities) captured and exiting from the sorbent regenerator after being treated in the CO2 absorber.
•Area 7: Oxidant from the ASU:
•Ox. from ASU: This is the flow rate of oxidant from the ASU.
Copyright © 2022-2026 University of Wyoming. All rights reserved. Visit us at https://www.iecm-online.com/