|
IECM 13.1 User Manual > Modules Included with the IECM > Pulverized Coal (PC) Plant > GET RESULTS > CO2 Capture, Transport & Storage > 1. Membrane System > Membrane System Diagram > 2-Stage Cascade |
|
The following diagram is shown for the 2-Stage Cascade configuration:
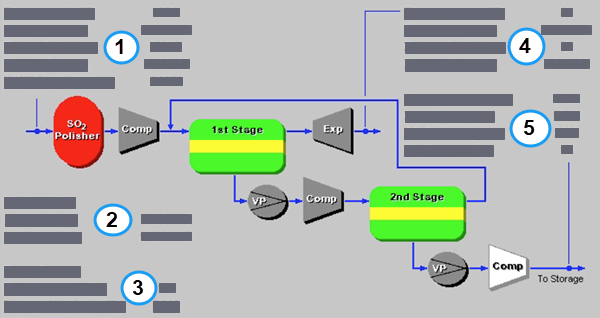
PC: GET RESULTS: CO2 Capture, Transport & Storage: 1. Membrane System: Membrane System Diagram (2-Stage Cascade)
The following results are shown:
•Area 1: Flue Gas Entering the Membrane System:
•Temperature In: This is the temperature of flue gas entering the membrane system.
•Flue Gas In: This is the flow rate of flue gas entering the membrane system.
•Fly Ash In: This is the flow rate of fly ash entering the membrane system.
•Mercury In: This is the flow rate of mercury entering the membrane system.
•NaOH Caustic: This is the flow rate of NaOH caustic required for the SO2 polisher.
•Area 2: Membrane Size:
•1st Stage: This is the separation area of the first-stage membrane.
•2nd Stage: This is the separation area of the second-stage membrane.
•Area 3: Design Pressure:
•Feed Side: This is the feed-side pressure.
•Permeate Side: This is the permeate-side pressure.
•Area 4: Flue Gas Exiting the Membrane System:
•Temperature Out: This is the temperature of flue gas exiting the membrane system.
•Flue Gas Out: This is the flow rate of flue gas exiting the membrane system.
•Fly Ash Out: This is the flow rate of fly ash exiting the membrane system.
•Mercury Out: This is the flow rate of mercury exiting the membrane system.
•Area 5: Membrane System Performance:
•CO2 Captured: This is the amount of CO2 captured.
•Impurities: This is the amount of impurities in the CO2 product.
•CO2 Pressure: This is the compressed CO2 product pressure. The product stream is compressed and sent through the pipeline system to the configured sequestration system .
•CO2 Removal: This is the CO2 removal efficiency.
Copyright © 2022-2026 University of Wyoming. All rights reserved. Visit us at https://www.iecm-online.com/