|
IECM 13.1 User Manual > Modules Included with the IECM > Pulverized Coal (PC) Plant > GET RESULTS > CO2 Capture, Transport & Storage > 5. CO2 Storage > Geologic > CO2 Storage Diagram |
|
The CO2 Storage Diagram result screen shows the major flows into the CO2 storage system in all plant types. The site characteristics are also summarized:
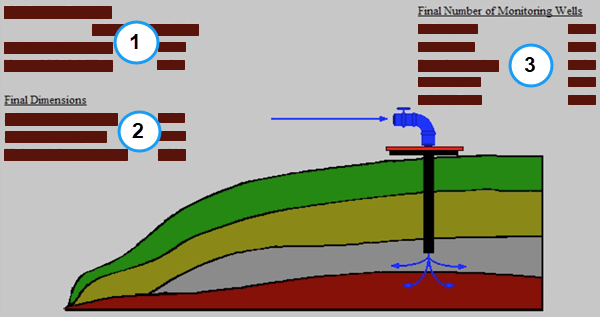
PC: GET RESULTS: CO2 Control: 5. CO2 Storage: CO2 Storage Diagram
The following values are shown:
•Area 1: CO2 Injection:
•CO2 Storage Resource: This is the amount of CO2 that can be stored at the reservoir.
•CO2 Plume Size: This is the CO2 injection plume size.
•Num. of CO2 Inj. Wells: This is the number of CO2 injection wells in the reservoir.
•Area 2: Final Dimensions:
•3D Seismic Area: This is the final area of the 3D seismic margin.
•3D AOR Area: This is the final area of the 3D allowable operating region (AOR) margin.
•2D Seismic Length: This is the length of the 2D seismic margin.
•Area 3: Final Number of Monitoring Wells:
•In Reservoir
•Above Seal
•Dual Completion
•Groundwater
•Vadose Zone
Copyright © 2022-2026 University of Wyoming. All rights reserved. Visit us at https://www.iecm-online.com/