|
IECM 13.1 User Manual > Modules Included with the IECM > Pulverized Coal (PC) Plant > GET RESULTS > Water Systems > Wet Cooling Tower or Wet Unit > Cooling Tower Diagram |
|
The Cooling Tower Diagram result screen shows the major flows into and out of the wet cooling tower in all plant types:
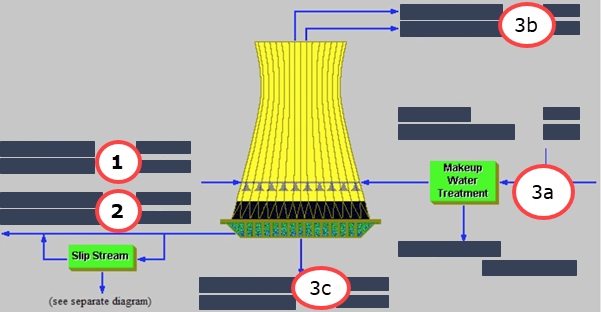
PC: GET RESULTS: Water Systems: Wet Cooling Tower: Cooling Tower Diagram
Each result is described briefly below:
•Area 1: Cooling Water Entering the Wet Tower
•Water In: The amount of recirculating cooling water entering the wet tower. This depends on the plant size, steam cycle heat rate and cooling water temperature drop range. It is the sum of cooling water through the main steam cycle, and amine-based carbon capture system if applicable.
•Temperature In: The temperature of recirculating cooling water entering the wet tower.
•Area 2: Cooling Water Exiting the Wet Tower
•Water Out: The amount of recirculating cooling water exiting the wet tower. This is equal to the amount of cooling water entering the wet tower based on water mass balance. It is the sum of cooling water through the main steam cycle, and amine-based carbon capture system if applicable.
•Temperature Out: The temperature of recirculating cooling water exiting the wet tower. This is calculated in terms of the inlet cooling water temperature and cooling water temperature drop range.
•Wet Tower Performance
•Area 3a
•Alum: The amount of alum used for makeup water treatment.
•Makeup Water: The cooling tower operation is maintained by making up fresh water at the same rate as the water losses (evaporation, blowdown, and drift loss) from the tower.
•Makeup Underflow: This output gives the amount of wastes from cooling makeup water treatment system.
•Area 3b
•Drift Loss: A relatively small amount of entrained water lost as fine droplets in the air discharge from a tower, which is frequently referred to as tower drift loss.
•Evaporation: In wet cooling towers, water has direct contact with ambient air and cooling is achieved mainly by the evaporation process in which some of the water leaves with the air. The evaporation process is the largest source of cooling tower water losses. That is estimated based on the mass and energy balance mode. Evaporation loss varies with meteorological conditions and displays a seasonal pattern.
•Area 3c
•Basin Sludge: This output specifies the amount of the basin sludge of the cooling tower system. This is an intermittent waste stream that contains collected soil, dust, and suspended solids in the tower basin.
•Blowdown: Because water evaporated in the cooling tower consists of pure water, the concentration of salts or other impurities will increase in the recirculating water. To avoid a high concentration and subsequent scaling of the surface within the tower, it is necessary to blow down a portion of the water that depends on the cycle of concentration and evaporation loss.
Copyright © 2022-2026 University of Wyoming. All rights reserved. Visit us at https://www.iecm-online.com/