|
IECM 14.0 beta User Manual > Modules Included with the IECM > Low-Carbon Hydrogen Production & Transport > GET RESULTS > Hydrogen Purification > Pressure Swing Adsorption > Purification Diagram |
|
The Purification Diagram diagram screen shows the major flows into and out of the PSA unit:
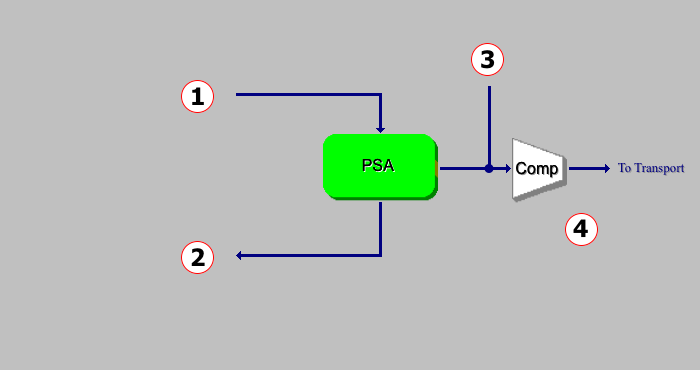
GET RESULTS: Hydrogen Purification: Purification Diagram
The following values are shown:
•Area 1:
•Syngas In: The gas flow into the PSA reactor.
•H2 Conc.: The H2 concentration of the gas flow into the PSA reactor.
•CO Conc.: The CO concentration of the gas flow into the PSA reactor.
•Temperature: The temperature of the gas flow into the PSA reactor.
•Pressure: The pressure of the gas flow into the PSA reactor.
•Area 2:
•Tail Gas: The tail gas flow exiting the PSA reactor.
•H2 Conc.: The H2 concentration of the tail gas flow exiting the PSA reactor.
•CO Conc.: The CO concentration of the tail gas flow exiting the PSA reactor.
•CH4 Conc.: The CH4 concentration of the tail gas flow exiting the PSA reactor.
•Temperature: The temperature of the tail gas flow exiting the PSA reactor.
•Pressure: The pressure of the tail gas flow exiting the PSA reactor.
•Area 3:
•H2 Out: The H2 product flow exiting the PSA reactor and entering the compressor.
•H2 Conc.: The H2 concentration of the H2 product flow exiting the PSA reactor and entering the compressor.
•Temperature: The temperature of the H2 product flow exiting the PSA reactor and entering the compressor.
•Pressure: The pressure of the H2 product flow exiting the PSA reactor and entering the compressor.
•Area 4:
•H2 Product: The H2 product flow exiting the compressor.
•Pressure: The pressure of the H2 product flow exiting the compressor.
Copyright © 2022-2026 University of Wyoming. All rights reserved. Visit us at https://www.iecm-online.com/