Lecture notes for ZOO 4400/5400 Population Ecology
Lecture 9 Mon 4-Feb-13
Patterns of survival and mortality, part 2.
Return to Main Index page Go
back to notes for Lecture 8, Fri 1-Feb Go
forward to notes for Lecture 10, Wed 6-Feb
Suggested reading: Keyfitz, Simpson's paradox (on
WyoWeb)
Handouts (on WyoWeb): demographic terms; Excel spreadsheet for life tables; xcel spreadsheet composite life table formulation for Dall sheep;
Excel spreadsheet for µx "force of mortality
Last time I talked about broad patterns of
mortality,
Type I, II, and III survivorship curves, why birds and bats might have
generally longer lifespans than mammals of comparable size and then
ended
by introducing an example of Simpson's paradox. (I have put a reading
assignment
from a book by Nathan Keyfitz in the WyoWeb
folder).
Try another one with "political"
implications. Female
applicants to Berkeley were turned down at a rate considerably higher
than
that for men. Their test scores (GREs) were higher than the men's.
Bias?
Actually not; department by department, female acceptance rates were
higher
than those for males (in accord with their higher test scores). How can
this be?
Answers:
French Canadians are a minority
of the whole
population and most of them live in Quebec.
Women applied to departments with lower
acceptance
rates.
These two examples are essentially weighted
average/heterogeneity
problems. [Source for Simpson's paradox material: pp.
385-391
In
Keyfitz (1985). That section of his book is in the suggested
reading
folder in the WyoWeb folder].
I raised the issue of Simpson's paradox,
because
it applies to the problem of detecting senescence in natural
populations
of birds. The dogma has long been that birds have fairly constant
mortality
rates and do not exhibit marked senescence. Analysis of data for
mammals
provides the expected-from-theory pattern of senescence. Why not
birds?
Simpson's paradox is a very slippery and
potentially
confounding problem. Heterogeneity (differences between groups or
categories)
can mask or confound patterns that would be apparent in a homogeneous
group
or category. Unless we know how/where to create categories and analyze
our data we may get "patterns" or "results" at one scale that don't
apply
at another scale.
Let's apply Simpson's paradox to
mortality. Heterogeneity
can apply in two ways that could obscure underlying causes and
patterns.
The source of the heterogeneity could be in the population (e.g., high
quality individuals vs. low quality individuals) or in the processes
that
act on the population (a force decreasing mortality late in life
balancing
one that increases it later in life).
1) Selection through time.
Worst die off first at high rate; best die off at low rate that
accelerates
throughout the life span. Result? An apparently flat pattern of
mortality
for the population as a whole. The heterogeneity here is in the
"quality"
of individuals. "Good" and "bad" individuals have different death rates
over time. The problem is to tell the "good" from the "bad" by
something
other than the rate at which they die. That may often be very difficult.
2) Conflicting processes
(here the processes
are the source of the heterogeneity). Two sources of mortality acting
simultaneously
in opposite directions might cancel each other out. A physical example
of conflicting processes is the generation of two sound waves of
opposite
shape --the result is apparent silence. This is the basis for
headphones
that "cancel" airplane engine noise. We can imagine similar processes
occurring
with mortality. One process increasing mortality early in life (or in
one
possibly unrecognized, uncategorized portion of the population) and
another
decreases it later in life. The cancellation produces an overall
pattern
of no change, but within a category (just the airplane engine or just
the
silencer headphones), quite a lot is going on that might be of real
interest.
Let's look at some data for Florida
Scrub-Jays to
see what emerges if we CAN detect a potentially confounding source of
heterogeneity.
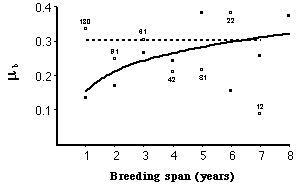
Fig. 9.1. Force of mortality, µx, for Florida Scrub-Jays as a function of age (measured as breeding span, meaning the number of
years that an individual survived as a breeder). If we look at all the birds in the population we see no evidence of senescent
mortality (dashed line, based on open circles). If, however, we look only at the subset
of "high-quality" individuals then we see a clear increase (solid
line,
based on solid symbols). Why no overall pattern? Because the full
data
set includes a contingent of very "low-quality" individuals that die
off
quickly. The high mortality, early on, of these low-quality birds pulls
up overall mortality to the dashed line. Selection through
time
weeds them out and the remaining (mostly high-quality) birds have
mortality
that increases with age. [From McDonald et al.
1996].
The force of mortality, µx, is a useful measure because, unlike age-specific
survivorship (qx), it is independent of the census
interval.
This means, for example, that it permits us to compare annual survival
in elephants to daily survival in fruit flies.
The Florida Scrub-Jay analysis suggests
that, like
other animals, birds probably do have a pattern of senescent mortality
(mortality increasing with age rather than a strictly constant Type II
curve). The problem is, it is hard to know that the population consists of two different pools -- "high-quality" and "low-quality." Using higher mortality as a basis for detecting "low-quality" won't work because it is circular logic. For many bird populations we have no independent criterion on which to base judgment of quality (in the scrub-jays they differ in their fledging rates).
We've seen some broad patterns in
mortality/survivorship
and some of the problems in detecting patterns within populations. How
do we measure estimate survival mortality? First, let's make sure we
remember
why the subject matters. Mortality -- along with emigration -- is a
major
force acting to decrease population size or cause a negative growth
rate.
Life table analyses
(see Gotelli text, pp.
50-59).
How do we measure survival/mortality and
how
do we organize the data? It is generally easier to measure
survival
than mortality because we rarely observe mortality events and rarely
find
dead animals. What we can do is count how much of the population is
left
at the end of an interval -- the survival. The difficulties in
estimating
survival arise from the same kinds of problems we have in estimating
population
size and age structure. To estimate survival we must measure population
size at the beginning and end of some interval(s) and do this
accurately
enough to feel comfortable with the difference we estimate. In
some
cases we may have to make shaky assumptions such as that individuals
not
sighted died (rather than, for example, emigrating).
One of the major ways to organize
survival data is
in what's called a life table. Three major types of life tables exist —
the differences among them center on how we gather the data.
I. Cohort or dynamic life table
-- this
type of life table is based on a single year class or cohort (e.g., all
animals hatched or born in 1981). We keep track of those
individuals
and recount them yearly, keeping track of the number of deaths.
We
follow the cohort until all have died. The cohort life table
approach
is generally not feasible for very longlived species. The cohort
approach does generally yield the best data, but it also makes
the most
assumptions (e.g., that the cohort(s) tracked accurately represents
the population) and is usually the most difficult to obtain in the
field.
II. Static or time specific
— data gathered
during a short period of time
We take a cross section of age classes at
one instant
Estimate mortality by age class — estimating age
specific mortality from sample of current age structure. Mortality
cannot
readily be inferred because present age structure may depend not only
on
current mortality but also on number of young produced in past years
and
on mortality during previous time periods.
Major assumptions
Birth rate has
been constant
Mortality rate has
been
constant
Population is at
equilibrium
(stable age distribution)
We have unbiased
sample
of population
Go to Excel spreadsheet illustrating the
difference between a cohort and static life table with a hypothetical numerical example.
III. Composite life table — uses data collected
over an indefinite period (several years) involves a number of cohorts
and samples a cross section of population. It combines following individuals
through time with the (logistically easier) method of making inferences
from the current age structure.
Composite tables most often used in
wildlife because
you can pool data over number of years — increase sample size & don't
have to follow cohort to death. Its assumptions are more likely to be met:
Age structure constant
Population is stationary (neither growing nor shrinking)
Disadvantages: - Averaging over years masks temporal variation that may be of interest to managers.
I have placed an example of a "composite"
life table for Dall sheep in an Excel spreadsheet on the WyoWeb course site (in the "Handouts" folder). The data for this example were calculated from Dall
sheep
skulls collected in McKinley Park by Murie in the 1940’s. The data are
neither from a single cohort nor from a single slice in time. Instead, they
represent
a (we hope more or less random) sample of individuals that died over a
series of years. Note that viewing the data as lx
(proportion surviving), qx (age-specific mortality rate), and mx (force of mortality), emphasize different aspects of the life
history. For example, all three pick up the blip of mortality at age two (when
young
animals become independent and vulnerable, and young males often wander
widely). qx and mx emphasize the
jagged
tail end of the curve. This is a common feature of such data,
where
sample sizes get very small at advanced ages and zigzag up and down
somewhat
erratically.
WyoWeb folder also has a "handout"
on the various lx, qx, dx,
and
other demographic terms used in life table analyses.
Estimating survival
An extensive literature exists for
estimating survival
rates, particularly from mark-recapture data. That falls
more
in the province of a wildlife techniques course such as ZOO 4300.
One of the major techniques is some variant on Jolly-Seber models.
Good references include:
Caughley, 1977
Krebs, 1999, Ch. 14.
Software sources include:
http://nhsbig.inhs.uiuc.edu/www/index.html
http://archives.math.utk.edu/mathbio/statSoftware.html
http://www.snv.jussieu.fr/Bio/ulm/autoulm.exe
http://www.snv.jussieu.fr/Bio/ulm/ulm.html
References:
Caughley,
G. 1977. Analysis of Vertebrate Populations. Wiley, New York.
Keyfitz,
N. 1985. Applied Mathematical Demography. Springer-Verlag, NY.
Krebs,
CJ. 1999. Ecological Methodology. (Ch. 14 Estimation of survival
rates). Benjamin Cummings, NY.
McDonald,
D.B., J.W. Fitzpatrick, and G.E. Woolfenden. 1996. Actuarial senescence
and demographic heterogeneity in the Florida scrub jay. Ecology 77:
2373-2381.
§§§§§§§§§§§§§§§§§§§§§§§§§§§§§§§§§§§§§§§§§§§§§§§§§§§§§§§§§§§§§§§
Return to top of page
Go
forward
to notes for Lecture 10, 6-Feb