
WY-Adapt takes a geospatial thru-hike
Amanda Eisenberg
Published July 16, 2025
The WY-Adapt Data Repository (wyadapt.org) can be used for many purposes – checking on current conditions, planning for future adaptation, looking back and looking forward. Today we are highlighting an out-of-the-box student project using the WY-Adapt interface in a creative and personal way.
“My name is Amanda Eisenberg, and I have a bachelor’s degree in environmental science from Western Washington University. Right now, I work as a wildlife guide in Grand Teton and Yellowstone. Spring 2025 was my first semester working remotely on a certificate for Geospatial Information Systems (GIS) at the University of Wyoming.
First steps into coding
As part of the certificate, I took the course “Basics of Spatial Data Science” taught by Shannon Albeke. He is leading the development of the WY-Adapt platform and suggested using it for my project. I'd never done coding prior to this or used an API like the WY-Adapt interface. It was definitely a learning curve, with all the spatial analysis, the math involved and everything else, but using the API turned out to be pretty straightforward. WY-Adapt has instructions on how to enter the language and directions. Overall, it was quite user friendly, even for a beginner like me.
For my course project, I looked at the Continental Divide Trail (CDT), which crosses several major US watersheds, and explored how the water availability along the trail might change in the future. Using a shapefile made by the Continental Divide Trail Coalition that contained the trail’s location, shape, and key attributes, I used RStudio and SQL to place points every 10 kilometers. Since the CDT trail stretches over more than 3,000 miles all the way from Mexico to Canada, this added up to nearly 500 individual points. On the WY-Adapt interface I picked variables like precipitation and snowpack. While WY-Adapt is focused on Wyoming, I was able to access data for the whole region. For each of these points I ran the data from 1990 to 2050 to see if the variables change over time and how that would affect water availability on the trail.
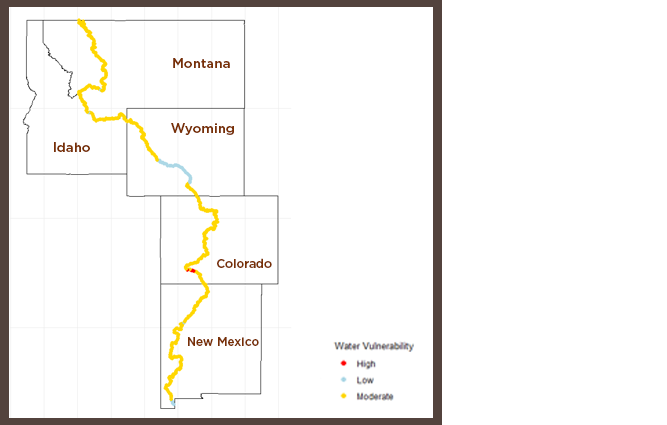
The water vulnerability map of the CDT shows a stretch in southern Colorado especially vulnerable to future water shortages
Water availability in my project is a combination of various factors: snowpack, precipitation, consecutive wet or dry days. With all of these factors, I built a vulnerability index to see which regions might be most affected. This was then visualized in a map that shows the level to which a section of the trail is vulnerable to water changes. The southern end of the trail – New Mexico and Colorado – looked particularly vulnerable, with declining snowpack, rising temperatures and less consistent precipitation. These areas could eventually become harder places for hikers to find water.
I also looked at individual variables and used RStudio to make maps for them: Considering precipitation, for example, some areas became wetter while others became drier over the 60-year period: New Mexico, showed a consistent decline, while Montana and Colorado looked to be wetter. I also investigated the change of consecutive wet days: How many days in a row would a location get more than 1mm of rain? In some parts of the CDT there were more wet spells that can lead to flooding and more mud. In other places the wet periods were shorter, which can make rain less useful for refilling water sources and turn water sources for hikers very inconsistent to find.
About the Geographic Information Systems Certificate
The University of Wyoming has earned its Research Level 1 (R1) status from the Carnegie Classification of Institutions of Higher Education, placing Wyoming's only four-year university with the top research universities in the United States.