
Grasshoppers of Wyoming and the West
Entomology
Decreasing Economic and Environmental Costs Through Reduced Area and Agent Insecticide Treatments (RAATs) for the Control of Rangeland Grasshoppers: EMPIRICAL RESULTS AND THEIR IMPLICATIONS FOR PEST MANAGEMENT
JEFFREY A. LOCKWOOD and SCOTT P. SCHELL
Entomology Section
University of Wyoming
Laramie, Wyoming 82071
ABSTRACT
Reduced area and agent treatments (RAATs) for management of rangeland grasshopper infestations were compared with blanket applications of 2 standard compounds at traditional rates (100% of infestations treated with carbaryl applied at 16 oz/ac or malathion applied at 8 oz/ac) in southeastern Wyoming during 1995-96. Two RAATs applications of carbaryl (12 oz/ac applied in alternating swaths to 66% of infestations [12-66] and 8 oz/ac applied in alternating swaths to 50% of infestations [8-50]) were essentially indistinguishable from the standard treatment, with 80 to 90% grasshopper mortality. A carbaryl 8-33 treatment resulted in only 40 to 60% control. Mortality following application of 4 oz/ac of malathion in alternating swaths to 80% of an infestation (4-80) was indistinguishable from the standard application, with 75 to 90% control. However, a malathion 4-50 treatment resulted in only 55 to 65% control. Fipronil (14 oz/ac) applied to 25% of an infestation resulted in 80 to 90% control, comparable to the highest rates of mortality with the other RAATs. The greatest benefit:cost ratios (>2.8:1) were seen with the carbaryl 8-50, malathion 4-80, and fipronil 14-25 treatments. The RAATs strategy appears to depend on movement of grasshoppers from untreated to treated swaths and on the conservation of natural biological control agents. Had RAATs methods been used during the 1986-88 outbreak in the western US, pest managers would have saved $38 million and used 34 million metric tons less insecticide. _________________________________________________________________________
Keywords: Acrididae, pest management, insecticide, barrier treatment
Grasshoppers (Insecta: Orthoptera, Acrididae) annually consume 22% of rangeland forages in the western US at an estimated loss of $400 million (Hewitt and Onsager 1983). With legislation mandating federal participation in grasshopper control and the advent of aerial applications of insecticides, the foundation of our current grasshopper control strategy was established (Pfadt and Hardy 1987). Until 1996, the United States Department of Agriculture Animal and Plant Health Inspection Service (USDA-APHIS) subsidized the full cost of control on federal lands, one-half of the cost on state lands, and one-third of the cost on private lands. Large-scale use of broad-spectrum insecticides had become virtually the sole approach to rangeland grasshopper control (Pfadt and Hardy 1987). During the 1986-88 outbreak, >8 million ha of rangeland were treated with 5 million liters of insecticide (primarily malathion) for grasshoppers in the western US at a cost of over $75 million (National Grasshopper Management Board 1995).
Throughout the western US, economic and environmental concerns virtually assure that massive grasshopper treatment programs will not be repeated (USDA-APHIS 1987, National Grasshopper Management Board 1995). Moreover, broad-spectrum insecticides may exacerbate grasshopper outbreaks by suppressing native biological control agents (Lockwood et al. 1988). Finally, due to federal budget reductions, APHIS recently announced that it will no longer conduct nymphal surveys or participate in treatments (Husnik 1995), effectively tripling the cost of grasshopper control to the private sector (based on land ownership patterns in the western US [Bureau of Land Management 1982-1986]). For the first time in >50 years, the responsibility for grasshopper control in the western US will be borne by the producer. Hence, there is a compelling need to develop strategies which reduce the amount of insecticides, sustain profits, and preserve nontarget and beneficial species (e.g., native biological control agents of grasshoppers and weeds [Lockwood et al. 1988, Joern and Gaines 1990]). The sense of urgency is enhanced by surveys in 1996, which show a dramatic upsurge in grasshopper population densities across the West (USDA-APHIS 1996).
A wide range of alternative management strategies were explored during the USDA-APHIS Grasshopper Integrated Pest Management Program (USDA-APHIS 1989-1994). While these approaches represent exciting directions for continued research, there are few applicable solutions to the urgent challenges of rangeland grasshopper management. Many of the developing approaches are quite sophisticated (e.g., grazing regimes and hot-spot suppression) and require extensive further development (e.g., biological control). There has been little investigation of simple and direct strategies to reduce insecticide use. Two such approaches to reducing the economic and environmental costs of suppressing grasshopper infestations are: using less insecticide per unit area and treating less area.
The application of insecticides in intermittent patterns to control relatively mobile pests has been investigated across a range of conditions. As the economic and environmental pressures on agriculture increase, this strategy will become increasingly viable. Given the mobility of acridids, the high cost of treating remote locations, and the relatively low value of immediately protected commodities (e.g., rangeland) it is not surprising that perhaps the greatest development of reduced area-agent treatments (RAATs) have occurred in the context of locust management. In Africa (USAID 1989, Krall et al. 1997), ex-USSR (Tsyplenkov 1978), and Australia (Australian Plague Locust Commission 1990) insecticides are applied in swaths that do not blanket an infestation but rely on the locust nymphs or adult to move into the treated areas.
Recently, extensive work on this method has been undertaken by PRIFAS (Research, Information and Training Program on Acridians of CIRAD, Centre de coopération internationale en recherche agronomique pour le développement-- a French governmental organization) in studies which have demonstrated that as little as 1 to 2 g (active ingredient [ai]) of fipronil per ha, applied in strips perpendicular to the direction of hopper band movement, is sufficient to cause 99% locust mortality in 7 d (Anonymous 1996, Rachadi and Foucart 1996, Launois and Rachadi 1997). With hopper bands of the desert locust, Schistocerca gregaria Forskål, insecticide "barriers" may be separated by as much as 1 km (Rachadi and Foucart 1996). Similarly promising results have been achieved with new insect growth regulators, which also represent potentially viable replacements for dieldrin in barrier treatments for locusts in Africa (Dorn et al. 1997, Musuna and Mugisha 1997, Scherere and Célestin 1997, Wilps and DiopIt 1997). It appears that virtually all of the methods development with the RAATs approach in acridology has been in the context of locusts, which are characterized by extensive, directional movements. The application of this strategy for grasshopper populations, which are much more sedentary, unpredictable in the directionality of movement, and structurally complex (i.e., taxonomically and hence behaviorally, developmentally, etc.) has not been pursued. Blanket applications of insecticides to entire infestations, often exceeding 10,000 ha, is the standard method of rangeland grasshopper control on the North American Great Plains. The purpose of our work was to begin the development and assessment of RAATs strategies for rangeland grasshopper infestations in the western US.
METHODS
1995 trials
Canal site. This site (Table 1 and Table 2) was divided into 4 plots, consisting of:
1) an untreated control of 39 ha,
2) the standard, programmatic (USDA-APHIS 1987) rate of carbaryl (Sevin 4-oil; 16 oz/ac [32 oz/ac total volume]; 1.1 l/ha; 610 g(ai)/ha treated) applied in a traditional blanket coverage to 39 ha (termed a 16-100 treatment [i.e., 16 oz/ac applied to 100% of the infestation]),
3) a reduced rate of carbaryl (12 oz/ac [24 oz/ac total volume]; 0.8 l/ha; 458 g(ai)/ha treated) applied in alternating swaths to two-thirds of a 78 ha plot (termed a 12-66 treatment, effectively 305 g(ai)/ha protected), and
4) a reduced rate of carbaryl (9 oz/ac [18 oz/ac total volume]; 0.6 l/ha; 343 g(ai)/ha treated) applied in alternating swaths to half of a 39 ha plot (termed a 9-50 treatment, effectively 172 g(ai)/ha protected) (Fig. 1).
The rates per ha protected refer to the amount of insecticide used in the treated swaths multiplied by the proportion of the untreated area (e.g., in the 9-50 treatment, carbaryl was applied at the rate of 343 g(ai)/ha to the treated swaths but since half of the infestation was untreated, the effective rate of application was 172 g(ai)/ha). All treatments were applied aerially on 7 July using a Grumman Agcat 450 B equipped with C-P nozzles (setting 062), flying at 10 m, with a 30 m swath width. Thus, for example, the 12-66 treatment involved 30-m wide treated swaths alternating with 15-m wide untreated buffers. Applications occurred between 04:30 and 08:00 when air temperatures were 16 to 22 oC and easterly winds were 0.5 to 4.5 m/sec (perpendicular to the direction of the swaths). Dye cards were not used to determine the actual or realized swath widths, but given the moderate cross breeze it is very likely that some insecticide drifted into the "untreated" swaths in this and subsequent applications.
Grasshopper densities within each plot were determined along 4 transects perpendicular to the direction of the swaths, separated by 50 m, and >30 m from an edge of the plot. Each transect consisted of 10, 930 cm2 (1 ft2) counts taken at 10 m intervals (Legg et al. 1993). Counts were recorded to maintain the sequence of observations for later analysis of spatial heterogeneity. Densities were determined 1 d before and 3, 7, 13, and 20 d after treatment. Percent mortalities were corrected for population dynamics in the untreated plots, using the method that Connin and Kuitert (1952) developed for grasshopper control trials [see Jech et al. (1993) for a recent application of this technique],
% mortality = 100 x (1 - ((Ta x Cb)/(Tb x Ca))),
where Ta and Tb are the grasshopper densities in the treated plot after and before treatment, respectively, and Ca and Cb are the grasshopper densities in the control plot after and before treatment. The developmental stages and species composition of the grasshopper assemblage were determined by taking 100 sweeps (50 high-fast and 50 low-slow) with a 35-cm diam sweep net to capture a sample of the acridids present.
66-Mountain site. This site (Table 1 and Table 2) was divided into 4, 33-ha plots which were treated and assessed as previously described, with an additional density estimate taken in 1996, 377 d after treatment.
1996 trials
Rutherford site. This site (Table 1 and Table 2) was divided into 7, 17-ha plots, consisting of:
1) an untreated control,
2) the standard rate of carbaryl (16-100; Sevin XLR 16 oz/ac [32 oz/ac total volume]; 1.1 l/ha; 561 g(ai)/ha treated) applied in a blanket coverage),
3) a half rate of carbaryl applied in alternating swaths to one-half of the plot (8-50, effectively 140 g(ai)/ha protected),
4) a half rate of carbaryl applied to one-third of the plot (8-33, effectively 92 g(ai)/ha protected),
5) the standard, programmatic (USDA-APHIS 1987) rate of malathion (8 oz/ac [8 oz/ac total volume]; 0.6 l/ha; 660 g(ai)/ha) applied in a traditional blanket coverage (8-100),
6) a half rate of malathion applied to four-fifths of the plot (termed a 4-80 treatment, effectively 264 g(ai)/ha protected), and
7) a half rate of malathion applied to and one-half of the plot (termed a 4-50 treatment, effectively 165 g(ai)/ha protected).
The treated swaths in the malathion plots were placed closer together than in the carbaryl plots because the half-life of malathion is about 2 d, compared to nearly 20 d for carbaryl (USDA-APHIS 1987). All treatments were applied aerially on 28 June, as previously described using 30 m swaths, between 05:00 and 07:30 when air temperatures were 18 to 23 oC and variable winds were <1.0 m/sec. Grasshopper densities and collections were made as previously described, but for purposes of efficiency while in the field the data were not collected so as to allow subsequent analyses of heterogeneity. Samples were taken at 2 d before and 1, 4, 6, 13, and 25 d after treatment. In addition to identifying the acridids, all other arthropods were identified to order.
Pollett site. This site (Table 1 and Table 2) was divided into 7, 16-ha plots which were treated and assessed as previously described for the Rutherford site. Treatments were applied on 24 July between 05:00 and 08:00 when air temperatures were 16 to 25 oC and shifting winds were <2.0 m/sec. Due to equipment malfunction, a portion of the carbaryl-treated plots did not receive the prescribed treatment. In our sampling, we omitted the areas (ca. 2 ha) to which insecticide was over-applied, but the application difficulties resulted in 10 to 20% lower rates of insecticide in the remaining portions of the plots. Grasshopper densities and collections were made as previously described at 1 d before and 1, 5, 9, and 16 d after treatment. In addition to identifying the acridids, a random subsample of 50 arthropods was identified to family.
Hubbs site. This site (Table 1 and Table 2) was divided into 8, 16-ha plots which were treated and assessed as previously described for the Rutherford site. Treatments were applied on 27 June between 05:00 and 08:00 when air temperatures were 13 to 18 oC and shifting winds were <1.0 m/sec. In addition to the treatments applied at the Pollett site, fipronil (Adonis 6 UL; 14 oz/ac [14 oz/ac total volume]; 1 l/ha; 6 g/ha ai) was applied to 25% of a plot (termed a 14-25 treatment). This compound is not registered for use in the US, so the total area of application was limited to 4 ha. The wide untreated intervals were chosen in light of the persistence of fipronil (ca. 34-d half-life [USEPA 1996]). Grasshopper densities and collections were made as previously described at 1 d before and 1, 4, 6, 13, 25, and 47 d after treatment. In addition to identifying the acridids, all other arthropods were identified to order and a random subsample of 50 specimens was identified to family.
Analyses
Grasshopper density and population structure. All statistical tests were done with the software program MSUSTAT (Lund 1986). For assessment of treatment effects on grasshopper densities, differences in the populations at each sampling date were analyzed with a one-way analysis of variance and Fisher's protected least significant difference test. Frequencies of grasshopper species and developmental stages among plots, before and after treatments, were assessed using 2 analyses. For all statistical analyses, differences were considered significant at P<0.05.
Spatial heterogeneity.Three approaches were taken to assessing spatial heterogeneity of the grasshopper populations using the 1995 transect data. The variance-mean ratio (based on the number of grasshoppers in each sample [Southwood 1978]), the one-sample runs test (where each sample was classified as having no grasshoppers or >1 grasshoppers [Siegel 1956]), and Morisita's index of aggregration (Im; Southwood 1978) were used with the transect data from each sampling date to evaluate the degree of clumping within the plots. Morisita's index avoids some of the analytical problems of the variance-mean ratio (Hurlbert 1990) and is a better measure of departure from randomness and tendency to aggregation.
Nontarget effects.The effects of treatments on nontarget arthropods were assessed with 2 approaches using the 1996 data. Differences in the frequencies of the 4 most commonly collected orders (Coleoptera, Diptera, Hemiptera, and Homoptera, comprising about 90% of the nontarget arthropod fauna) among the plots of the Hubbs site were assessed on each sampling date for carbaryl and malathion using 3x4 chi-square analyses. Too few non-target insects were collected at the Rutherford site to generate meaningful comparisons. It should be noted that an analysis of pretreatment samples revealed that with the ommission of 1 plot (malathion 4-50, with an exceptionally high frequency of Homoptera), there were no significant differences among plots. In addition to the frequency analyses, we examined the family richness across all insect orders based on subsamples taken on each sampling date in 1996, from each plot and site. Because of relatively low numbers of specimens, the samples were pooled across transects in a one-way analysis of variance with Fisher's protected lsd test.
Economic analyses. Analyses of the benefits and costs of the various treatments were conducted using the data from the Hubbs site because this area represented native grassland with rangeland grasshopper densities that are routinely treated and to which the most viable set of strategies were applied. The mortalities were based on those observed at 13 d after treatment. We used both CARMA (Hastings et al. 1996) and HOPPER (Berry et al. 1994) software with default settings. The former system uses case-, model-, and rule-based reasoning for Wyoming conditions to provide the user with a range of expected savings and management recommendations; the latter system uses primarily a modeling approach for the western US to provide the user with a benefit:cost ratio among other outputs.
RESULTS
1995 trials
Canal site. Although the grasshopper density in the control plot was significantly less than in 2 of the treated plots prior to the treatments, by 7 d after treatment, the densities in all of the treated plots were significantly less than in the control plot (Table 3). Perhaps most importantly, there were no significant differences among treated plots before treatment or 7 to 20 d after treatment. Hence, the results of the RAATs methods were indistinguishable from those of the traditional, blanket application strategy. From 7 to 20 d after treatment, mortality averaged 86% in the standard, 16-100 plot and 83 and 79% in the 12-66 and 8-50 plots, respectively (Fig 2).
66-Mountain site. Grasshopper densities did not differ significantly among plots prior to treatment, but significant declines in all treated plots were found by 3 d after treatment (Table 3). Except for 20 d after treatment, when the 8-50 plot had significantly lower densities than the other treated plots, the treatments were statistically indistinguishable. From 7 to 20 d after treatment, mortality averaged 80% in the standard, 16-100 plot and 82 and 83% in the 12-66 and 8-50 plots, respectively (Fig 2). The grasshopper densities in all plots increased from 1995 to 1996, but densities in the plots treated in 1995 remained well below the regionalized economic threshold the next year (Davis et al. 1992), suggesting that sustained suppression with the RAATs method is possible.
Taxonomic and Developmental Effects. The frequency distributions of the grasshopper species and developmental stages in the untreated control and treated plots did not differ significantly prior to treatment or at days 1 and 3 after treatment. Thus, these treatments did not have any differentiating effect on rangeland grasshoppers shortly after treatment, with respect to the species or developmental stages present in typical infestations. The numbers of specimens collected in the treated plots thereafter were too small to allow reliable analysis.
Spatial heterogeneity. The one-sample runs test failed to reject the hypothesis of random distributions in the transects of all plots at both sites prior to treatments. In only 2 cases did the runs test reveal a significant deviation from randomness -- in the untreated plot at the Canal site 13 d after treatment and in the 8-50 plot at the 66-Mountain site 3 d after treatment.
The variance-mean ratio averaged 0.91+0.15 (sd) across all plots and sites prior to treatments, suggesting an essentially random distribution of grasshoppers (a value of 1.0 being expected for a random distribution, with lower values indicating a uniform distribution and higher values indicating an aggregated or clumped dispersion). One day after treatments, the RAATs plots had ratios ranging from 0.67 to 1.04 (mean+sd = 0.81+0.16) and the untreated and blanket treated plots had ratios ranging from 0.80 to 0.93 (mean = 0.86+0.06). Subsequently, ratios in the RAATs plots ranged from 0.67 to 1.37 (mean = 0.99+0.18). There was some indication of increasing heterogeneity with time; the maximum mean ratio occurring 20 d after treatment. The ratios in the other plots from 3 to 20 d after treatment ranged from 0.44 to 1.03 (mean = 0.85+0.21).
Morisita's index of aggregation (Im) is the increased probability of 2 randomly selected individuals occurring in the same sample compared with the probability of such an occurrence given a random distribution where Im =1 (e.g. a value of 2.4 for Im would mean that the probability of 2 individuals being from the same sample is 1.4 times greater than if the grasshoppers were randomly distributed). Hence, prior to treatment the mean Im for the plots was 0.92+0.22 (range = 0.42 to 1.14), suggesting an essentially random dispersion. One day after treatments, the RAATs plots had values ranging from 0.49 to 1.19 (mean+sd = 0.73+0.32), and the untreated and blanket treated plots had ratios ranging from 0.60 to 0.91 (mean = 0.77+0.14). Subsequently, indices in the RAATs plots ranged from 0.10 to 1.73 (mean = 0.74+0.64). As with the variance-mean ratio, the maximum index occurred 20 d after treatment. From 3 to 20 d after treatment the ratios in the blanket treated and untreated plots ranged from 0.58 to 2.14 (mean = 1.03+0.64).
Based on the results of these 3 analyses (one-sample runs test, variance-mean ratio, and Im) we conclude that there was no indication that the RAATs methods generated persistently aggregated spatial heterogeneity, clumping, or aggregation, as might be expected from a discontinuous application of insecticide. Thus, it appears that grasshoppers may readily move from untreated to treated swaths.
1996 trials
Hubbs site. Grasshopper densities did not differ significantly among plots before treatment in the carbaryl trials (Table 4). Densities in the 16-100 plot were significantly lower than in the 8-50 plot at 1 and 4 d after treatment. From 6 to 46 d after treatment, these 2 plots did not differ significantly. The carbaryl 8-33 plot had significantly higher densities of grasshoppers than the other treated plots from 6 to 25 d after treatment. Thus, from 6 to 47 d after treatment the 16-100 and 8-50 plots averaged 93 and 90% mortality, respectively, while the 8-33 plot averaged 55% mortality (Fig. 2).
Grasshopper densities were significantly higher in the malathion 4-80 plot than in the 8-100 plot prior to treatment (Table 4). However, grasshopper densities in these 2 plots did not differ significantly from 6 to 47 d after treatment. These plots had significantly lower densities of grasshoppers than the 4-50 plot from 4 to 25 d after treatment. Thus, the 8-100 and 4-80 plots averaged 96 and 90% mortality from 6 to 47 d after treatment, while mortality in the 4-50 plot averaged only 49% (Fig. 3).
Comparing across insecticides suggests that malathion generated significant reductions in grasshopper densities faster than carbaryl, with fipronil (82% mortality from 6 to 47 d after treatment) being intermediate in this regard. However, the grasshopper densities in the carbaryl 8-50, malathion 4-80 and fipronil plots did not differ significantly from 6 to 47 d after treatment. These treatments yielded 82 to 90% mortality during this period of time, while the lowest application rates yielded 49 to 55% mortality.
Pollet site. Grasshopper densities did not differ significantly among plots before treatment in the carbaryl trials (Table 4). Densities in the 16-100 plot were significantly lower than in the 8-50 plot only at 9 d after treatment. The carbaryl 8-33 plot had significantly higher densities of grasshoppers than the standard 16-100 treatment from 9 to 16 d after treatment. Thus, from 5 to 16 d after treatment the 16-100 and 8-50 plots averaged 79 and 70% mortality, respectively, while the 8-33 plot averaged 49% mortality (Fig. 2).
Grasshopper densities did not differ significantly among the malathion plots prior to treatment (Table 4). Although, grasshopper densities in the 8-100 and 4-80 plots did not differ significantly in the 5 d following treatment, the densities in the former treatment were significantly lower than in the latter treatment from 9 to 16 d. These plots had significantly lower densities of grasshoppers than the 4-50 plot at 1, 5, and 16 d after treatment. Thus, the 8-100 and 4-80 plots averaged 79 and 61% mortality from 5 to 16 d after treatment, while mortality in the 4-50 plot averaged 60% (Fig. 3).
As with the observations at the Hubbs site, malathion generated reductions in grasshopper densities faster than carbaryl. However, the grasshopper densities in the carbaryl 8-50 and malathion 4-80 plots did not differ significantly from 5 to16 d after treatment but tended to be somewhat higher than in the plots treated with blanket applications.
Rutherford site. Grasshopper densities did not differ significantly among plots before treatment in the carbaryl trials (Table 4). Densities in the 16-100 plot were significantly lower than in the 8-50 plot only at 1 and 6 d after treatment. Except for 13 d after treatment, the carbaryl 8-33 plot had significantly higher densities of grasshoppers than the standard 16-100 treatment, but the 8-33 plot had significantly higher densities than the 8-50 plot only 25 d after treatment. Thus, from 6 to 25 d after treatment the 16-100 and 8-50 plots averaged 55 and 64% mortality, respectively, while the 8-33 plot averaged 39% mortality.
Grasshopper densities did not differ significantly among the malathion plots prior to treatment (Table 4). Grasshopper densities in the 8-100 and 4-80 plots differed significantly only at 6 d after treatment. However, the densities in the 4-50 plot were significantly greater than in the standard, 8-100 plot at all post-treatment times except 13 d. The 4-50 plot also had significantly higher densities than the 4-80 plot at 1 to 6 d, but not 13 to 25 d, after treatment. Thus, the 8-100 and 4-80 plots averaged 77 and 73% mortality from 1 to 25 d after treatment, while mortality in the 4-50 plot averaged 61%.
As with the observations at the Hubbs site, malathion generated reductions in grasshopper densities faster than carbaryl. However, the grasshopper densities in the carbaryl 8-50 and malathion 4-80 plots did not differ significantly from 5 to 16 d after treatment but tended to be somewhat higher than in the plots treated with blanket applications. The lowest application rates (carbaryl 8-33 and malathion 4-50) yielded an average of 50% mortality, while the other RAATs and standard methods yielded averages of 68 and 66% mortality, respectively.
Taxonomic and Developmental Effects. The frequency distributions of the grasshopper species and developmental stages in the untreated control and treated plots did not differ significantly prior to treatment or at days 1 (malathion and carbaryl plots) and 4 (carbaryl plots) after treatment. Thus, these treatments did not have any differentiating effect on rangeland grasshoppers shortly after treatment, with respect to the species or developmental stages present in typical infestations. The numbers of specimens collected in the treated plots thereafter were too small to allow reliable analysis.
Non-target effects. Before treatment, the frequencies of the 4 major orders did not differ significantly among the malathion or carbaryl plots (Table 5). Significant differences among plots were found at 1 and 4 d after treatment with malathion and at all post-treatment dates with carbaryl. Hence, the standard and RAATs methods had more strongly differentiated effects in the carbaryl treatments than in the malathion treatments. These findings should be considered preliminary, as we do not have data concerning the actual densities (only the relative proportions) of non-target organisms.
Taxonomic richness before treatment averaged 9.8 + 4.1 families per plot, and there were no significant differences among plots. The only significant differences in family richness after treatment were found in malathion (8-100 and 4-50) treated plots, which had lower richness (3.5 + 1.5 and 2.0 + 0.0 families, respectively) than untreated and carbaryl (16-100 and 8-33) plots (8.0 + 2.8 and 8.5 + 0.7 families, respectively) at 6 d after treatment. Thus, there was little indication of significant reductions in nontarget diversity at the family level as a consequence of the treatments.
Economic Analysis. The economic analyses of the standard and RAATs methods demonstrated striking differences in terms of the return on investment (Table 6). The combination of reduced and 40 to 62% for malathion. Although the RAATs approach yielded lower mortality, the decline in control was disproportionately less than the reduction in costs for the carbaryl 8-50 and malathion 4-80 treatments. Hence, compared with the standard approach to grasshopper pest management in which high rates of insecticides were applied as a blanket, these RAATs strategies yielded substantially greater savings. Not only were the RAATs methods the only strategies with the possibility for profitable control (i.e., savings exceeding costs in absolute terms), the benefit:cost ratios of the higher RAATs applications were 45 to 133% greater than the standard approach. Carbaryl 8-50 yielded the greatest economic return, with malathion 4-80 and fipronil yielding substantially better returns than the standard applications of carbaryl or malathion. Clearly, the RAATs approach has economic limits, and the lowest rates of carbaryl and malathion (8-33 and 4-50, respectively) yielded lower returns than the standard methods.
DISCUSSION
Mechanisms of RAATs Efficacy
There are 2 plausible mechanisms that may account for the high rates of control in RAATs plots: grasshopper movement and preservation of biological control agents. Due to the relative small sizes of the plots and the lack of detailed information concerning grasshopper movements and survival of native predators and parasites, we do not have definitive data to support either of these factors as playing the essential role. However, there must be some process, other than direct intoxication upon application, that accounts for mortalities exceeding 90% in plots where insecticide is applied to only 50% of the infestation. Circumstantial evidence from our trials suggests that both movement and biological control may be important factors.
Movement.The high efficacy of RAATs strategies likely depends on grasshoppers moving from untreated to treated swaths. Certainly this mechanism is critical to the efficacy of RAATs applications for highly mobile locust hopper bands (Rachadi and Foucart 1996). Available evidence suggests that rangeland grasshoppers likely move 2 to 10 m/day (Riegert et al. 1954, Joern 1983, With 1994, Narisu and Lockwood, unpublished). Unfortunately, little is known concerning developmental or taxonomic differences, and the role of environmental factors is largely uninvestigated. If we assume that grasshoppers move 4 m/day then this behavior would put a substantial proportion of the population into contact with treated swaths when relatively persistent agents are used (i.e., fipronil and carbaryl). The lack of "patchiness" in the 1995 post-treatment surveys suggested that grasshopper dispersal, and hence homogenization of the population, was rapid. However, unless movement is highly directional, and there is no evidence of this, it fails to adequately account for the mortalities of >90% in RAATs plots treated with a short-lived insecticide such as malathion. Clearly, the role of movement in RAATs programs needs to be investigated in greater detail.
Conservation Biological Control. Order-level analyses of plots treated with blanket applications and RAATs suggest that the frequency of nontarget insects is affected differently depending on the treatment strategy, although we are unable to determine absolute changes in the density of nontargets. Family-level assessments showed greater richness in malathion RAATs plots than conventionally treated plots, but these differences were not persistent. Although nontarget population dynamics on rangeland are notoriously erratic (George et al. 1992, Quinn et al. 1993, Lockwood and Schell 1995), it appears that the RAATs approach provided refugia for at least that portion of the insect community having low rates of movement. Thus, predators and parasitoids may have higher survival rates following a RAATs program, compared to a traditional, blanket application.
The capability of native biological control agents to suppress or maintain low densities of grasshoppers (Joern and Gaines 1990) may account for the observation that grasshopper populations in RAATs plots were unable to reestablish high densities in the year following treatment. Indeed, it may even be preferable to allow a low density of grasshoppers to persist following treatment, as in the RAATs plots, in order to sustain a resource base for acridophagous organisms. Moderate densities of grasshoppers provide an adequate resource base for sustaining, but not saturating, native biological control agents. Given that suppression of natural biological control agents through large-scale, blanketing applications of broad-spectrum insecticides for grasshopper control appears to increase the severity of subsequent outbreaks (Lockwood et al. 1988), the RAATs approach may also generate long-term, large-scale benefits with regard to pest management.
Biological control in RAATs plots may also be a component of a broader and more poorly understood ecological phenomenon -- fragmentation (Skaf et al. 1990, Samways 1994, Primack 1995, Caughley 1996). The processes by which spatial fragmentation of a population destabilizes the dynamics and results in collapse are not fully understood, but exposure to predation may play a role. While instability due to fragmentation is basic to conservation biology (Primack 1995, Caughley 1996), the idea of using this phenomenon in pest management has been largely overlooked. It should also be noted that metapopulation models suggest fragmentation may be a source of stability, under some circumstances. Clearly, further work on the role of fragmentation and conservation biological control as mechanisms accounting for the efficacy of the RAATs method is necessary (particularly given our preliminary evidence that grasshopper populations may rapidly homogenize via movement) to ascertain the importance of preserving predators and parasitoids in the untreated swaths.
The final biological control implication of the RAATs method is the preservation of beneficial herbivores in the refugia between treated swaths. Throughout the western rangelands of the US, exotic weeds are a serious problem and biological control programs are the primary means of managing these pests (Bureau of Land Management 1996). Hence, it is possible that a widespread adoption of the RAATs approach will enhance biological control of weeds, relative to blanket treatments for grasshopper control.
Efficacy Assessment
Evidence from our studies indicates that the RAATs approach is a viable means of managing rangeland grasshopper infestations while substantially reducing environmental and economic costs. The fact that lower grasshopper population densities in the RAATs plots persisted into the year following treatment suggests that the grasshoppers that survive these applications are not sufficient to reestablish outbreak conditions. We now know that the acceptable levels of control can be achieved with RAATs across a range of grasshopper densities (4 to 40 grasshoppers/m2) and species, as well as a spectrum of environmental conditions at the time of treatment (0.5 to 4.5 m/sec winds, ambient temperatures 13 to 25oC, and plant canopies from 15 to 65 cm). However, a careful assessment of the mitigating and aggravating factors during our studies is necessary to provide an accurate context and set of constraints for extrapolation of these results to other conditions.
Mitigating Factors - Weather. The weather during the summer of 1995 was atypical, with conditions being much cooler and wetter than normal in June and July (Martner 1986). These conditions delayed development such that it was possible to time our treatment during the ideal (from a management perspective) developmental stage of grasshoppers in early July -- a time which normally would be well past the optimal target stage (DeBrey et al. 1993). The weather during the spring and summer of 1996 was rather typical, with conditions being somewhat cooler than normal in early June.
The conditions during treatment were nearly optimal. In 1995 an east wind perpendicular to the direction of the swaths presumably had the effect of "spreading" the insecticide thereby broadening the treated swaths and consequently narrowing the effectively untreated swaths (USAID 1989, Australian Plague Locust Commission 1990). Thus, the levels of control in the RAATs plots may have reflected higher mortalities than would occur under absolutely calm conditions.
Mitigating Factors - Insecticide Properties. In 1995, the grasshopper densities treated in this study were relatively low at the time of treatment (particularly at the Canal site), compared to those that might be treated during typical outbreaks. However, the fact that grasshopper densities increased to 28 per m2 in the untreated plot at the 66-Mountain site by the end of the study, while remaining at <4 per m2 in the treated plots, suggests that the RAATs method used early in grasshopper development (even during hatching) with a relatively persistent insecticide may be an effective means of preventing the development of an outbreak.
Our 1996 treatments at the Hubbs and Rutherford sites were timed relatively early in development (peak I-II instar), at a time prior to the traditional window of opportunity (peak III-IV instar; DeBrey et al. 1993). However, our "early" timing was not entirely unusual, as we found significant densities of some pest species in the 3rd and 4th instars (e.g., P. quadrimaculatum, A. deorum, and T. kiowa at the Rutherford site), which may well have triggered action under normal conditions. The treatment of the Pollet site was later than optimal, but a large portion of the population was still in the III-IV instar (40%). Given the predominant developmental stages, the extended residual effects of fipronil and carbaryl were probably beneficial in terms of sustaining mortality.
Mitigating Factors - Vegetation. Normal to dry conditions during the summer of 1996 resulted in sparse vegetation and a short plant canopy. This vegetation likely enhanced treatment efficacy in 2 ways. First, sparse and short vegetation allows penetration of the chemical into the canopy. Secondly, the condition of the vegetation likely increased the rate of movement of the grasshoppers. With limited food, the need and ability of grasshoppers to move within the habitat would have been increased. Hence, the dispersal of grasshoppers from the untreated swaths into the treated swaths would have occurred at a higher rate than would be expected with lush plant growth.
Mitigating Factors - Scale. It should be noted that our studies were conducted at small spatial scales (16 to 78 ha plots). At larger scales and with wider untreated intervals between swaths, grasshopper dispersal and population dynamics may be qualitatively different. For example, the 8-50 method applied by a plane capable of 65 m swaths could alter the outcome of the reduced area strategy if the untreated intervals were too large for a preponderance of the grasshoppers to move into the treated areas. However, the findings with fipronil (which had 90 m untreated swaths) suggest that the intervals can be very wide while maintaining adequate control, if the appropriate insecticide is used. Finally, at larger scales, treatment programs extend further into the day and higher temperatures may be expected to decrease the efficacy of very low volumes of insecticides (DeBrey et al. 1993).
Aggravating Factors - Weather. In 1996, the conditions during treatment were nearly optimal from a traditional perspective (DeBrey et al. 1993) but not in terms of a RAATs program. That is, there was virtually no wind on the mornings of treatment. The occasional, slight breeze which came from the south was parallel to the direction of application, so it would have had no effect of "spreading" the insecticide or broadening the treated swaths. Thus, the levels of control in these plots represent mortalities that are unassisted by drift -- a "worst case" scenario for a RAATs program. However, the calm conditions demonstrated that "wind assisted" programs are not essential to achieving acceptable results with RAATs.
Aggravating Factors - Grasshopper Ecology. In 1995, hatching occurred over a very wide period of time. Indeed, at both sites it appears that hatch occurred after the treatments were applied. In the absence of recruitment, grasshopper densities decrease with natural mortality over time (Onsager 1983). However, at the Canal site, densities in untreated plots remained effectively constant over the course of the study, and at the 66-Mountain site densities in untreated plots more than doubled. Differential hatching between sites may also account for the observation that the effective mortality decreased at the Canal site from 13 to 20 days after treatment, while mortality increased during this time period at the 66-Mountain site. The presence of early instars (and the continuing hatch) would have resulted in an unusually "young" grasshopper population, which would be expected to have relatively lower rates of movement than an "older" populations consisting of late nymphal instars and adults.
The grasshopper densities were high at the time of treatment in 1996. It might be expected that such populations would be difficult to manage. That is, higher levels of mortality are required to reduce populations below an economic threshold when the pest densities are high than when they are moderate (e.g., if the threshold is 8/m2, then only 70% mortality is needed if the infestation is initially 27/m2, but 90% mortality is required if the original density is 80/m2). However, it is possible that movement is increased under these conditions, which would enhance the probability of grasshoppers encountering treated swaths.
Aggravating Factors - Vegetation. The unusually moist conditions in early summer of 1995 resulted in abundant vegetation and a dense, tall plant canopy. This vegetation likely reduced treatment efficacy by intercepting the insecticide, thereby decreasing penetration of the chemical and by reducing movement of the grasshoppers. With plenty of food and a dense canopy, the need and ability of grasshoppers to move within the habitat would have been reduced. Hence, the dispersal of grasshoppers from the untreated swaths into the treated swaths would have occurred at a rate much lower than would be expected under normal conditions.
Economic and Environmental Assessments
The benefits of the RAATs approach are such that less insecticide may well generate greater economic returns. This sort of "win-win" environmental-economic scenario would seem to bode well for the continued development and widespread adoption of the RAATs methods for grasshopper management on western rangelands.
Economic Implications
Economic analyses revealed substantial benefits of the RAATs approach. For example, the carbaryl 8-50 treatment, which had no detectable reduction in efficacy, represented a 57% savings compared to the standard approach, considering only the cost of control. Indeed, several of the RAATs methods yielded benefit:cost ratios >1.0 (which include both the cost of control and the value of the forage preserved) and markedly higher than those of the standard application methods with malathion or carbaryl. Thus, the potential savings of using RAATs strategies may be substantial, and malathion, carbaryl and fipronil could all become valuable tools in this approach. Because of a lack of economic models for grasshopper management on crop and CRP lands the economic consequences of the RAATs approach can not be readily estimated, although evidence suggests that these methods may be effective even in intensive agricultural production systems such as alfalfa (M. McLead, pers. comm.).
Economic analysis using the CARMA software revealed that the grasshopper infestation at the Hubbs site was sufficient to potentially justify intervention (i.e., losses were expected without treatment). That is, for both carbaryl 8-50 and fipronil the worst economic outcome with treatment was superior to the best economic outcome without treatment. Malathion 4-50 was the only other approach with a chance of generating an absolute profit, although several of the strategies were economically superior to inaction (i.e., losses were diminished).
Clearly the greatest cost efficiency is found with the RAATs strategies, and these treatments may be the only strategies to yield a profit in many cases. If we conservatively assume that RAATs methods generate a 50% cost reduction relative to traditional methods with no marked difference in efficacy, and we then apply these savings to the 1986-88 control program (National Grasshopper Management Board 1995), we can estimate that adoption of the RAATs approach would have saved $38 million (e.g., the traditional 8-100 application of malathion cost $8.03 per protected ha and the carbaryl 8-50 treatment cost $3.48 per protected ha; both treatments yielded >90% control).
Environmental Implications. The preservation of nontarget species which are essential to nutrient cycling, pollination, and wildlife sustenance compounds the direct savings and the indirect economic benefits of protecting parasites and predators. These organisms are vital to suppressing grasshopper populations and beneficial herbivores which are critical to biological control of rangeland weeds. The reduction in total insecticide loading on the environment through the adoption of the RAATs method in the western US would be substantial. Had this approach been used for the 1986-88 outbreak which involved 8 million ha of treated land, the reduction in insecticide use would have been 3,100 to 3,700 metric tons of insecticides (assuming the use of malathion 4-80 and carbaryl 8-50, respectively, and the viability of RAATs applications with larger aircraft than those used in our trials).
Perhaps the greatest risk to the widespread adoption of RAATs methods is the "Danger of Success Paradox" (Loker 1996), in which we risk having more land treated with insecticides than if no such program was developed. However, in comparing the previously subsidized costs of grasshopper control with the costs forecasted with the RAATs approach, it would appear that there will be little economic incentive for dramatically increased frequencies of treatments. Even if the total area protected is unchanged, RAATs allow a 50-80% reduction in insecticide use. As end-users employ recently developed computer decision-support systems (Berry et al. 1994, Hastings et al. 1996) to exclude unprofitable treatments the frequency of blanket applications should decline.
Recommendations
The RAATs approach appears to be a viable means of managing rangeland grasshoppers. Current findings strongly suggest that existing and developing compounds can be effectively employed. Continued work is needed to discover optimal combinations of rates and intervals for different levels of infestation, but given the economic and environmental pressures in the western US, there can be little doubt that the RAATs approach represents an essential tactic in future grasshopper management. With respect to the labeled compounds, significant reductions in the amounts of carbaryl and malathion used to control infestations can be achieved in the immediate future.
Given the evidence that populations of grasshoppers are increasing in the western US (USDA-APHIS 1996), RAATs methods may be the most viable management strategy in most cases for the near future. Although any recommendations must be qualified in the context of available data, it appears that carbaryl 8-50 or malathion 4-80 treatments applied in 30-m swaths are viable options at this time. Extreme population densities (e.g., >40 grasshoppers/m2) may demand the modification of the RAATs method to provide higher rates and smaller untreated areas than the aforementioned. However, with continued study it is possible that even extreme densities may not require standard, large-scale blanket applications. Risk-averse pest managers may wish to "hedge" our results, using perhaps a carbaryl 12-50 or a malathion 6-90 strategy. Using our 1995-96 data, the choice of the most economically justifiable RAATs approach can be identified using CARMA or HOPPER.
It is imperative that we begin to understand the mechanisms through which RAATs effect mortality. The role of grasshopper movement, preservation of beneficial species (predators and parasitoids), and chemical dispersal (via wind and trophic transfer) must form the basis of future refinements in this approach. In addition, many important operational and ecological issues are as yet unresolved. These matters include evaluating the efficacy of RAATs across a range of environmental conditions, habitats, grasshopper species and developmental stages; optimizing the intervals between swaths, the rates of application, and the interaction of these 2 factors for various compounds and conditions; and assessing the actual preservation of nontarget organisms (including native biological control agents of grasshoppers and rangeland weeds) and the long-term benefits of this preservation.
ACKNOWLEDGMENTS
As with any scientific venture, the origin of the concept is difficult to trace. However, there is no question that several extensive discussions with J. Larsen (USDA-APHIS) over a period of years were essential to laying the foundation for the development of this project as economic conditions made this approach increasingly viable. We should also recognize the valuable insights of D. Hunter (Australian Plague Locust Commission) and T. Rachadi and J.F. Duranton (CIRAD-PRIFAS) in further refining the application of this concept to US rangelands. In addition, we wish to thank S. Brill (Goshen County Weed and Pest District), R. Shoemaker (Platte County Weed and Pest District), J. Larsen and T. McNary (USDA-APHIS), and B. Harrop, Narisu, R. Rockwell, and K. VanDyke (University of Wyoming) for invaluable assistance in the field. Funds for this project were provided by Platte and Goshen County Weed and Pest Districts, Rhône-Poulenc, the University of Wyoming Agricultural Experiment Station, and USDA-APHIS.
LITERATURE CITED
Anonymous 1996. Blanket or barrier treatment: a difficult choice, pp. 13-16. In: Surveillance des Acridiens au Sahel, Lettre d'information no 3 due 13 aoüt 1996. CIRAD-GERDAT-PRIFAS, Montpellier, France
Australian Plague Locust Commission 1990. Field Operations Manual. APLC Department of Primary Industries and Energy, Canberra, Australia.
Bailey RG. 1995. Description of the ecoregions of the United States. USDA Forest Service Miscellaneous Publication 1391.
Berry JS, Kemp WP, and Onsager JA. 1994. Hopper: decision support system for rangeland grasshopper management (software and manual), USDA-APHIS, Boise, ID.
Bureau of Land Management. 1982-1986. Land status maps for the states of Colorado, Idaho, Montana, Nevada, North Dakota, South Dakota, Utah, and Wyoming.
Bureau of Land Management. 1996. Partners Against Weeds: An Action Plan for the Bureau of Land Management. US Department of the Interior, Billings, MT.
Caughley G. 1996. Conservation Biology in Theory and Practice. Blackwell, Cambridge, Massachusetts.
Connin RV and Kuitert LC. 1952. Control of the American grasshopper with organic insecticides in Florida. Journal of Economic Entomology 45: 684-687.
Davis RM, Skold MD, Berry JS, and Kemp WP. 1992. The economic threshold for grasshopper control on public rangelands. Journal of Agricultural and Resource Economics 17: 56-65.
DeBrey LD, Brewer MJ, and Lockwood JA. 1993. Rangeland grasshopper management. Wyoming Agricultural Experiment Station Bulletin B-980.
Dorn A, Schneider M, Botens FFW, Holtmann M, and Petzak I. 1997. Field application of the juvenile hormone analogue fenoxycarb against hopper bands of Locusta migratoria capito in Madagascar, pp. 143-150. In: Krall S, Peveling R, and Ba Diallo D (eds.), New strategies in locust control. Birkhäuser, Basel, Switzerland.
George TL, McEwen LC, and Fowler A. 1992. Effects of a carbaryl treatment on nontarget wildlife. Environmental Entomology 21: 1239-1247.
Hastings JD, Branting LK, and Lockwood JA. 1996. A multiple paradigm system for rangeland pest management. Computers and Electronics in Agriculture16: 47-67.
Hewitt GB and Onsager JA. 1983. Control of grasshoppers on rangeland in the United States -- a perspective. Journal of Range Management 36: 202-207.
Hurlbert SH. 1990. Spatial distribution of the montane unicorn. Oikos 58:257-271.
Husnik DF. 1995. Short-term actions for grasshopper/Mormon cricket program delivery. Memo from the Deputy Administrator, USDA-APHIS-PPQ, December 28, 1995.
Jech LE, Foster N, Collett D, Walgenbach DD, Roland TJ, Rodriguez GD, Bohls R, Houston RD, Meeks WK, Queener RL, Jackson CL, Dines JL, Puclik MJ and Scott AK. 1993. Field evaluation of diflubenzuron and carbaryl bran baits against grasshopper (Orthoptera: Acridae) populations in South Dakota. Journal of Economic Entomology 86: 557-565.
Joern, A. 1983. Small-scale displacement of grasshoppers (Orthoptera: Acrididae) within arid grasslands. Journal of the Kansas Entomological Society 56: 131-139.
Joern A and Gaines SB. 1990. Population dynamics and regulation in grasshoppers, pp. 415-482. In: Chapman RF and Joern A (eds.): Biology of Grasshoppers. Wiley, New York.
Krall S, Peveling R and Ba Diallo D (eds). 1997. New strategies in locust control. Birkhäuser, Basel, Switzerland.
Launois M and Rachadi T. 1997. The problem of a replacement for dieldrin, pp. 247 In: Krall S, Peveling R, and Ba Diallo D (eds.), New strategies in locust control. Birkhäuser, Basel, Switzerland.
Legg DE, Lockwood JA and Brewer MJ. 1996. Variability in rangeland grasshopper (Orthoptera: Acrididae) counts when using the standard, visualized sampling method. Journal of Economic Entomology 89: 1143-1150.
Lockwood JA and Schell SP. 1995. Outbreak dynamics of rangeland grasshoppers (Orthoptera: Acrididae) in the western high plans ecoregion: Eruptive, gradient, both or neither? Journal of Orthoptera Research 4: 35-48.
Lockwood JA, Kemp WP and Onsager JA. 1988. Long-term, large-scale effects of insecticidal control on rangeland grasshopper populations. Journal of Economic Entomology 81: 1258-1264.
Loker WM. 1996. Cowboys, Indians, and deforestation: ethical and environmental issues associated with pastures research in Amazonia. Agriculture and Human Values 13: 52-58.
Lund RE. 1986. MSUSTAT Statistical analysis package. Research and Development Institute, Montana State University, Bozeman, MT.
Martner BR. 1986. Wyoming Climate Atlas. University of Nebraska Press, Lincoln.
Musuna ACZ and Mugisha FN. 1997. Evaluation of insect growth regulators for the control of the African migratory locust, Locusta migratoria migratorioides (R. & F.), in Central Africa, pp. 137-142. In: Krall S, Peveling R, and Ba Diallo D (eds.), New strategies in locust control. Birkhäuser, Basel, Switzerland.
National Grasshopper Management Board, 1995. Proceedings and resolutions of the 1995 meeting of the National Grasshopper Management Board, January 10-12, Rapid City, South Dakota.
Onsager JA. 1983. Relationships between survival rate, density, population trends, and forage destruction by instars of grasshoppers (Orthoptera: Acrididae). Environmental Entomology 12: 1099-1102.
Pfadt RE and Hardy DM. 1987. A historical look at rangeland grasshoppers and the value of grasshopper control programs, pp. 183-195. In: Capinera JL (ed.), Integrated Pest Management on Rangeland: A Shortgrass Prairie Perspective. Westview, Boulder.
Primack RB. 1995. A Primer of Conservation Biology. Sinauer, Sunderland, Massachusetts.
Quinn MA, Kepner RL, Walgenbach DD, Foster RN, Bohls RA, Pooler PD, Reuter KC, and Swain JL. 1993. Grasshopper stages of development as indicators of nontarget arthropod activity: implications for grasshopper management programs on mixed-grass rangeland. Environmental Entomology 22: 532-540.
Rachadi T and Foucart A. 1996. L'efficacité du fipronil en traitement en barrières contre les bandes larvaires du Criquet pèlerin, Schistocerca gregaria (Forskål, 1775) en conditions réelles d'opérations antiacridiennes. CIRAD Document 538, Montpellier, France.
Reigert PW, Fuller RA, and Putman LG. 1954. Studies on dispersal of grasshoppers (Acrididae) tagged with phosphorus-32. Canadian Entomologist 86: 223-232.
Samways MJ. 1994. Insect Conservation Biology. Chapman and Hall, New York.
Scherer R and Célestin H. 1997. Persistence of benzoylphenylureas in the control of the migratory locust Locusta migratoria capito (Sauss.) in Madagascar, pp. 129-136. In: Krall S, Peveling R, and Ba Diallo D (eds.), New strategies in locust control. Birkhäuser, Basel, Switzerland.
Siegel S. 1956. Nonparametric Statistics for the Behavioral Sciences. McGraw-Hill, New York.
Skaf R. Popov GB, and Roffey J. 1990. The Desert Locust: an international challenge. Philosophical Transactions of the Royal Society of London 328:525-538.
Southwood TRE. 1978. Ecological Methods with Particular Reference to the Study of Insect Populations. Chapman and Hall, New York.
Tsyplenkov EP. 1978. Harmful Acridoidea of the USSR. Amerind Publishing, New Delhi, India.
USAID 1989. Locust/Grasshopper Management Operations Guidebook, US Agency for International Development, Washington, DC.
USDA-APHIS. 1989-1994. Grasshopper Integrated Pest Management Program annual reports, US Department of Agriculture, Animal and Plant Health Inspection Service, Boise, Idaho.
USDA-APHIS. 1987. Rangeland Grasshopper Cooperative Management Program Final Environmental Impact Statement. US Department of Agriculture, Animal and Plant Health Inspection Service, Plant Protection and Quarantine, Hyattsville, Maryland.
USDA-APHIS. 1996. National Grasshopper Survey/Forecast Map. USDA-ARS Rangeland Insects Laboratory, Bozeman, MT
USEPA 1996. New Pesticide Fact Sheet - Fipronil. US Environmental Protection Agency, Office of Prevention, Pesticides, and Toxic Substances, Washington, DC.
Wilps H and Diop B. 1997. Field investigations on Schistocerca gregari (Forskål) adults, hoppers and hopper bands , pp. 117-128. In: Krall S, Peveling R, and Ba Diallo D (eds.), New strategies in locust control. Birkhäuser, Basel, Switzerland.
With, KA. 1994. Ontogenetic shifts in how grasshoppers interact with landscape structure: an analysis of movement patterns. Functional Ecology 1. Site descriptions and conditions at time of treatment for 1995-96 RAATs trials in Wyoming.
| Site |
Canal |
66-Mountain |
Rutherford |
Pollet |
| Location |
3 km west of Torrington, WY |
4 km east of Hawk Springs, WY |
5 km west of Guernsey, WY |
13 km west of Guernsey, WY |
| Elevation (m, asl) |
1250 |
1390 |
1330 |
1550 |
| Average Junea | ||||
| total precipitation (mm) |
60 |
63 |
62 |
62 |
| daily temperature (oC) |
19 |
19 |
19 |
19 |
| Treatment Month | ||||
| total precipitation |
85 |
112 |
28 |
28 |
| daily temperature |
17 |
17 |
21 |
21 |
| Vegetation | ||||
| typeb |
mixed grass |
mixed grass |
CRP |
mixed grass |
| plant cover (%) |
25-50 |
25-50 |
90 |
25 |
| canopy height (cm) |
35-40 |
50-65 |
30-150 |
15-20 |
| Infestation | ||||
| size (ha) |
195 |
132 |
120 |
400 |
| density (No./m ) |
6.4 |
12.7 |
53.3 |
31.8 |
| primary speciesc |
A. deorum |
A. deorum |
M. bivittatus |
A. deorum |
| % of assemblage |
57 |
75 |
86 |
72 |
| dominant instar |
II-III |
III-IV |
I-II |
V-adult |
| % of assemblage |
69 |
76 |
56 |
58 |
aData from Martner (1986)
bMixedgrass prairie is part of the Great Plains and Southern Rocky Mountain steppe
(Bailey 1995). Conservation Reserve Program (CRP) lands are former croplands which
are revegetated to conditions more similar to grasslands, with the vegetation consisting
of sweet clover, Melilotus officinalis (canopy height 120-150 cm) with an understory of crested wheatgrass, Agropyron cristatum, and patches of cheatgrass brome, Bromus tectorum (canopy height 30 cm).
cSee Table 2 for complete description of species and stages. The "% of assemblage"
refers to that percent of the grasshoppers represented by the listed species or stages.
Table 2. Grasshopper species and developmental stages (%) present at the time of treatment in the study sites of southeastern Wyoming (USA).
| Species/Instar |
Canal |
66-Mtn. |
Hubbs |
Pollet |
Rutherford |
| Ageneotettix deorum (Scudder) |
16 |
20 |
12 |
19 |
<1 |
| Amphitornus coloradus (Thomas) |
03 |
41 |
00 |
00 |
00 |
| Aulocara elliotti Thomas |
01 |
07 |
00 |
00 |
00 |
| Aulocara femoratum (Scudder) |
13 |
08 |
00 |
00 |
00 |
| Cordillacris crenulata (Bruner) |
05 |
00 |
05 |
02 |
<1 |
| Hadrotettix trifasciatus (Say) |
00 |
00 |
02 |
00 |
00 |
| Melanoplus bivittatus (Say) |
00 |
00 |
00 |
00 |
86 |
| Melanoplus packardii Scudder |
00 |
00 |
00 |
00 |
04 |
| Melanoplus spp.a |
40 |
14 |
40 |
40 |
09 |
| Metator pardalinus (Saussure) |
01 |
03 |
<1 |
00 |
00 |
| Opeia obscura (Thomas) |
11 |
00 |
10 |
13 |
00 |
| Phlibostroma quadrimaculatum (Thomas) |
04 |
02 |
16 |
09 |
00 |
| Phoetaliotes nebrascensis (Thomas) |
00 |
00 |
<1 |
02 |
00 |
| Trachyrhachys kiowa Thomas |
04 |
00 |
06 |
03 |
00 |
| Other species |
02 |
05 |
08 |
12 |
00 |
| Instar I |
18 |
03 |
28 |
01 |
31 |
| Instar II |
35 |
06 |
20 |
03 |
25 |
| Instar III |
22 |
28 |
17 |
14 |
22 |
| Instar IV |
21 |
48 |
29 |
24 |
16 |
| Instar V |
02 |
11 |
06 |
29 |
06 |
| Adults |
02 |
04 |
00 |
29 |
<1 |
aBased on adult surveys, the majority of these nymphs were M. sanguinipes (F.) and M. infantilis Scudder.
Table 3. Mean rangeland grasshopper densities (No./m2) before and after treatments with standard and RAATs methods in southeastern Wyoming (USA) in 1995.
| Treatment | |||||
| Site | Time |
None |
Standard |
Carbaryl |
Reduced-2 |
| Canal | 1 day before |
4.1 A |
7.4 B |
6.7 AB |
7.4 B |
| 3 days after |
3.6 A |
5.8 B |
2.3 A |
7.1 B |
|
| 7 days after |
4.0 B |
0.1 A |
1.1 |
1.3 A |
|
| 13 days after |
5.3 B |
1.2 A |
0.7 |
1.7 A |
|
| 20 days after |
3.4 B |
1.7 A |
1.3 |
1.7 A |
|
| 66-Mtn. | 1 day before |
11.9 A |
10.9 A |
13.2 A |
14.8 A |
| 3 days after |
22.1 B |
4.6 A |
6.1 A |
6.4 A |
|
| 7 days after |
rain |
rain |
rain |
rain |
|
| 13 days after |
16.5 C |
4.8 A |
5.4 AB |
5.8 AB |
|
| 20 days after |
28.1 B |
2.6 A |
2.3 A |
2.0 B |
|
| 377 days after |
36.2 B |
6.1 A |
4.3 A |
5.9 A |
aFor each agent the numbers refer to the amount of product and the percentage of the infestation that was treated (e.g., carbaryl 8-50 refers to 8 oz of formulated material applied to 50% of an infestation). Means within a row followed by different letters differ significantly (P<0.05) according to Fishers' protected least significant difference test.
Table 4. Mean grasshopper densities (No./m2) before and after treatments with standard and RAATs methods in southeastern Wyoming (USA) in 1996.
| Treatmenta | |||||||||
| Carbaryl | Malathion | Fipronil | |||||||
| Site | Time |
None |
Standard |
Reduced-2 |
Reduced-3 |
Standard |
Reduced-1 |
Reduced-2 |
(14-25) |
| Hubbs | 1 day before |
18.6 A |
15.7 A |
17.8 A |
17.8 A |
18.1 A |
25.6 B |
21.4 AB |
21.8 AB |
| 1 day after |
24.7 C |
11.7 B |
18.7 C |
17.3 C |
2.2 A |
9.8 B |
13.0 B |
9.1 B |
|
| 4 days after |
25.0 E |
3.6 AB |
11.0 C |
16.2 C |
0.6 A |
7.0 BC |
16.0 D |
6.1 B |
|
| 6 days after |
28.9 E |
0.6 A |
1.6 AB |
9.1 C |
0.9 A |
3.4 ABC |
18.5 D |
8.1 BC |
|
| 13 days after |
27.2 C |
0.6 A |
1.9 A |
16.5 B |
0.2 A |
4.5 A |
21.4 B |
7.8 A |
|
| 25 days after |
25.3 D |
1.4 A |
2.2 A |
12.9 C |
0.0 A |
2.3 A |
12.7 BC |
4.2 AB |
|
| 47 days after |
30.2 D |
4.2 A |
5.5 AB |
9.4 B |
3.5 A |
5.2 AB |
13.2 C |
4.7 AB |
|
| Pollet | 1 day before |
28.3 A |
32.7 AB |
33.3 AB |
29.9 AB |
30.8 AB |
29.2 AB |
38.7 B |
-- |
| 1 day after |
31.4 D |
25.3 C |
16.6 B |
18.2 B |
4.9 A |
5.5 A |
21.8 BC |
-- |
|
| 5 days after |
29.6 B |
10.2 A |
8.4 A |
8.8 A |
7.2 A |
9.6 A |
8.8 A |
-- |
|
| 9 days after |
34.1 C |
3.6 A |
14.3 B |
17.3 B |
5.5 A |
14.8 B |
6.5 A |
-- |
|
| 16 days after |
37.0 D |
9.8 AB |
13.2 AB |
23.9 C |
9.6 A |
15.7 B |
22.1 C |
-- |
|
| Rutherford | 1 day before |
42.4 A |
49.5 A |
61.6 A |
50.0 A |
40.6 A |
58.5 A |
70.8 A |
-- |
| 1 day after |
39.0 D |
10.1 AB |
20.5 BC |
22.8 C |
2.0 A |
5.5 A |
21.8 C |
-- |
|
| 4 days after |
35.4 CD |
21.4 BC |
29.4 CD |
35.8 D |
4.9 A |
6.5 A |
19.2 B |
-- |
|
| 6 days after |
73.4 E |
20.1 B |
41.8 CD |
40.2 CD |
4.8 A |
28.6 BC |
43.9 DE |
-- |
|
| 13 days after |
52.3 C |
37.7 BC |
21.8 AB |
36.8 BC |
12.8 A |
14.6 A |
26.0 AB |
-- |
|
| 25 days after |
49.3 D |
24.0 A |
24.4 A |
38.4 BCD |
27.2 AB |
36.0 BC |
42.0 CD |
-- |
aFor each agent the number refer to the amount of product and the percentage of the infestation that was treated (e.g., carbaryl 8-50 refers to 8 oz of formulated material applied to 50% of an infestation). Means within a row followed by different letters differ significantly (P<0.05) according to Fishers' protected lsd test.
Table 5. Number of nontarget insects captured in 100 sweeps before and after treatments with standard and RAATs methods in southeastern Wyoming (USA) in 1996.
| Time | Treatment |
Rate-Areaa |
Coleoptera |
Diptera |
Hemiptera |
Homoptera |
Otherb |
| 1 day before | control |
2 |
5 |
22 |
15 |
3 |
|
| fipronil |
4 |
0 |
15 |
15 |
1 |
||
| malathion | 8-100 |
5 |
5 |
6 |
22 |
11 |
|
| 4-80 |
9 |
8 |
21 |
39 |
8 |
||
| 4-50 |
3 |
3 |
14 |
45 |
17 |
||
| carbaryl | 16-100 |
3 |
3 |
15 |
18 |
6 |
|
| 8-50 |
19 |
5 |
36 |
39 |
8 |
||
| 8-33 |
6 |
4 |
18 |
30 |
3 |
||
| 1 day after | control |
6 |
3 |
16 |
22 |
13 |
|
| fipronil |
1 |
9 |
2 |
||||
| malathion | 8-100 |
0 |
5 |
0 |
4 |
1 |
|
| 4-80 |
1 |
3 |
1 |
20 |
3 |
||
| 4-50 |
1 |
11 |
8 |
12 |
10 |
||
| carbaryl | 16-100 |
10 |
9 |
10 |
50 |
14 |
|
| 8-50 |
0 |
16 |
1 |
22 |
5 |
||
| 8-33 |
2 |
7 |
5 |
23 |
3 |
||
| 4 days after | control |
3 |
0 |
2 |
11 |
6 |
|
| fipronil |
10 |
0 |
10 |
31 |
28 |
||
| malathion | 8-100 |
21 |
24 |
3 |
8 |
14 |
|
| 4-80 |
1 |
3 |
10 |
37 |
16 |
||
| 4-50 |
0 |
4 |
4 |
28 |
2 |
||
| carbaryl | 16-100 |
5 |
8 |
16 |
13 |
17 |
|
| 8-50 |
6 |
11 |
69 |
80 |
46 |
||
| 8-33 |
5 |
1 |
21 |
18 |
13 |
||
| 6 days after | control |
13 |
4 |
42 |
9 |
11 |
|
| fipronil |
0 |
0 |
4 |
8 |
5 |
||
| malathion | 8-100 |
1 |
8 |
3 |
6 |
5 |
|
| 4-80 |
1 |
6 |
5 |
12 |
2 |
||
| 4-50 |
0 |
0 |
1 |
5 |
2 |
||
| carbaryl | 16-100 |
4 |
9 |
6 |
8 |
6 |
|
| 8-50 |
0 |
1 |
8 |
10 |
3 |
||
| 8-33 |
5 |
1 |
12 |
15 |
3 |
||
| 13 days after | control |
38 |
8 |
39 |
21 |
24 |
|
| fipronil |
6 |
12 |
50 |
8 |
6 |
||
| malathion | 8-100 |
5 |
24 |
7 |
6 |
11 |
|
| 4-80 |
12 |
20 |
15 |
16 |
8 |
||
| 4-50 |
2 |
6 |
1 |
3 |
6 |
||
| carbaryl | 16-100 |
4 |
4 |
71 |
3 |
17 |
|
| 8-50 |
4 |
0 |
5 |
9 |
5 |
||
| 8-33 |
5 |
3 |
15 |
3 |
13 |
||
| 25 days after | control |
1 |
3 |
11 |
5 |
0 |
|
| fipronil |
0 |
3 |
4 |
21 |
7 |
||
| malathion | 8-100 |
3 |
0 |
2 |
8 |
3 |
|
| 4-80 |
1 |
4 |
3 |
15 |
0 |
||
| 4-50 |
1 |
3 |
8 |
16 |
9 |
||
| carbaryl | 16-100 |
5 |
1 |
9 |
8 |
12 |
|
| 8-50 |
4 |
7 |
18 |
36 |
13 |
||
| 8-33 |
3 |
1 |
26 |
18 |
11 |
aRate = oz/ac; Area = % of infestation treated
bOther major Order include Aranea, Hymenoptera, Lepidoptera, and Orthoptera.
Table 6. Economic analyses of control program using standard and RAATs methods at the Hubbs site in southeastern Wyoming (USA) in 1996.
|
Range of Savings ($/ha)a |
|||||
| Treatment |
% mortality |
$/ha protected |
worst-case |
best-case |
Benefit:costb |
| None |
00 |
NA |
-5.51 |
-1.85 |
NA |
| fipronil | |||||
|
14-25 |
79 |
3.26 |
-1.82 |
+1.82 |
2.84 |
| carbaryl | |||||
|
16-100 |
97 |
9.26 |
-7.41 |
-3.75 |
1.60 |
|
8-50 |
93 |
3.48 |
-1.63 |
+2.02 |
3.74 |
|
8-33 |
38 |
2.30 |
-4.50 |
-0.84 |
0.75 |
| malathion | |||||
|
8-100 |
99 |
8.03 |
-6.18 |
-2.52 |
1.99 |
|
4-80 |
88 |
4.82 |
-3.04 |
+0.62 |
2.89 |
|
4-50 |
33 |
3.01 |
-4.84 |
-1.18 |
1.41 |
aBased on CARMA software (Hastings et al. 1996); the range of savings is based on
all major ecological factors leading to high (worst-case) or low (best-case) grasshopper
densities following treatment.
bBased on HOPPER software (Berry et al. 1994).
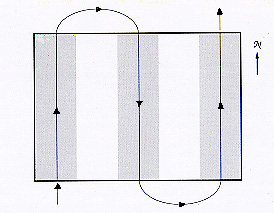
Fig. 1 Schematic (not to scale) representation of the application pattern used in the carbaryl 9-50 treatment, in which 9oz/ac of carbaryl was applied to 50% of a grasshopper infestation in Wyoming. The solid line indicates the flight path of the airplane, and the shaded zones show the idealized area receiving insecticide under absolutely windless conditions.
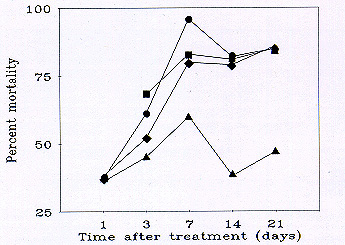
Fig. 2 Mean percent mortality (corrected for changes in the untreated population, see text) of grasshoppers using data pooled from 2 to 4 rangeland sites in southeastern Wyoming treated with carbaryl (Circles: 16 oz/ac applied to 100% of an infestation; Squares: 12 oz/ac applied to 66% of an infestation; Diamonds: 8 oz/ac applied to 50% of an infestation; Triangles: 8 oz/ac applied to 33% of an infestation).
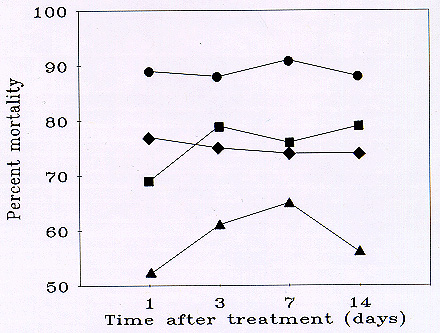
Fig. 3 Mean percent mortality (corrected for changes in the untreated population, see text) of grasshoppers using data pooled from 2 rangeland sites in southeastern Wyoming treated with malathion (Circles: 8 oz/ac applied to 100% of an infestation; Diamonds: 4 oz/ac applied to 80% of an infestation; Triangles: 4 oz/ac applied to 50% of an infestation) and fipronil (1 site; Squares).
The University of Wyoming has earned its Research Level 1 (R1) status from the Carnegie Classification of Institutions of Higher Education, placing Wyoming's only four-year university with the top research universities in the United States.