
The University of Wyoming School of Pharmacy program continually measures student achievement and success.
PharmD Program Graduation Rate
|
Class of |
Entering Class |
Graduated |
Graduated |
|
2010 |
52 |
78% |
17% |
|
2011 |
51 |
84% |
9% |
|
2012 |
50 |
88% |
6% |
|
2013 |
49 |
75% |
12% |
|
2014 |
51 |
75% |
18% |
|
2015 |
50 |
84% |
8% |
|
2016 |
46 |
76% |
11% |
|
2017 |
43 |
87% |
12% |
|
2018 |
48 |
90% |
6% |
|
2019 |
47 |
92% |
8% |
|
2020 |
35 |
91% | 3% |
|
2021 |
58 |
83% | 14% |
|
2022 |
47 |
83% | 8% |
|
2023 |
33 |
81% | 6% |
|
2024 |
23 |
57% | 17% |
|
2025 |
16 |
70% | 17% |
|
2026 |
18 |
86% | 10% |
|
2027 |
25 |
- | - |
|
2028 |
20 |
- | - |
PharmD Program First Time Pass Rates
|
Graduating Class |
NAPLEX results for all first-time takers |
MPJE results for all first-time takers (In-state) |
MPJE results for all first-time takers (Out-of-state) |
|
2010 |
96% |
100% |
- |
|
2011 |
98% |
96% |
- |
|
2012 |
100% |
100% |
- |
|
2013 |
95% |
97% |
- |
|
2014 |
100% |
93% |
- |
|
2015 |
98% |
95% |
- |
|
2016 |
92% |
87% |
- |
|
2017 |
90% |
91% |
- |
|
2018 |
92% |
91% |
- |
|
2019 |
83% |
90% |
- |
|
2020 |
91.7% |
80.0% |
78.1% |
|
2021 |
72.9% |
84.0% |
79.4% |
|
2022 |
77.3% |
87.5% |
87.2% |
|
2023 |
80.6% |
80.0% |
79.0% |
|
2024 |
87.5% |
90.0% |
53.0% |
|
2025 |
89.5% |
42.9% |
92.0% |
The NAPLEX Calendar Year Pass Rate Reports found on the NABP Website
The MPJE Calendar Year Pass Rate Reports found on the NABP Website
PharmD Program Post-graduate Plans
Each year the School of Pharmacy asks graduates about their plans following graduation. Their plans are summarized below:
|
Graduating Class |
|
|
|
2013 |
2014 |
2015 |
2016 |
2017 |
2018 |
2019 |
2020 |
2021 |
2022 |
2023 |
2024 |
2025 |
2026 |
|
Residency |
|
|
|
17% |
21% |
24% |
35% |
23% |
18% |
35% |
19% |
24% |
20% |
25% |
27% |
50% |
- |
|
Community/Retail Pharmacy |
|
|
|
44% |
51% |
44% |
45% |
30% |
42% |
33% |
19% |
58% |
49% |
40% |
45% |
30% |
- |
|
Hospital Pharmacy |
|
|
|
2% |
5% |
16% |
13% |
17% |
18% |
14% |
11% |
4% |
11% |
13% |
5% |
15% |
- |
|
Other |
|
|
|
2% |
5% |
11% |
2% |
10% |
2% |
5% |
11% |
2% |
7% |
9% |
9% |
0% |
- |
|
Unsure or no response |
|
|
|
34% |
19% |
5% |
5% |
20% |
20% |
13% |
40% |
12% |
13% |
13% |
14% |
5% |
- |
Residency Applications
|
Class of |
Graduates placed |
Application |
|
2016 |
14 |
90% |
|
2017 |
9 |
75% |
|
2018 |
18 |
82% |
|
2019 |
15 |
88% |
|
2020 |
7 |
64% |
|
2021 |
13 |
87% |
|
2022 |
10 |
83% |
|
2023 |
8 |
88% |
|
2024 |
7 |
78% |
|
2025 |
10 |
100% |
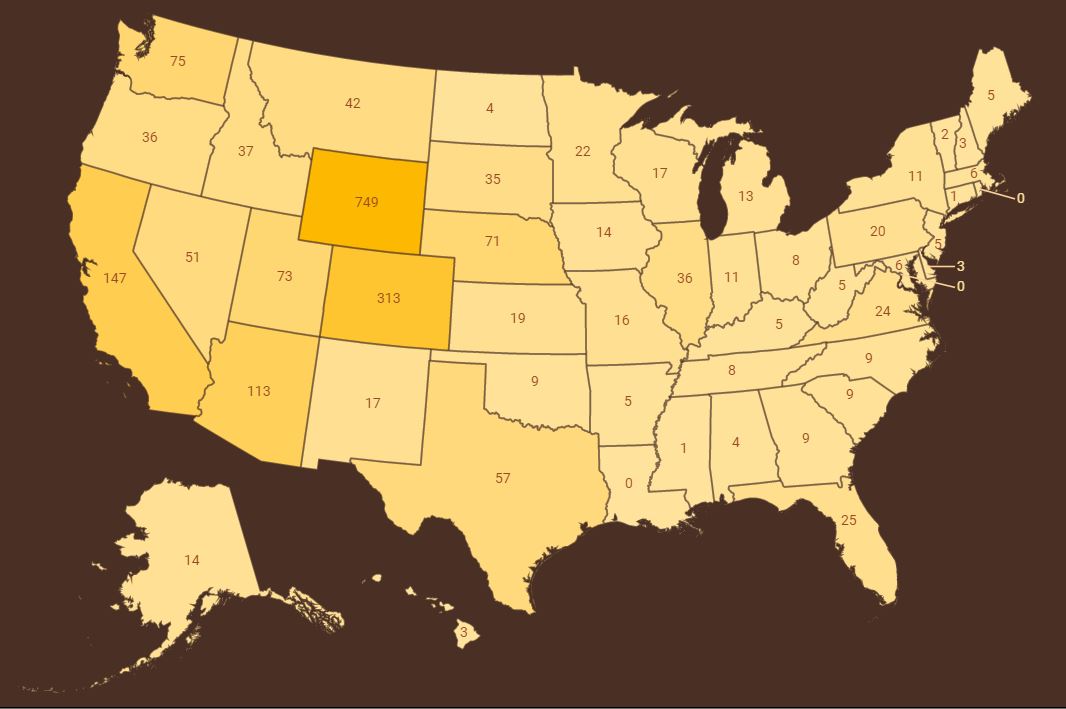
Where are they now?
UW School of Pharmacy alumni can be found across the U.S.
Of the active pharmacists practicing or living in Wyoming, 79% are alumni of the UWSOP.
The University of Wyoming has earned its Research Level 1 (R1) status from the Carnegie Classification of Institutions of Higher Education, placing Wyoming's only four-year university with the top research universities in the United States.