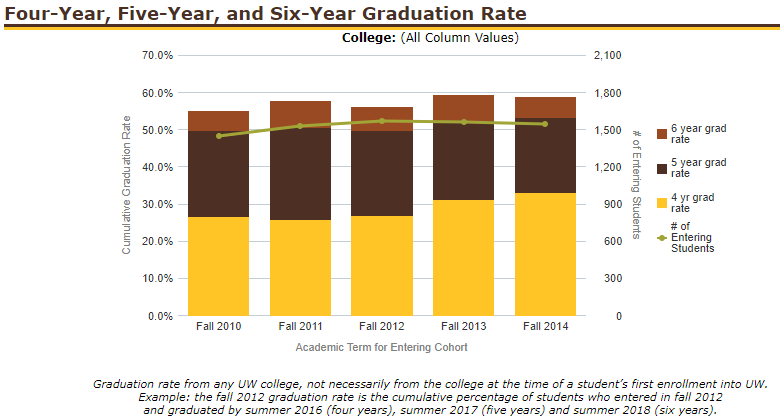
Graduation Rates History
|
Retention and graduation rates are measured from the time a student enters the university. Students are tracked in cohort groups by entrance year for the indicated time period. This information is updated in the spring. - Six-year graduation rates represent students who graduated within 150 percent of
the normal time. |
Brown & Gold Report - Retention/Graduation Rates page interactive reports |
First-Time, Full-Time Students
- Graduation Rates History
- Graduation Rates by Various Characteristics
- Retention Rates by Various Characteristics
- Hathaway Retention and Graduation
- Entering College Retention and Graduation Rates
- Fall-to-Fall Retention Rates (3rd Semester)
- Cohorts 2011, 2012, 2013
- Cohorts 2013, 2014, 2015
- Cohorts 2014, 2015, 2016
- Cohorts 2015, 2016, 2017
- Cohorts 2017, 2018, 2019
- Cohorts 2018, 2019, 2020
- Cohorts 2019, 2020, 2021
- Cohorts 2020, 2021, 2022
- Four, Five, and Six Year Graduation Rates
- Cohorts 2008, 2009, 2010
- Cohorts 2009, 2010, 2011
- Cohorts 2011, 2012, 2013
- Cohorts 2012, 2013, 2014
- Cohorts 2014, 2015, 2016
- Cohorts 2015, 2016, 2017
- Cohorts 2016, 2017, 2018
- Cohorts 2017, 2018, 2019
- Fall-to-Fall Retention Rates (3rd Semester)
Transfer Students
- Full-time Graduation Rates by Various Characteristics
- Full-time Retention Rates by Various Characteristics
- Wyoming Community College Transfer Reports
Six-Year Graduation Rates - Overall and Athletes
Students starting in fall or summer of.
- 2018 -rate as of summer 2024
- 2017 -rate as of summer 2023
- 2016 -rate as of summer 2022
- 2015 -rate as of summer 2021
- 2014 -rate as of summer 2020
- 2013 -rate as of summer 2019
- 2012 -rate as of summer 2018
- 2011 -rate as of summer 2017
- 2010 -rate as of summer 2016
- 2009 -rate as of summer 2015
- 2008 -rate as of summer 2014
- 2007 -rate as of summer 2013
- 2006 -rate as of summer 2012
- 2005 -rate as of summer 2011
- 2004 -rate as of summer 2010
- 2003 -rate as of summer 2009
- 2002 -rate as of summer 2008
- 2001 -rate as of summer 2007
- 2000 -rate as of summer 2006
- 1999 -rate as of summer 2005
- 1998 -rate as of summer 2004
- 1997 -rate as of summer 2003
- 1996 -rate as of summer 2002
Federal Graduation Rates of First-Time, Full-Time Students for Student Right-to-Know
Act
- NCAA Report of Completion and Graduation Rates for All Students and Student-Athletes
Students starting in fall or summer of.
- 2018 -rate as of summer 2024
- 2017 -rate as of summer 2023
- 2016 -rate as of summer 2022
- 2015 -rate as of summer 2021
- 2014 -rate as of summer 2020
- 2013 -rate as of summer 2019
- 2012 -rate as of summer 2018
- 2011 -rate as of summer 2017
- 2010 -rate as of summer 2016
- 2009 -rate as of summer 2015
- 2008 -rate as of summer 2014
- 2007 -rate as of summer 2013
- 2006 -rate as of summer 2012
- 2005 -rate as of summer 2011
- 2004 -rate as of summer 2010
- 2003 -rate as of summer 2009
- 2002 -rate as of summer 2008
NCAA Graduation Success Rate Report
Students starting in fall or summer of.
- 2018 -rate as of summer 2024
- 2017 -rate as of summer 2023
- 2016 -rate as of summer 2022
- 2015 -rate as of summer 2021
- 2014 -rate as of summer 2020
- 2013 -rate as of summer 2019
- 2012 -rate as of summer 2018
- 2011 -rate as of summer 2017
- 2010 -rate as of summer 2016
- 2009 -rate as of summer 2015
- 2008 -rate as of summer 2014
- 2007 -rate as of summer 2013
- 2006 -rate as of summer 2012
- 2005 -rate as of summer 2011
- 2004 -rate as of summer 2010
- 2003 -rate as of summer 2009
- 2002 -rate as of summer 2008
Six-Year Graduation Rates of Pell Grant & Stafford Loan Recipients
Students starting in fall or summer of.
- 2018 -rate as of summer 2024
- 2017 -rate as of summer 2023
- 2016 -rate as of summer 2022
- 2015 -rate as of summer 2021
- 2014 -rate as of summer 2020
- 2013 -rate as of summer 2019
- 2012 -rate as of summer 2018
- 2011 -rate as of summer 2017
- 2010 -rate as of summer 2016
- 2009 -rate as of summer 2015
- 2008 -rate as of summer 2014
- 2007 -rate as of summer 2013
- 2006 -rate as of summer 2012
- 2005 -rate as of summer 2011
If you have any questions or comments about any of this information, please contact Sue Koller at ssavor@uwyo.edu


