
Occupancy Rate (OR)
| Date | Occupancy Rate Forecast | Lower CI Bound | Upper CI Bound |
|---|---|---|---|
| May-2025 | 56.49% | 54.81% | 58.16% |
| Jun-2025 | 81.43% | 79.63% | 83.11% |
| Jul-2025 | 80.28% | 78.21% | 82.19% |
| Aug-2025 | 80.97% | 79.38% | 82.46% |
| Sep-2025 | 84.26% | 82.24% | 86.09% |
| Oct-2025 | 64.07% | 59.73% | 68.20% |
Average Daily Rate (ADR)
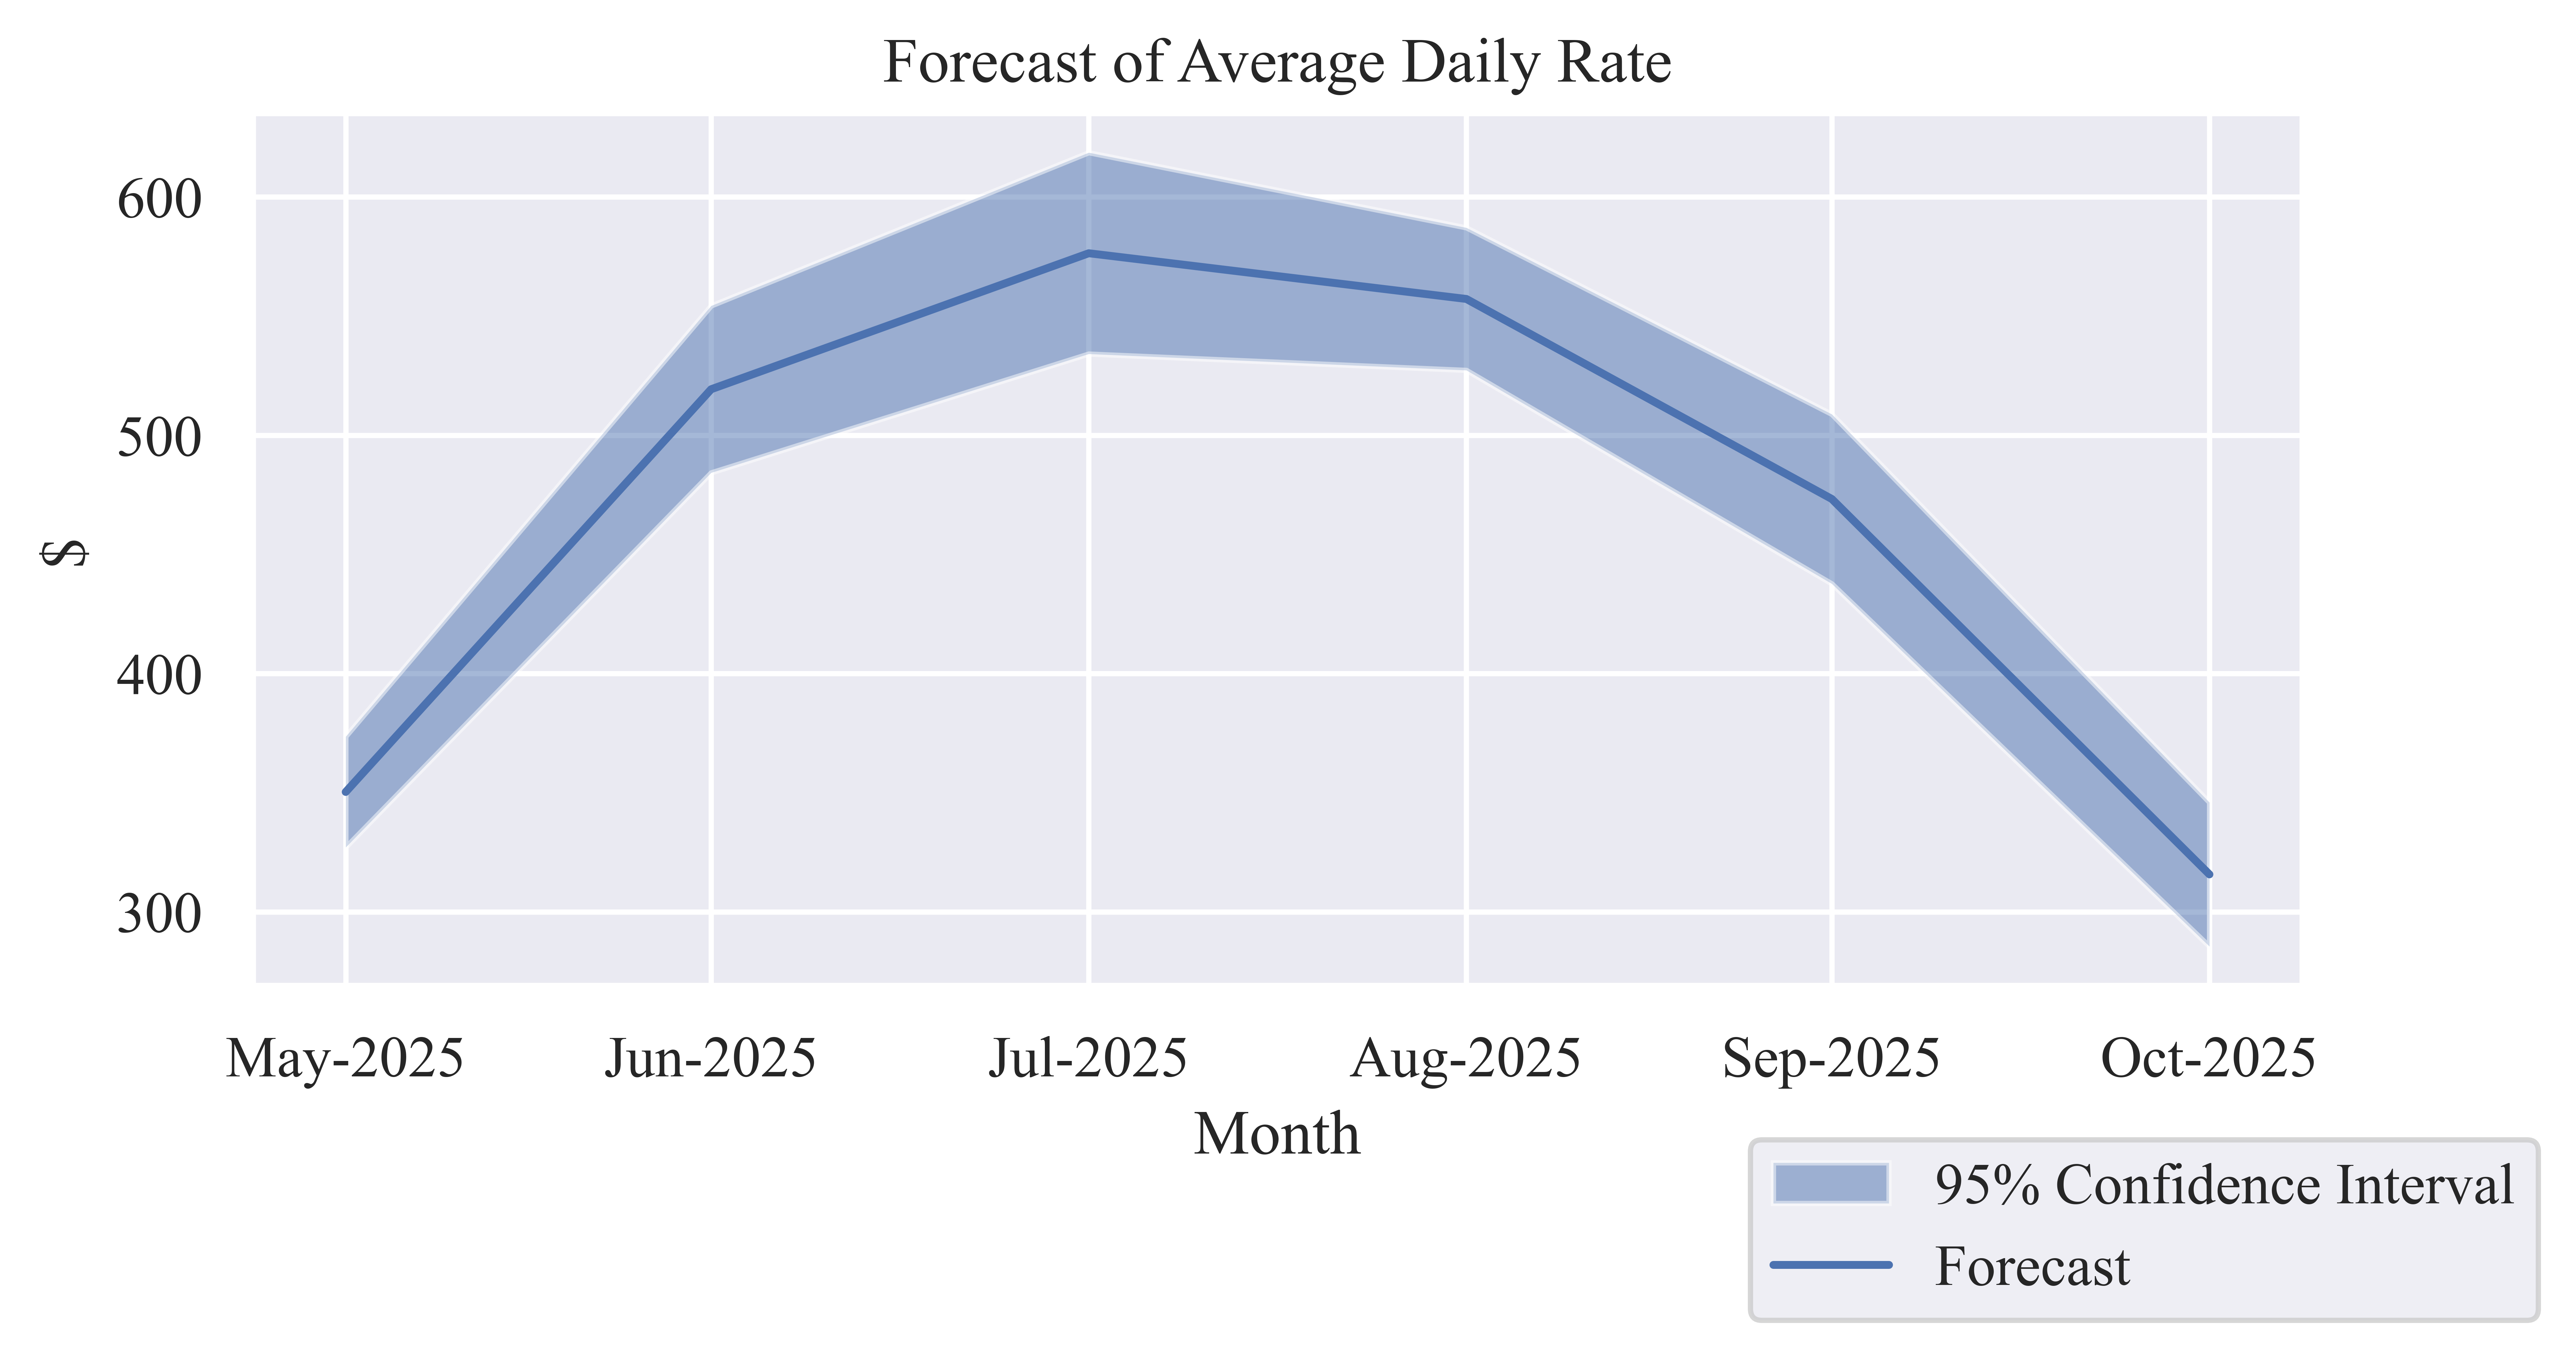
| Date | Average Daily Rate Forecast | Lower CI Bound | Upper CI Bound |
|---|---|---|---|
| May-2025 | $350.32 | $327.09 | $373.56 |
| Jun-2025 | $519.33 | $484.31 | $554.36 |
| Jul-2025 | $576.41 | $534.16 | $618.66 |
| Aug-2025 | $557.22 | $527.31 | $587.13 |
| Sep-2025 | $473.29 | $437.71 | $508.86 |
| Oct-2025 | $315.73 | $285.51 | $345.94 |
Revenue per Available Room (RevPAR)
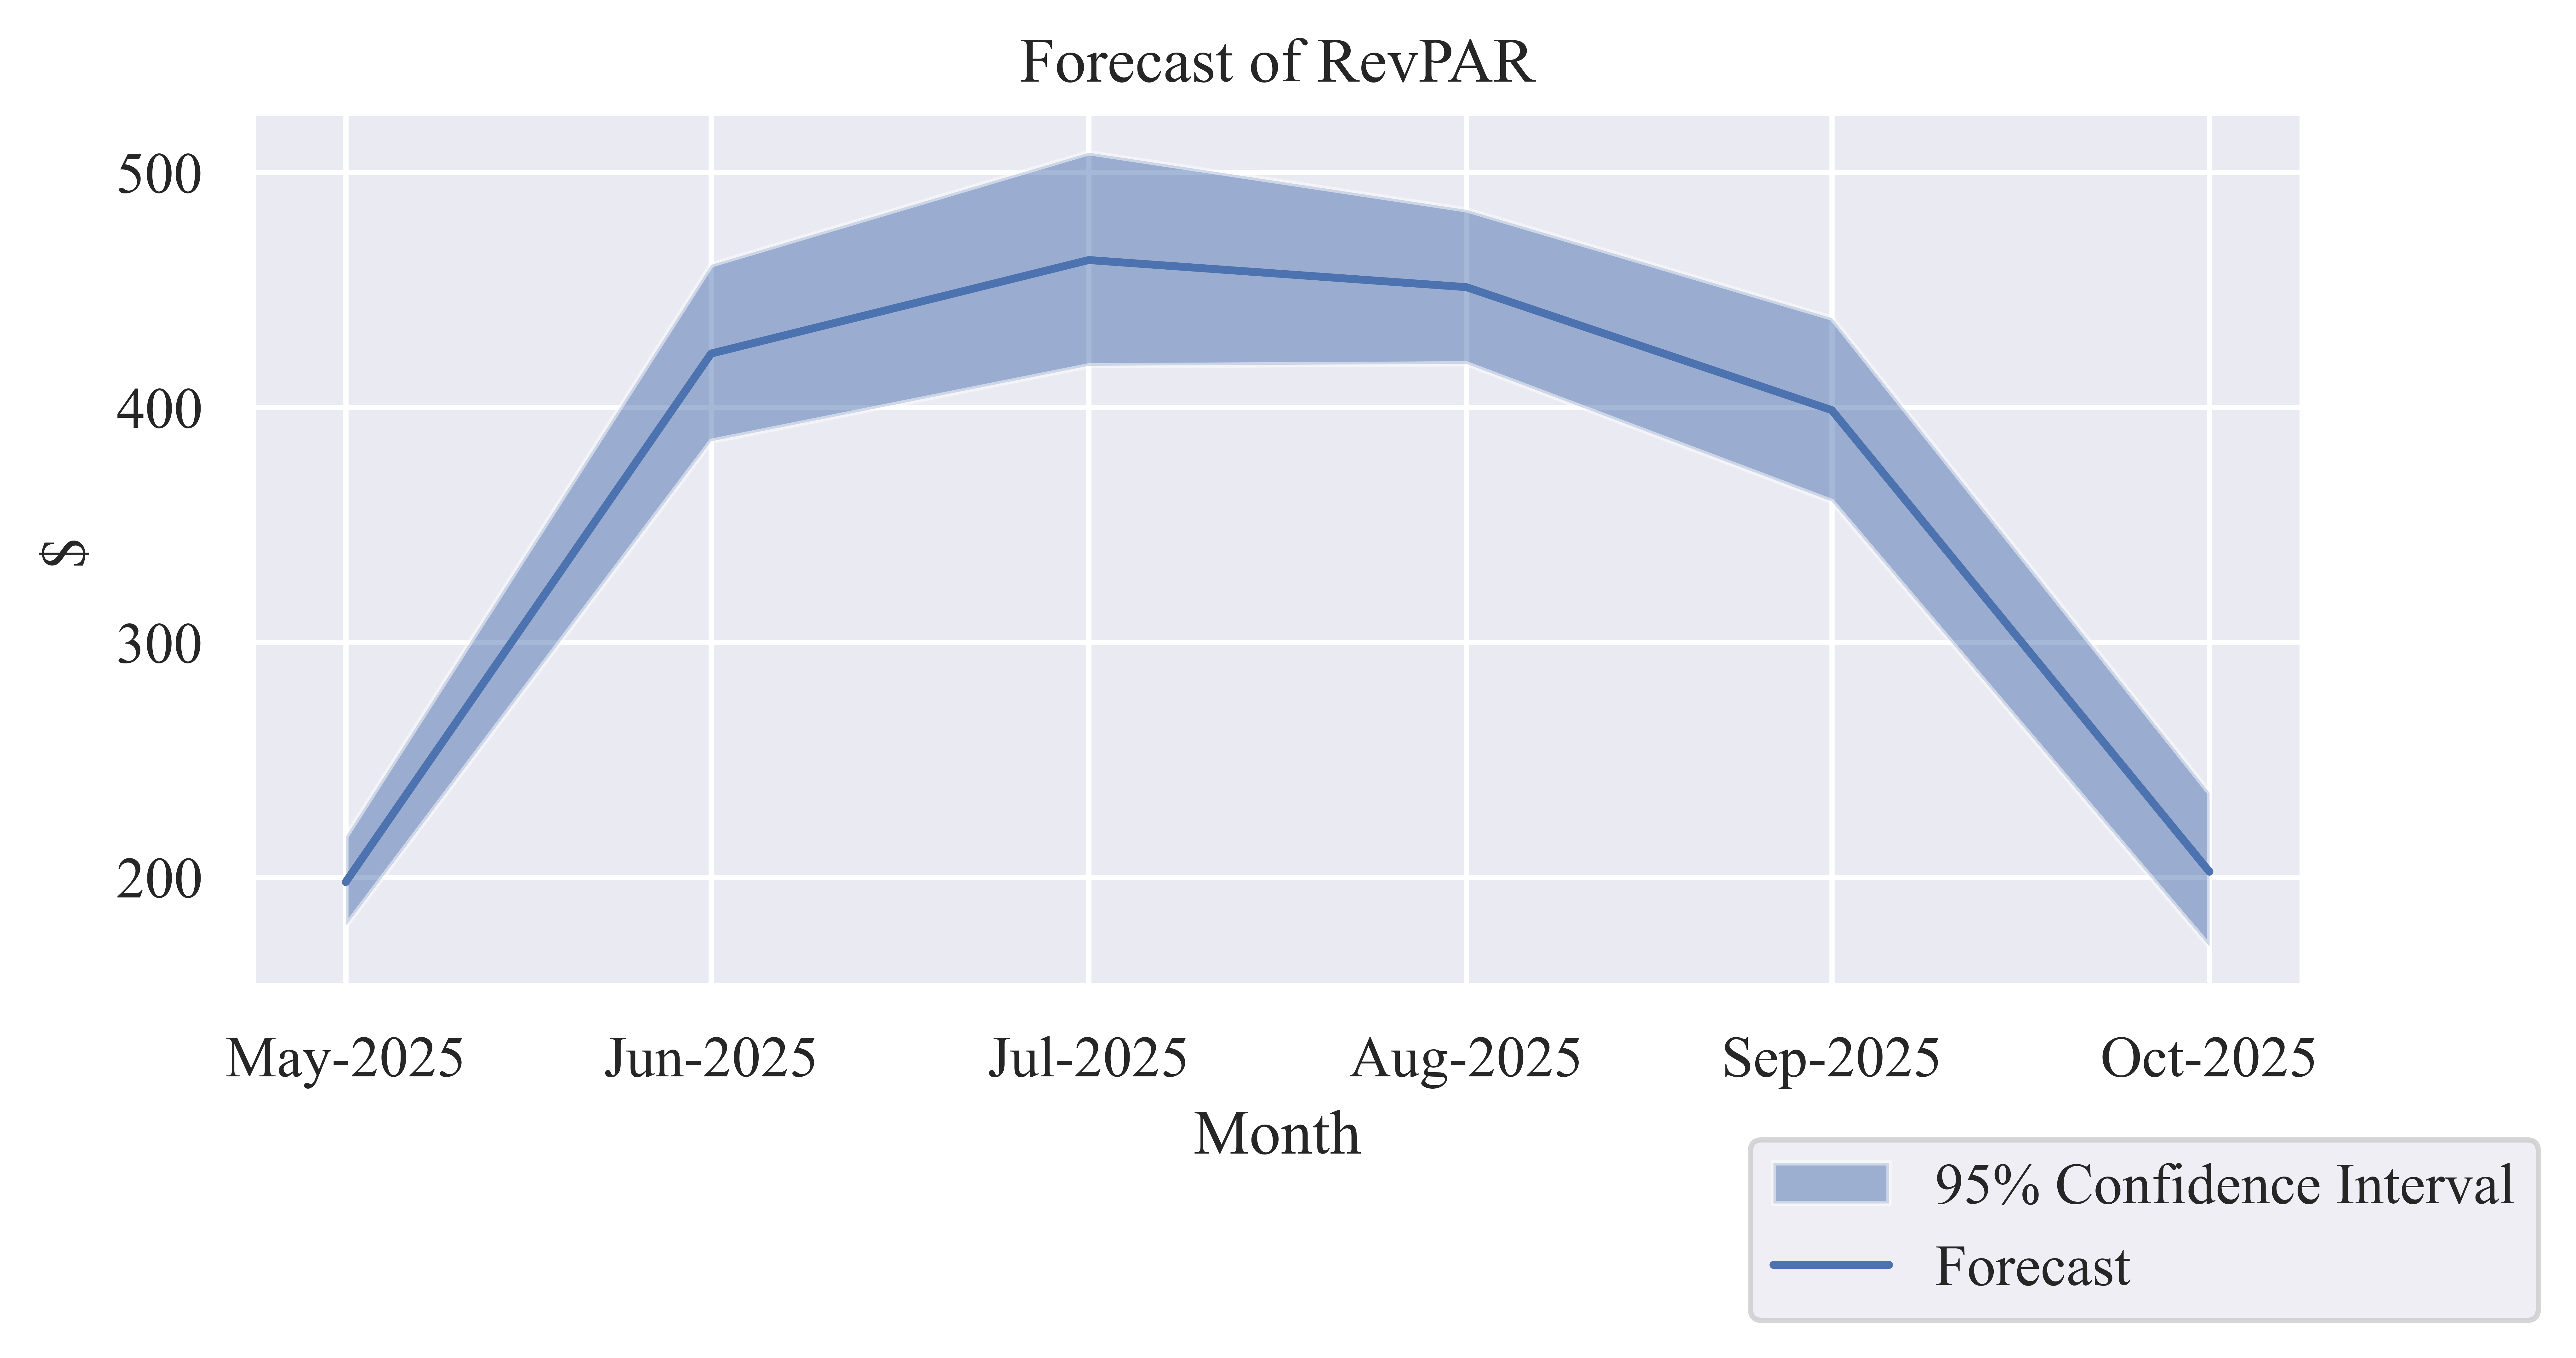
| Date | RevPAR Forecast | Lower CI Bound | Upper CI Bound |
|---|---|---|---|
| May-2025 | $197.90 | $179.27 | $217.27 |
| Jun-2025 | $422.91 | $385.64 | $460.75 |
| Jul-2025 | $462.72 | $417.77 | $508.47 |
| Aug-2025 | $451.18 | $418.60 | $484.15 |
| Sep-2025 | $398.81 | $360.00 | $438.08 |
| Oct-2025 | $202.30 | $170.52 | $235.94 |
Tax Revenues
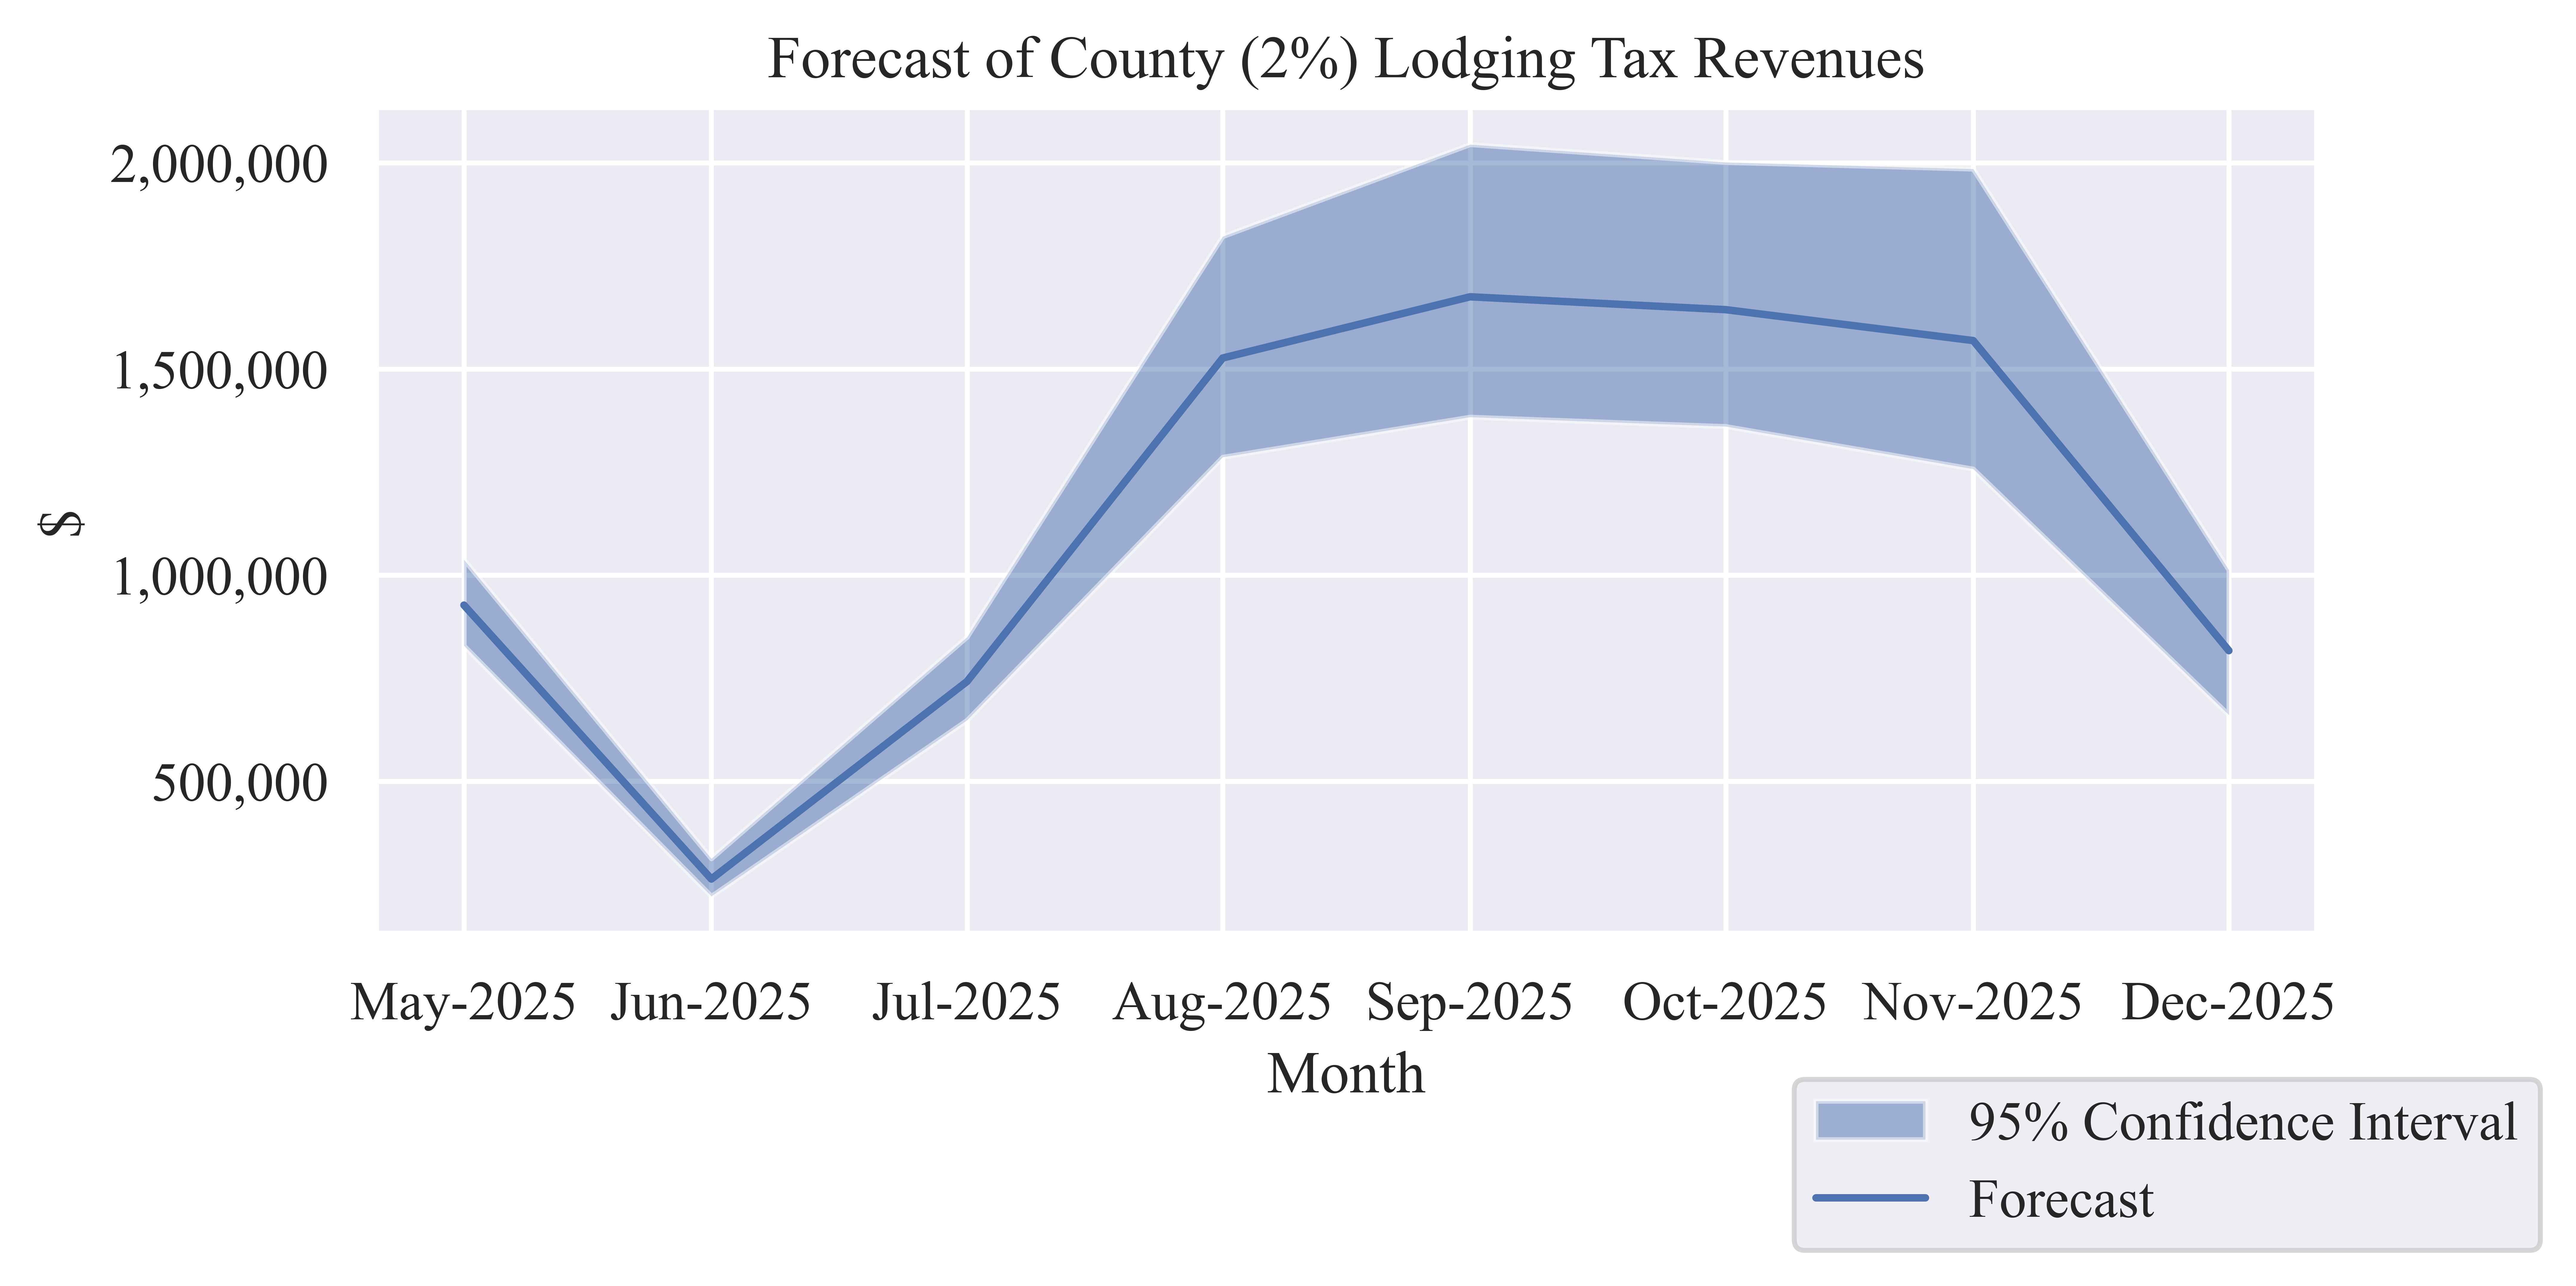
| Date | Tax Revenue Forecast | Lower CI Bound | Upper CI Bound |
|---|---|---|---|
| May-2025 | $927,220 | $828,695 | $1,037,458 |
| Jun-2025 | $262,906 | $221,241 | $312,416 |
| Jul-2025 | $742,074 | $648,030 | $849,741 |
| Aug-2025 | $1,526,429 | $1,286,057 | $1,821,188 |
| Sep-2025 | $1,674,943 | $1,383,252 | $2,044,312 |
| Oct-2025 | $1,643,710 | $1,360,554 | $2,001,176 |
| Nov-2025 | $1,568,739 | $1,257,399 | $1,984,989 |
| Dec-2025 | $816,761 | $660,855 | $1,012,328 |
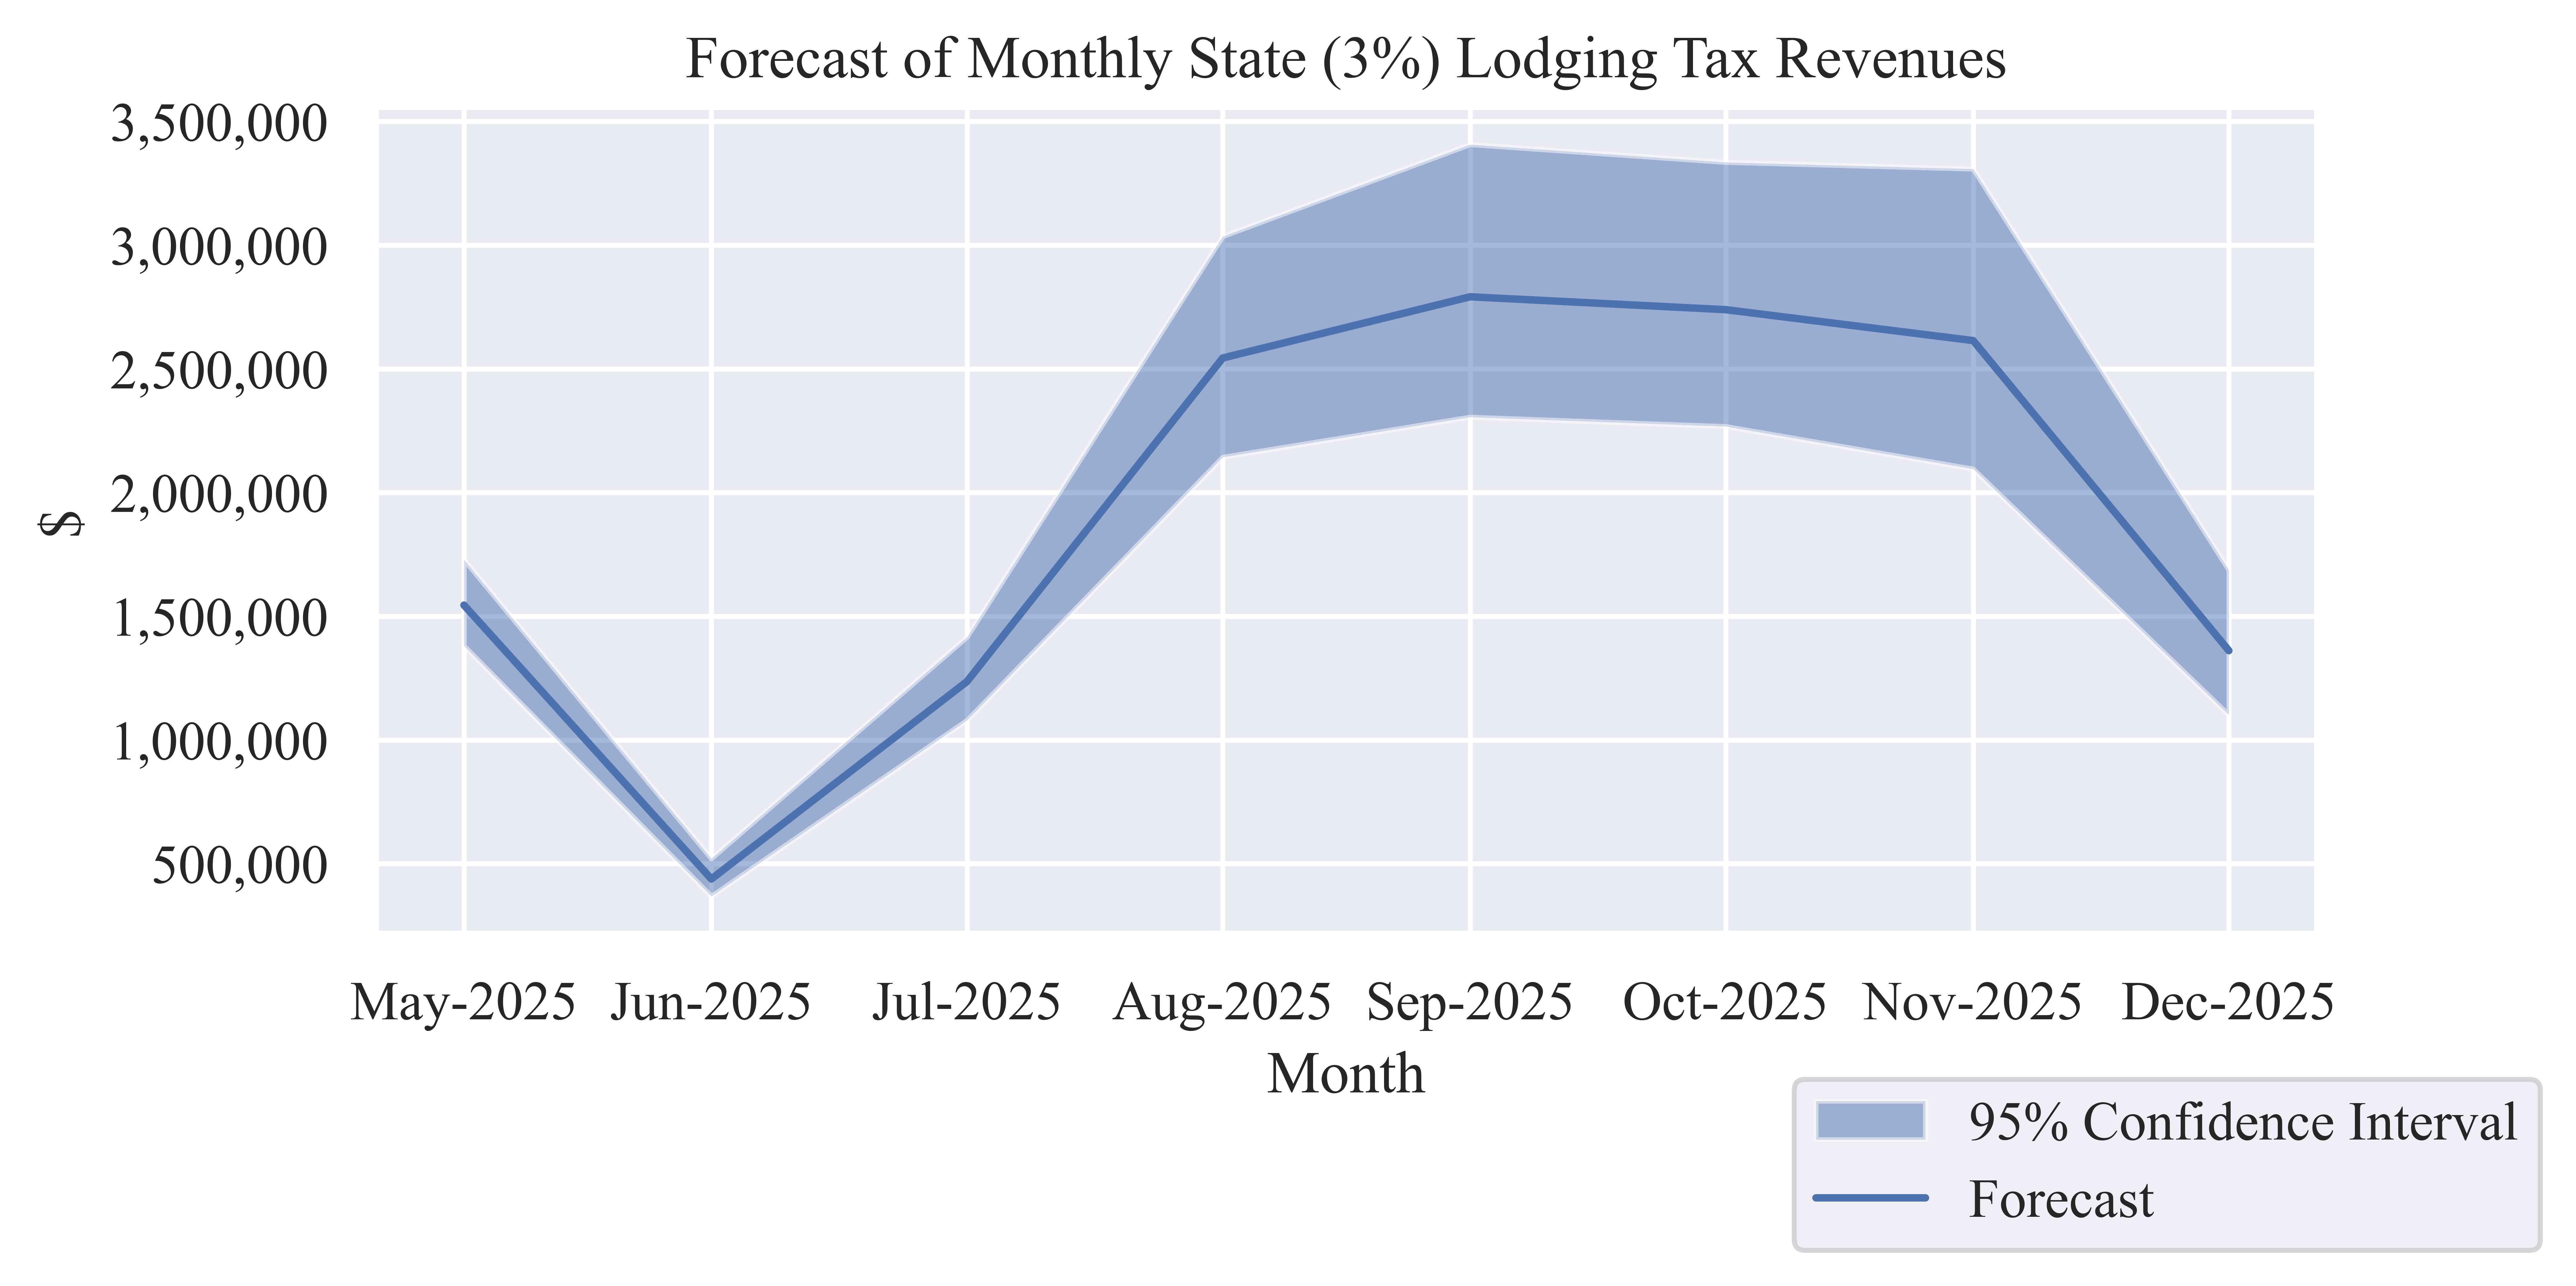
| Date | Tax Revenue Forecast | Lower CI Bound | Upper CI Bound |
|---|---|---|---|
| May-2025 | $1,545,366 | $1,381,159 | $1,729,096 |
| Jun-2025 | $438,176 | $368,736 | $520,694 |
| Jul-2025 | $1,236,790 | $1,080,049 | $1,416,235 |
| Aug-2025 | $2,544,049 | $2,143,428 | $3,035,313 |
| Sep-2025 | $2,791,572 | $2,305,420 | $3,407,187 |
| Oct-2025 | $2,739,517 | $2,267,590 | $3,335,293 |
| Nov-2025 | $2,614,565 | $2,095,665 | $3,308,316 |
| Dec-2025 | $1,361,268 | $1,101,425 | $1,687,213 |
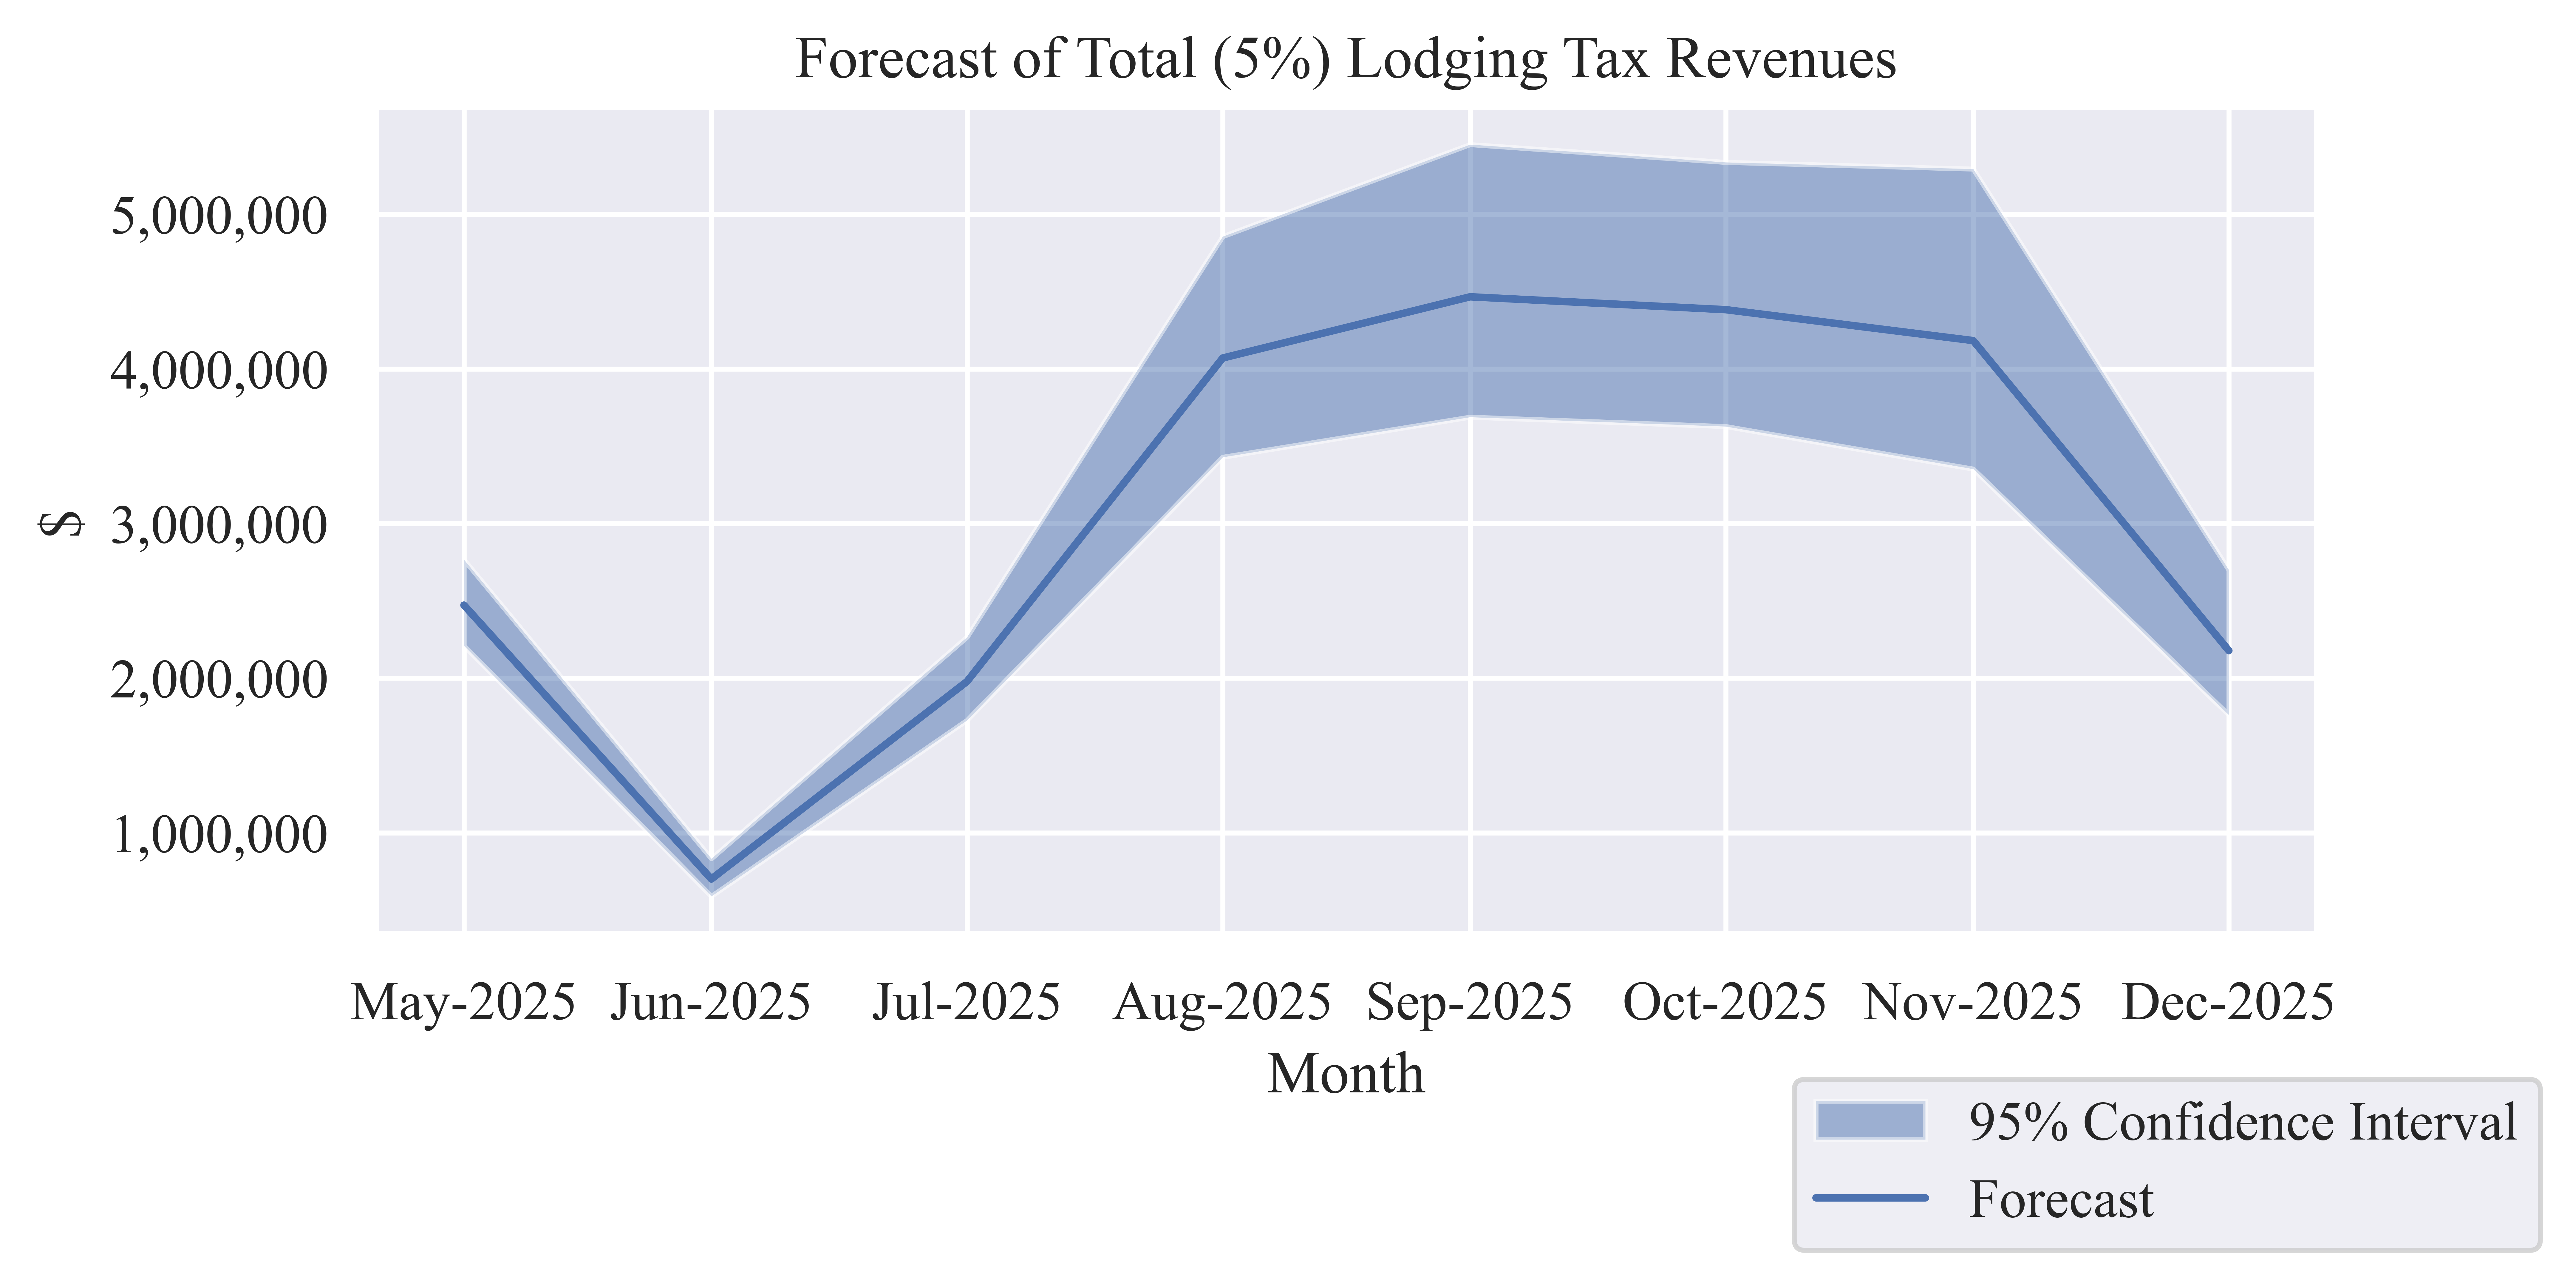
| Date | Tax Revenue Forecast | Lower CI Bound | Upper CI Bound |
|---|---|---|---|
| May-2025 | $2,472,586 | $2,209,854 | $2,766,554 |
| Jun-2025 | $701,082 | $589,977 | $833,110 |
| Jul-2025 | $1,978,864 | $1,728,079 | $2,265,975 |
| Aug-2025 | $4,070,478 | $3,429,485 | $4,856,502 |
| Sep-2025 | $4,466,515 | $3,688,672 | $5,451,499 |
| Oct-2025 | $4,383,227 | $3,628,144 | $5,336,469 |
| Nov-2025 | $4,183,305 | $3,353,064 | $5,293,305 |
| Dec-2025 | $2,178,029 | $1,762,280 | $2,699,541 |
Lodging Sector Sales
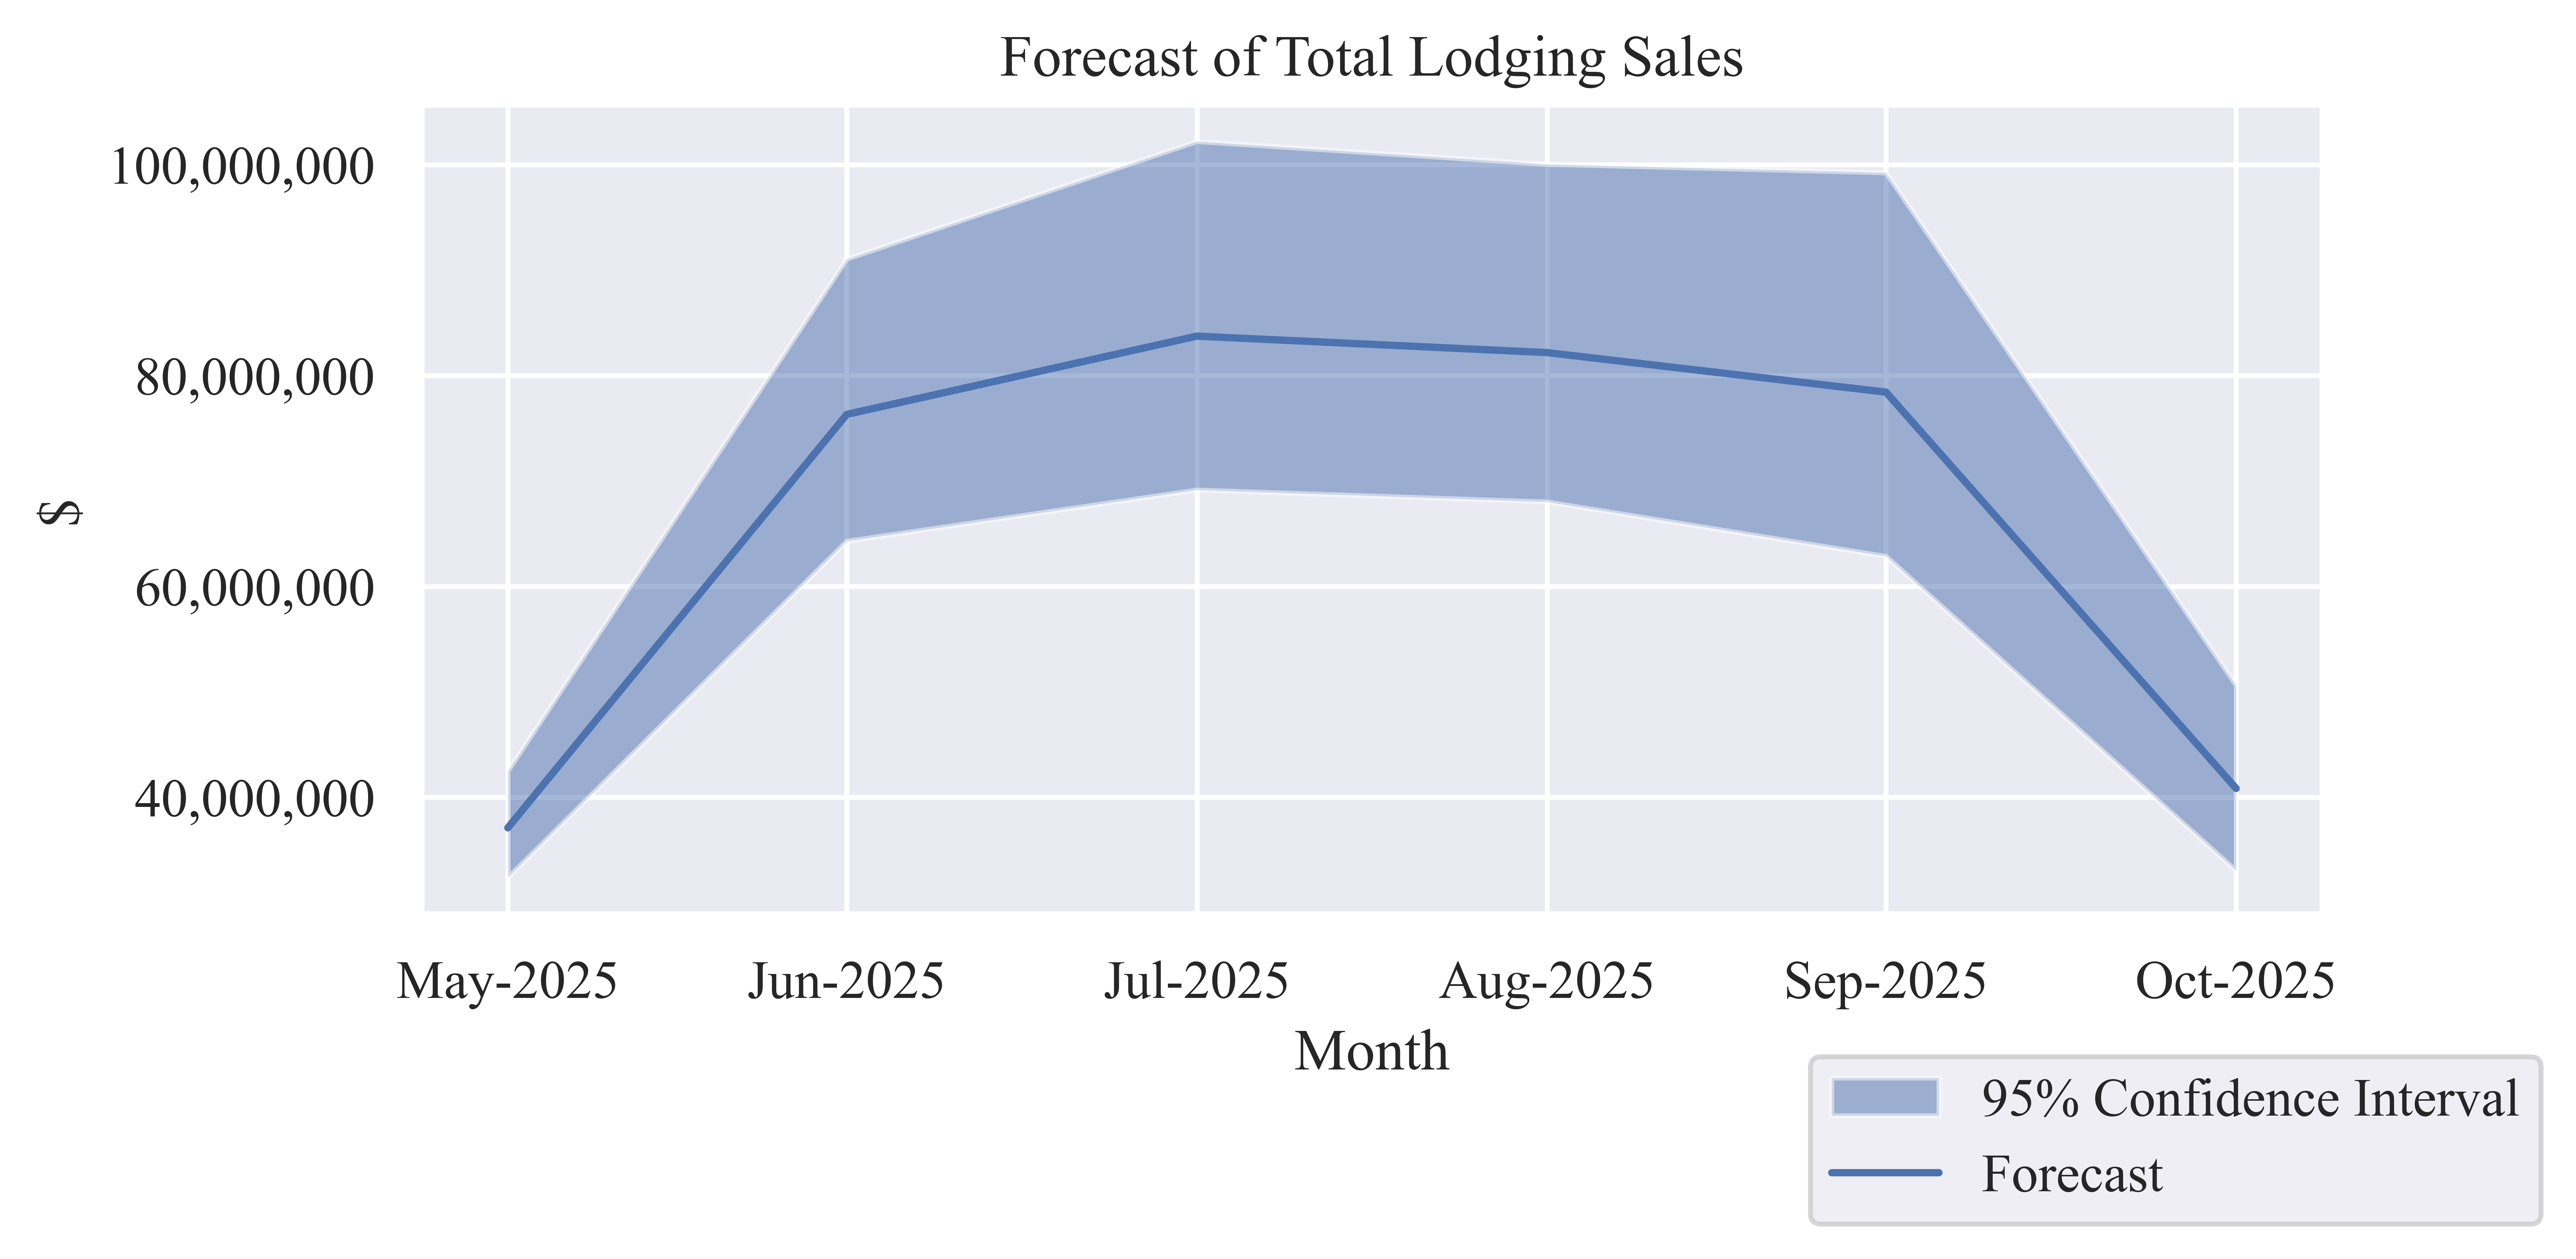
| Date | Lodging Sales Forecast | Lower CI Bound | Upper CI Bound |
|---|---|---|---|
| May-2025 | $37,103,708 | $32,401,476 | $42,487,036 |
| Jun-2025 | $76,321,465 | $64,302,842 | $91,059,403 |
| Jul-2025 | $83,747,161 | $69,162,605 | $102,215,604 |
| Aug-2025 | $82,185,515 | $68,027,702 | $100,058,793 |
| Sep-2025 | $78,436,963 | $62,869,953 | $99,249,466 |
| Oct-2025 | $40,838,041 | $33,042,755 | $50,616,396 |
Economic Indicators
| Estimate | Direct | Indirect | Induced | Total |
|---|---|---|---|---|
| Low Estimate | $322,434,252 | $69,048,422 | $17,491,464 | $408,974,138 |
| Median Estimate | $384,123,887 | $82,259,103 | $20,838,025 | $487,221,015 |
| High Estimate | $461,395,927 | $98,806,707 | $25,029,902 | $585,232,536 |
| Estimate | Direct | Indirect | Induced | Total |
|---|---|---|---|---|
| Low Estimate | $104,286,605 | $23,274,291 | $4,827,835 | $132,388,731 |
| Median Estimate | $124,239,208 | $27,727,241 | $5,751,523 | $157,717,972 |
| High Estimate | $149,231,710 | $33,304,975 | $6,908,527 | $189,445,211 |
| Estimate | Direct | Indirect | Induced | Total |
|---|---|---|---|---|
| Low Estimate | $233,263,577 | $40,596,719 | $10,545,958 | $284,406,255 |
| Median Estimate | $277,892,660 | $48,363,882 | $12,563,668 | $338,820,210 |
| High Estimate | $333,794,761 | $58,092,973 | $15,091,036 | $406,978,771 |
| Estimate | Direct | Indirect | Induced | Total |
|---|---|---|---|---|
| Low Estimate | 4,064 | 653 | 181 | 4,897 |
| Median Estimate | 4,841 | 777 | 215 | 5,834 |
| High Estimate | 5,815 | 934 | 259 | 7,008 |

