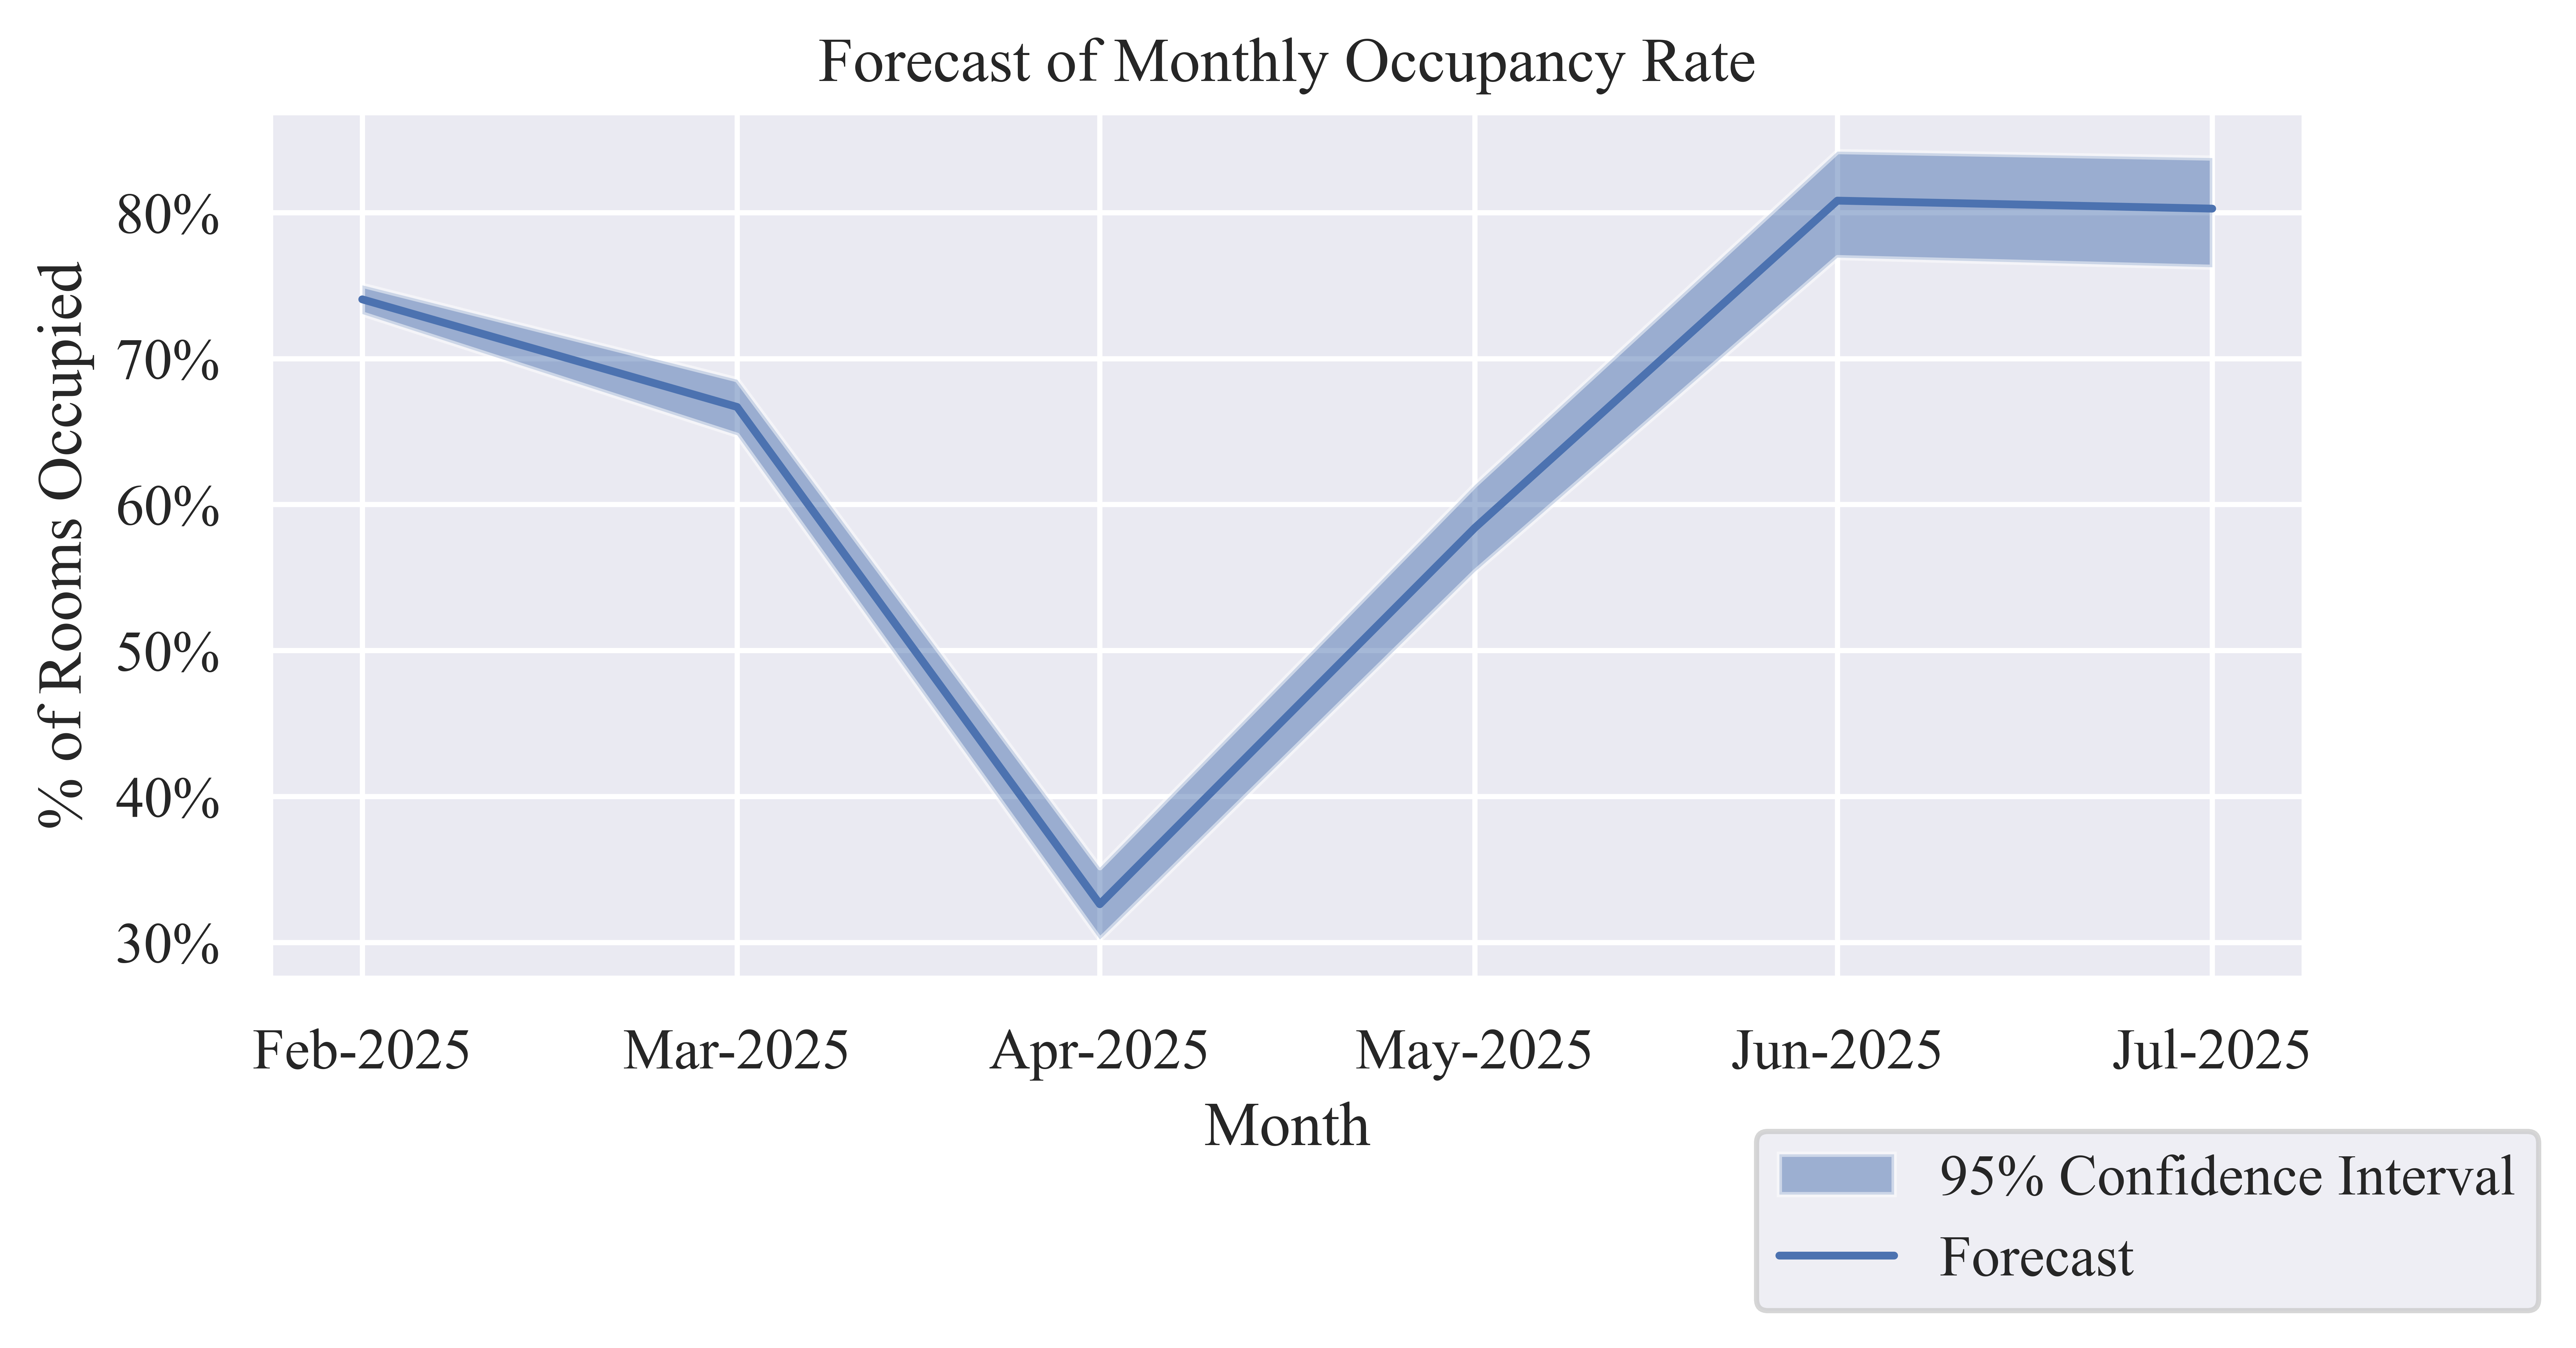
Occupancy Rate (OR)
| Date | Occupancy Rate Forecast | Lower CI Bound | Upper CI Bound |
|---|---|---|---|
| Mar-2025 | 63.82% | 62.84% | 64.79% |
| Apr-2025 | 33.66% | 31.64% | 35.75% |
| May-2025 | 60.82% | 58.67% | 62.93% |
| Jun-2025 | 81.70% | 79.51% | 83.71% |
| Jul-2025 | 80.46% | 77.93% | 82.76% |
| Aug-2025 | 80.81% | 78.28% | 83.10% |
Average Daily Rate (ADR)
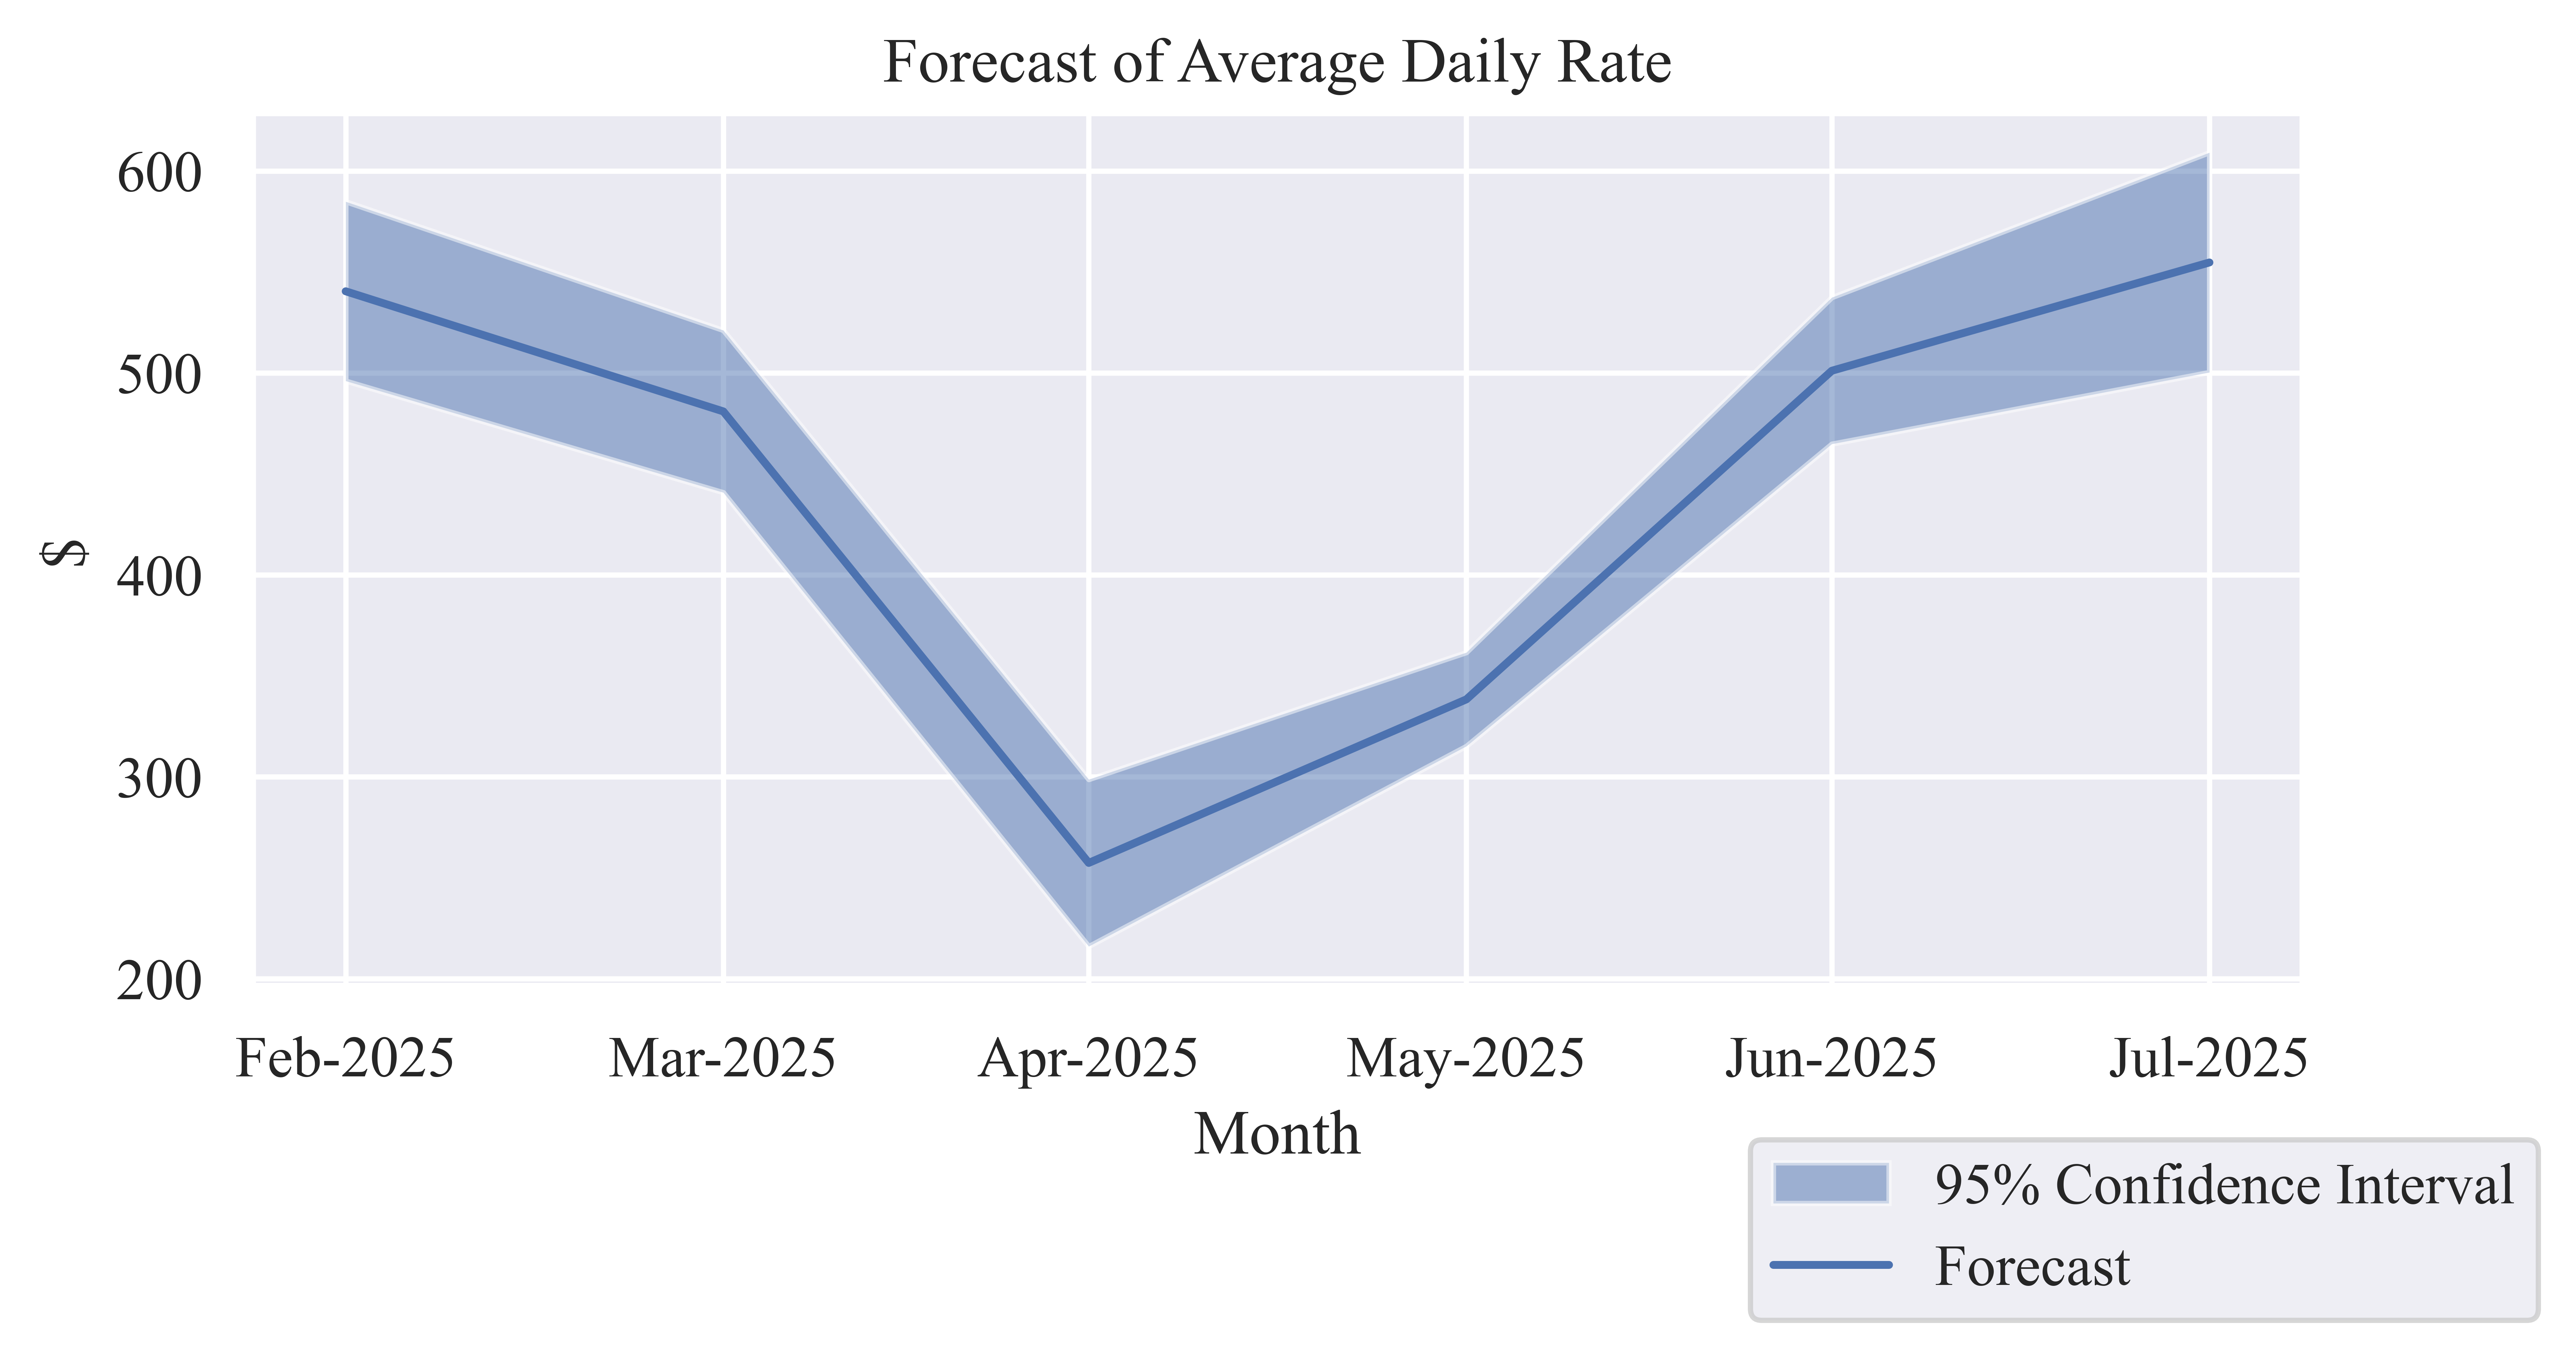
| Date | Average Daily Rate Forecast | Lower CI Bound | Upper CI Bound |
|---|---|---|---|
| Mar-2025 | $481.80 | $449.99 | $513.62 |
| Apr-2025 | $240.39 | $198.49 | $282.28 |
| May-2025 | $348.96 | $315.51 | $382.40 |
| Jun-2025 | $532.95 | $499.56 | $566.34 |
| Jul-2025 | $580.46 | $530.78 | $630.13 |
| Aug-2025 | $523.52 | $478.00 | $569.05 |
Revenue per Available Room (RevPAR)
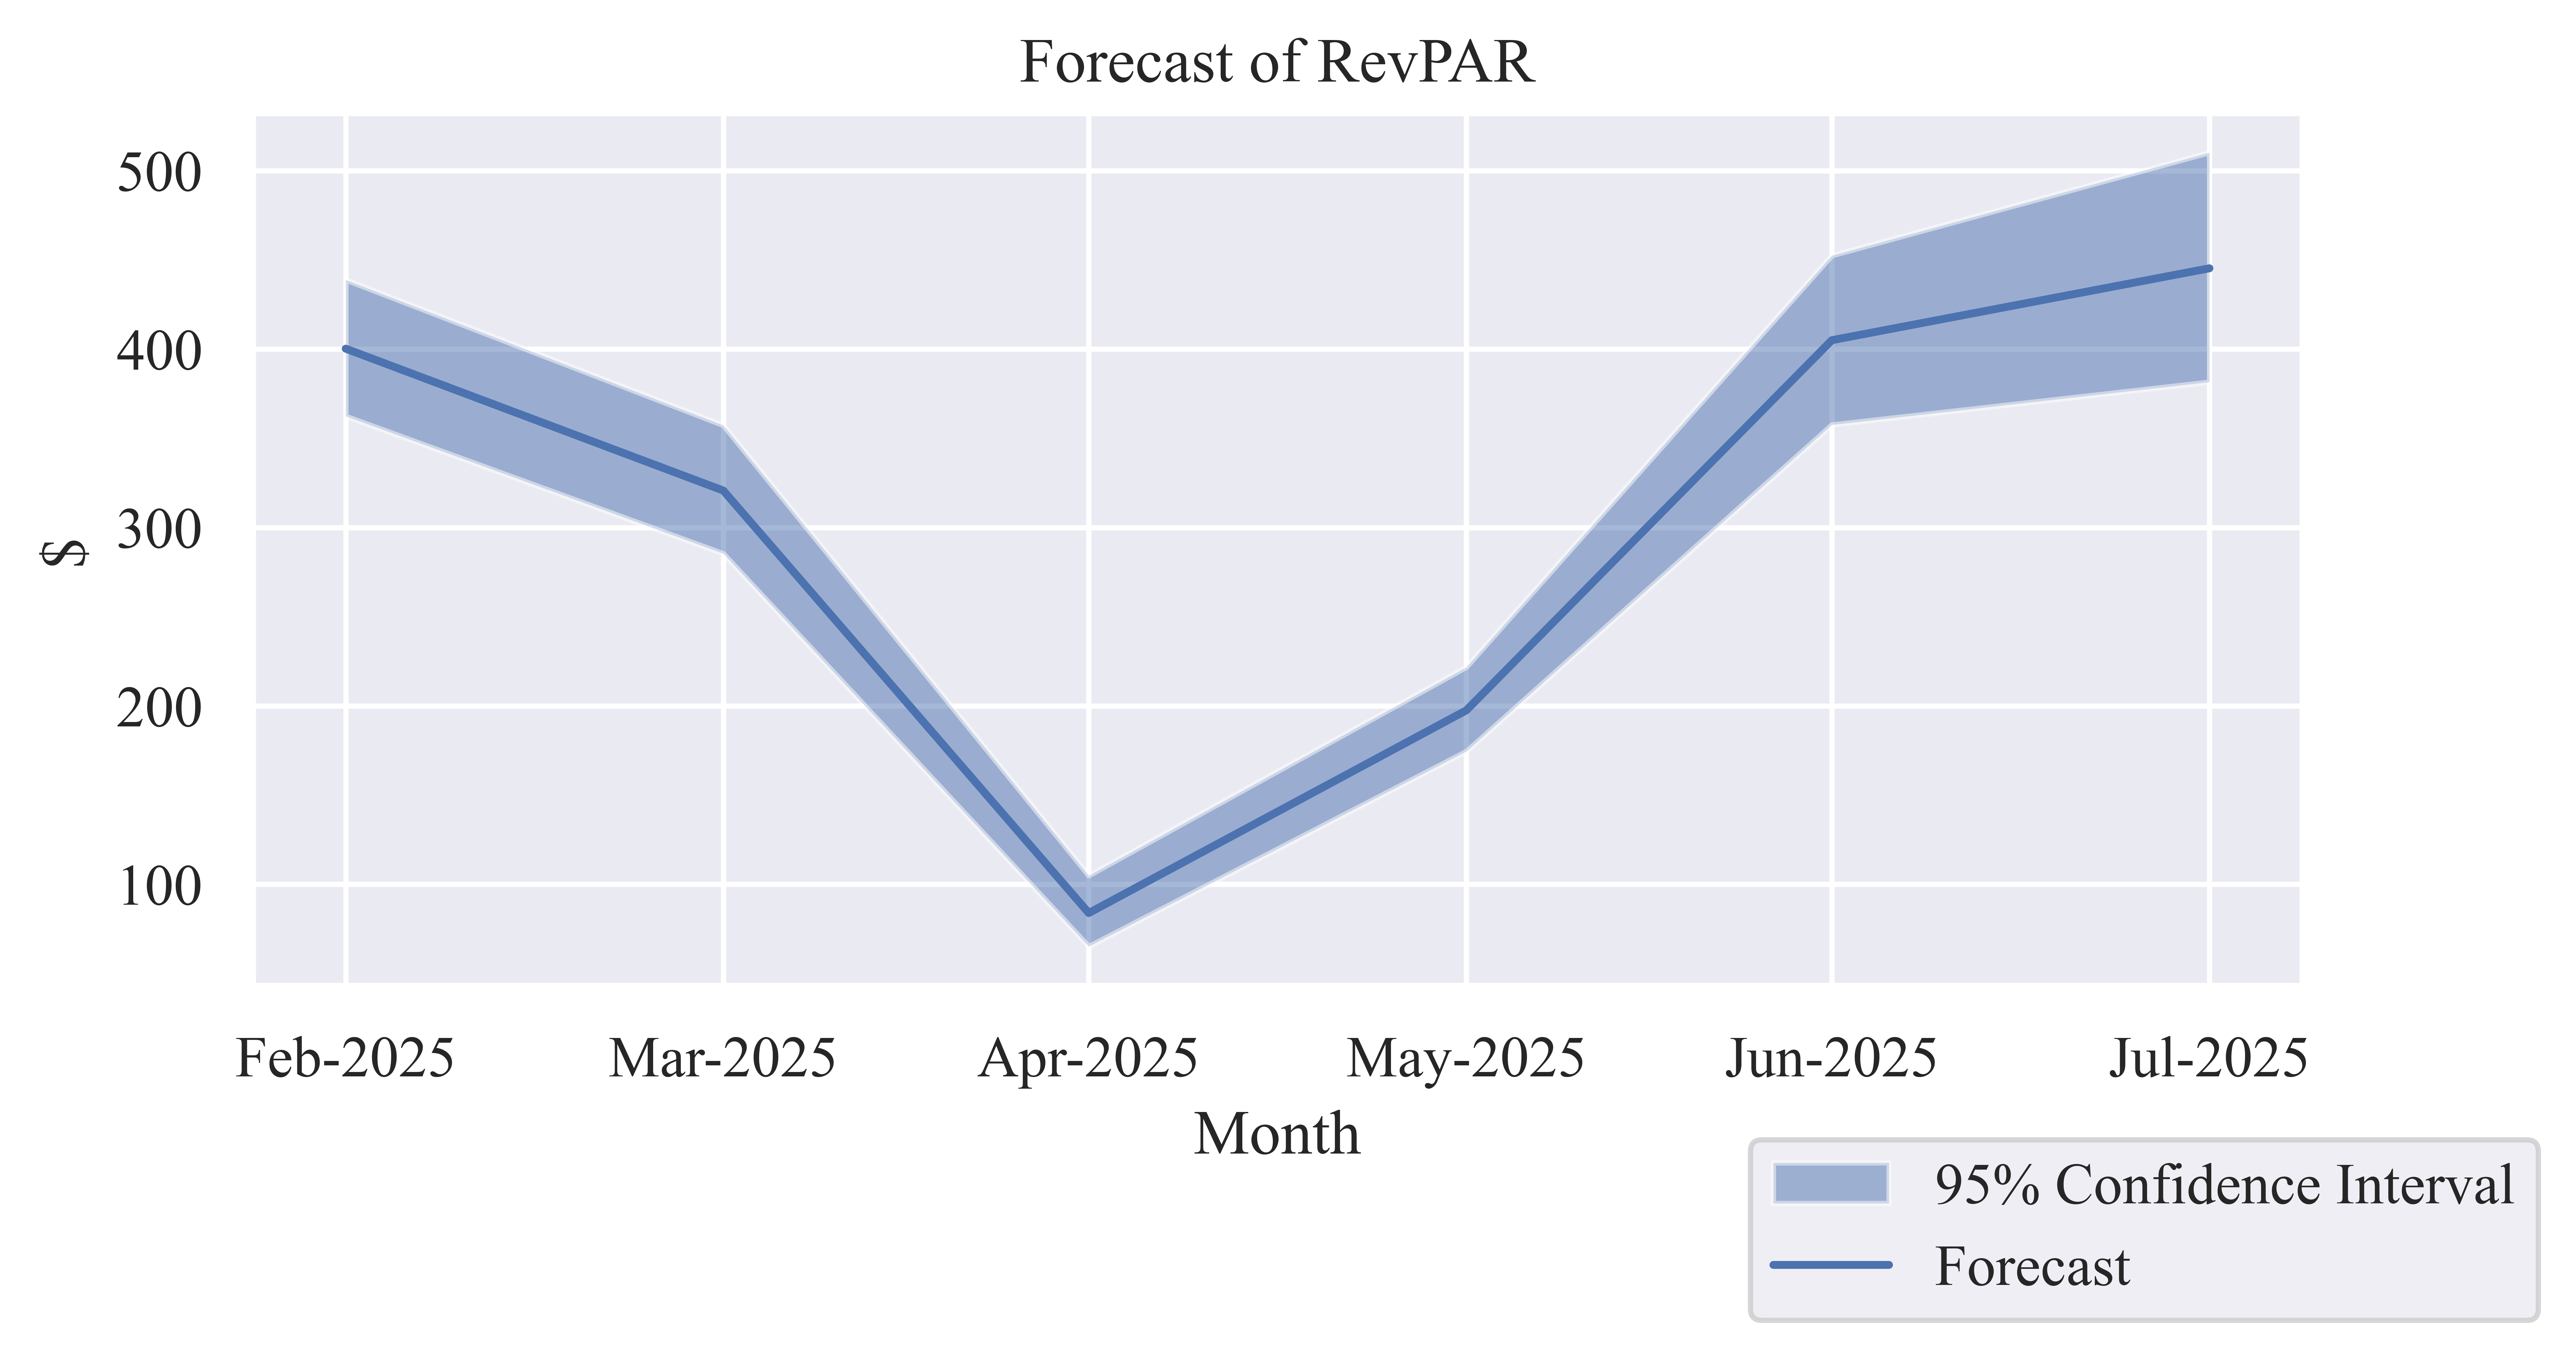
| Date | RevPAR Forecast | Lower CI Bound | Upper CI Bound |
|---|---|---|---|
| Mar-2025 | $307.50 | $282.78 | $332.78 |
| Apr-2025 | $80.92 | $62.79 | $100.91 |
| May-2025 | $212.24 | $185.11 | $240.65 |
| Jun-2025 | $435.44 | $397.22 | $474.07 |
| Jul-2025 | $467.02 | $413.64 | $521.49 |
| Aug-2025 | $423.04 | $374.18 | $472.90 |
Tax Revenues
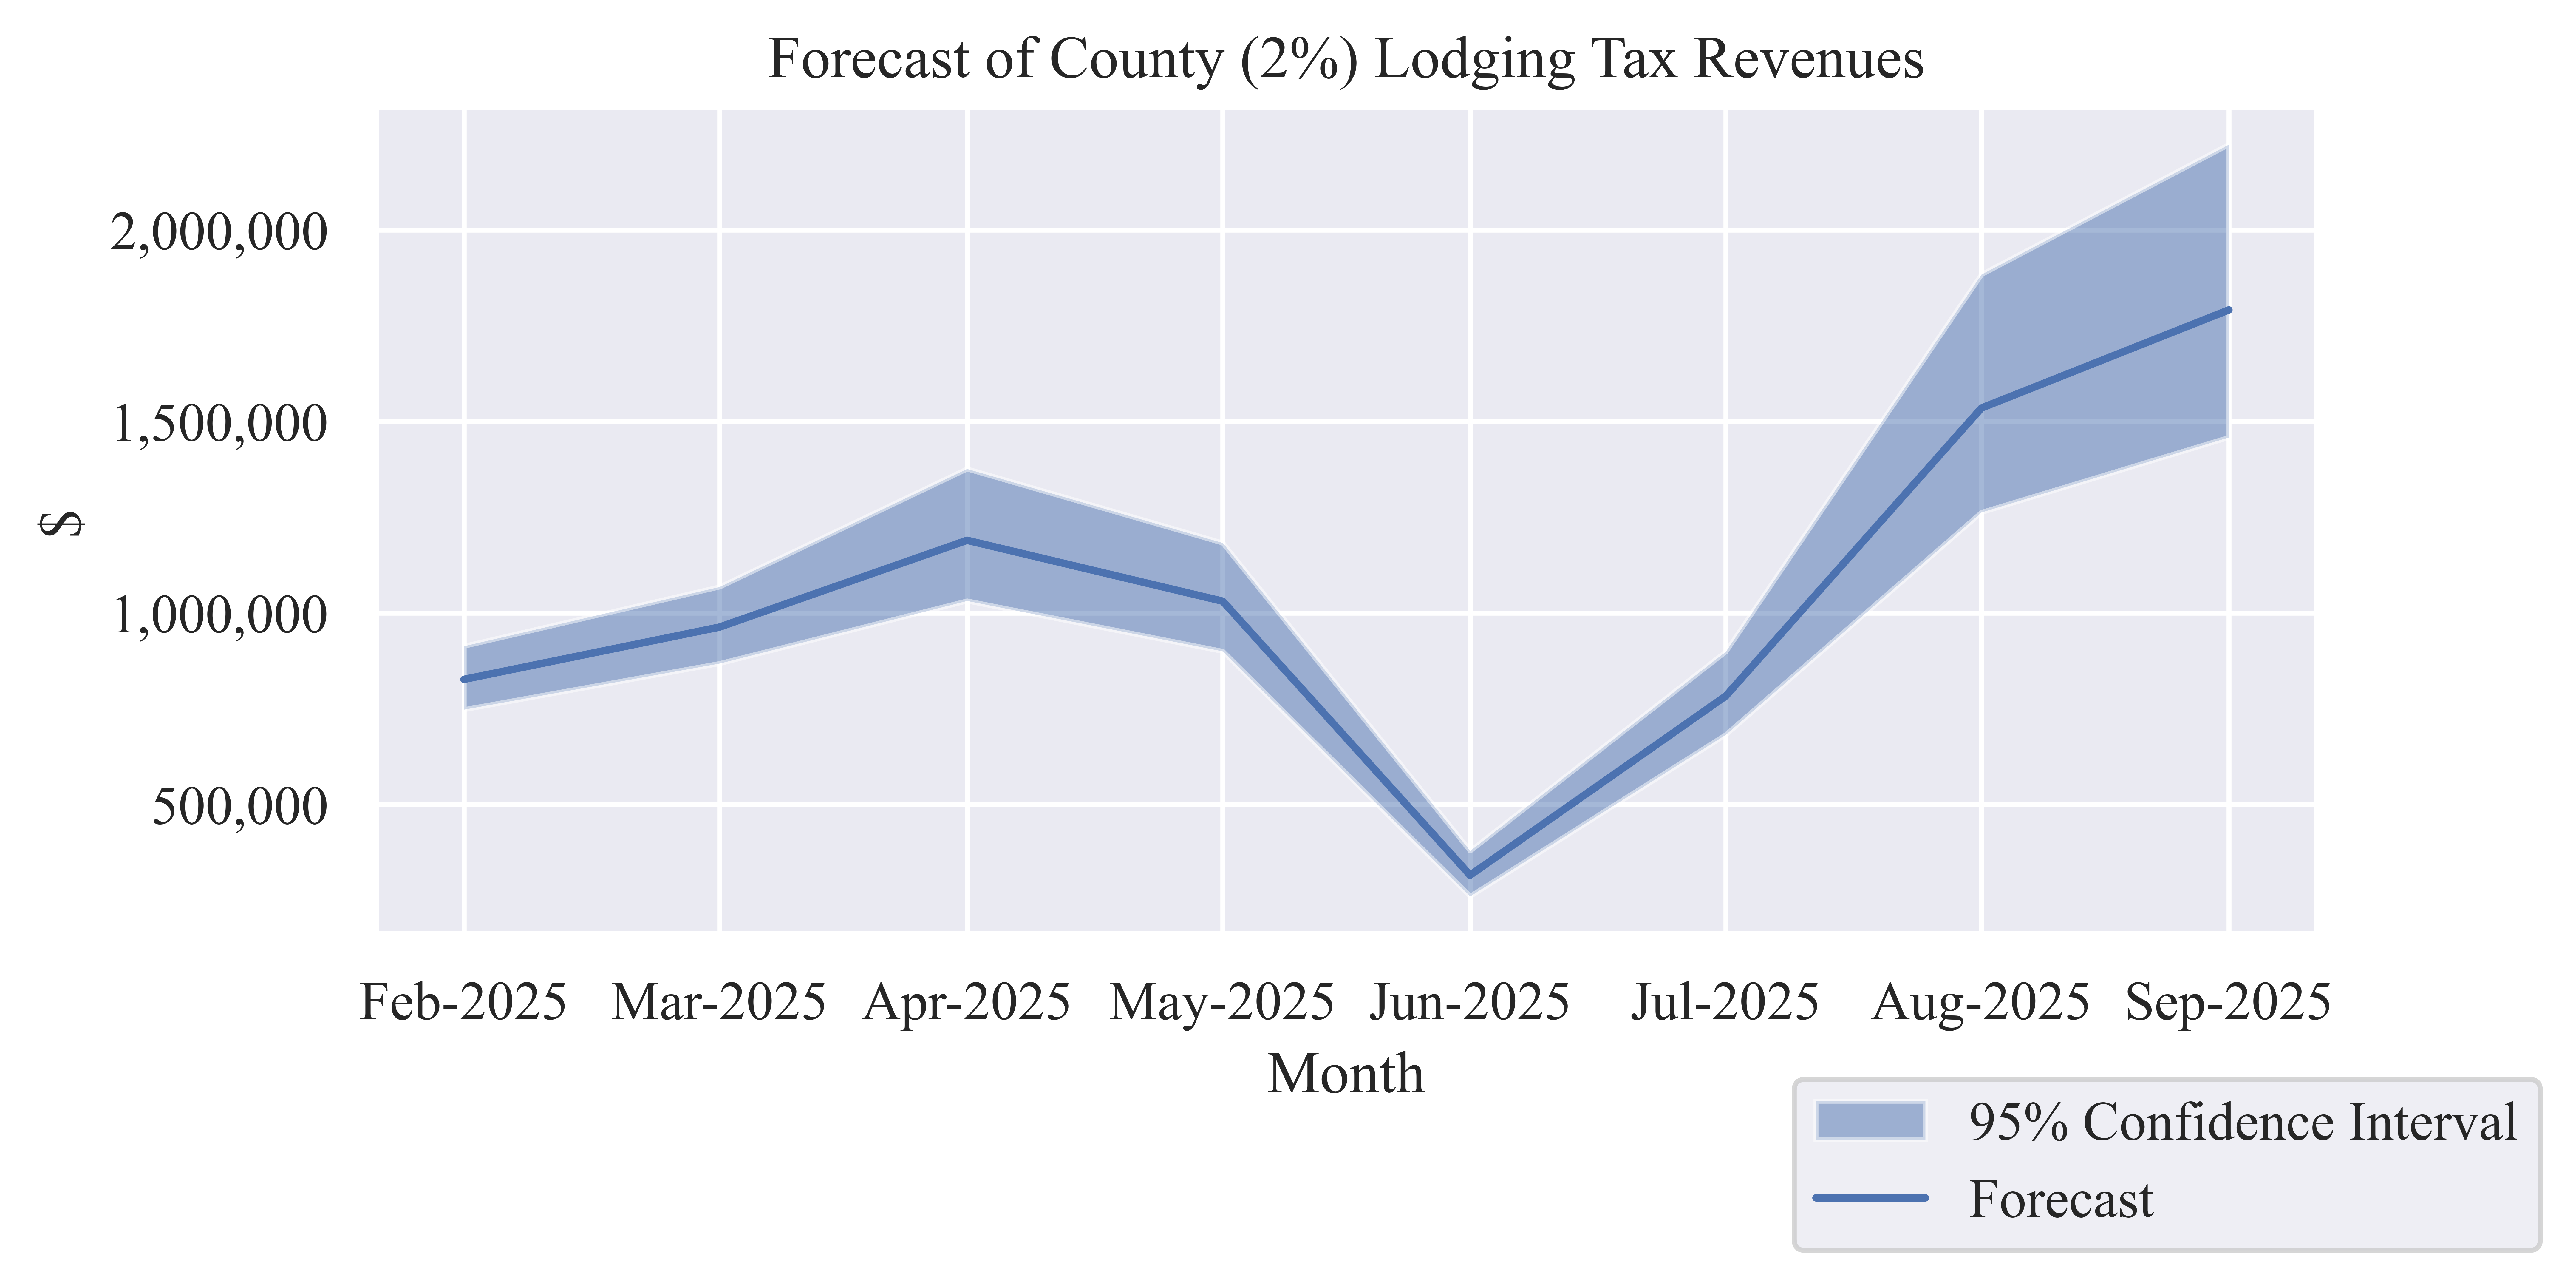
| Date | Tax Revenue Forecast | Lower CI Bound | Upper CI Bound |
|---|---|---|---|
| Mar-2025 | $953,952 | $865,524 | $1,051,415 |
| Apr-2025 | $1,084,856 | $979,731 | $1,201,262 |
| May-2025 | $1,005,682 | $891,774 | $1,135,872 |
| Jun-2025 | $301,447 | $251,010 | $360,089 |
| Jul-2025 | $782,525 | $695,597 | $880,176 |
| Aug-2025 | $1,561,848 | $1,323,486 | $1,856,067 |
| Sep-2025 | $1,776,855 | $1,482,330 | $2,148,425 |
| Oct-2025 | $1,742,193 | $1,399,448 | $2,203,857 |
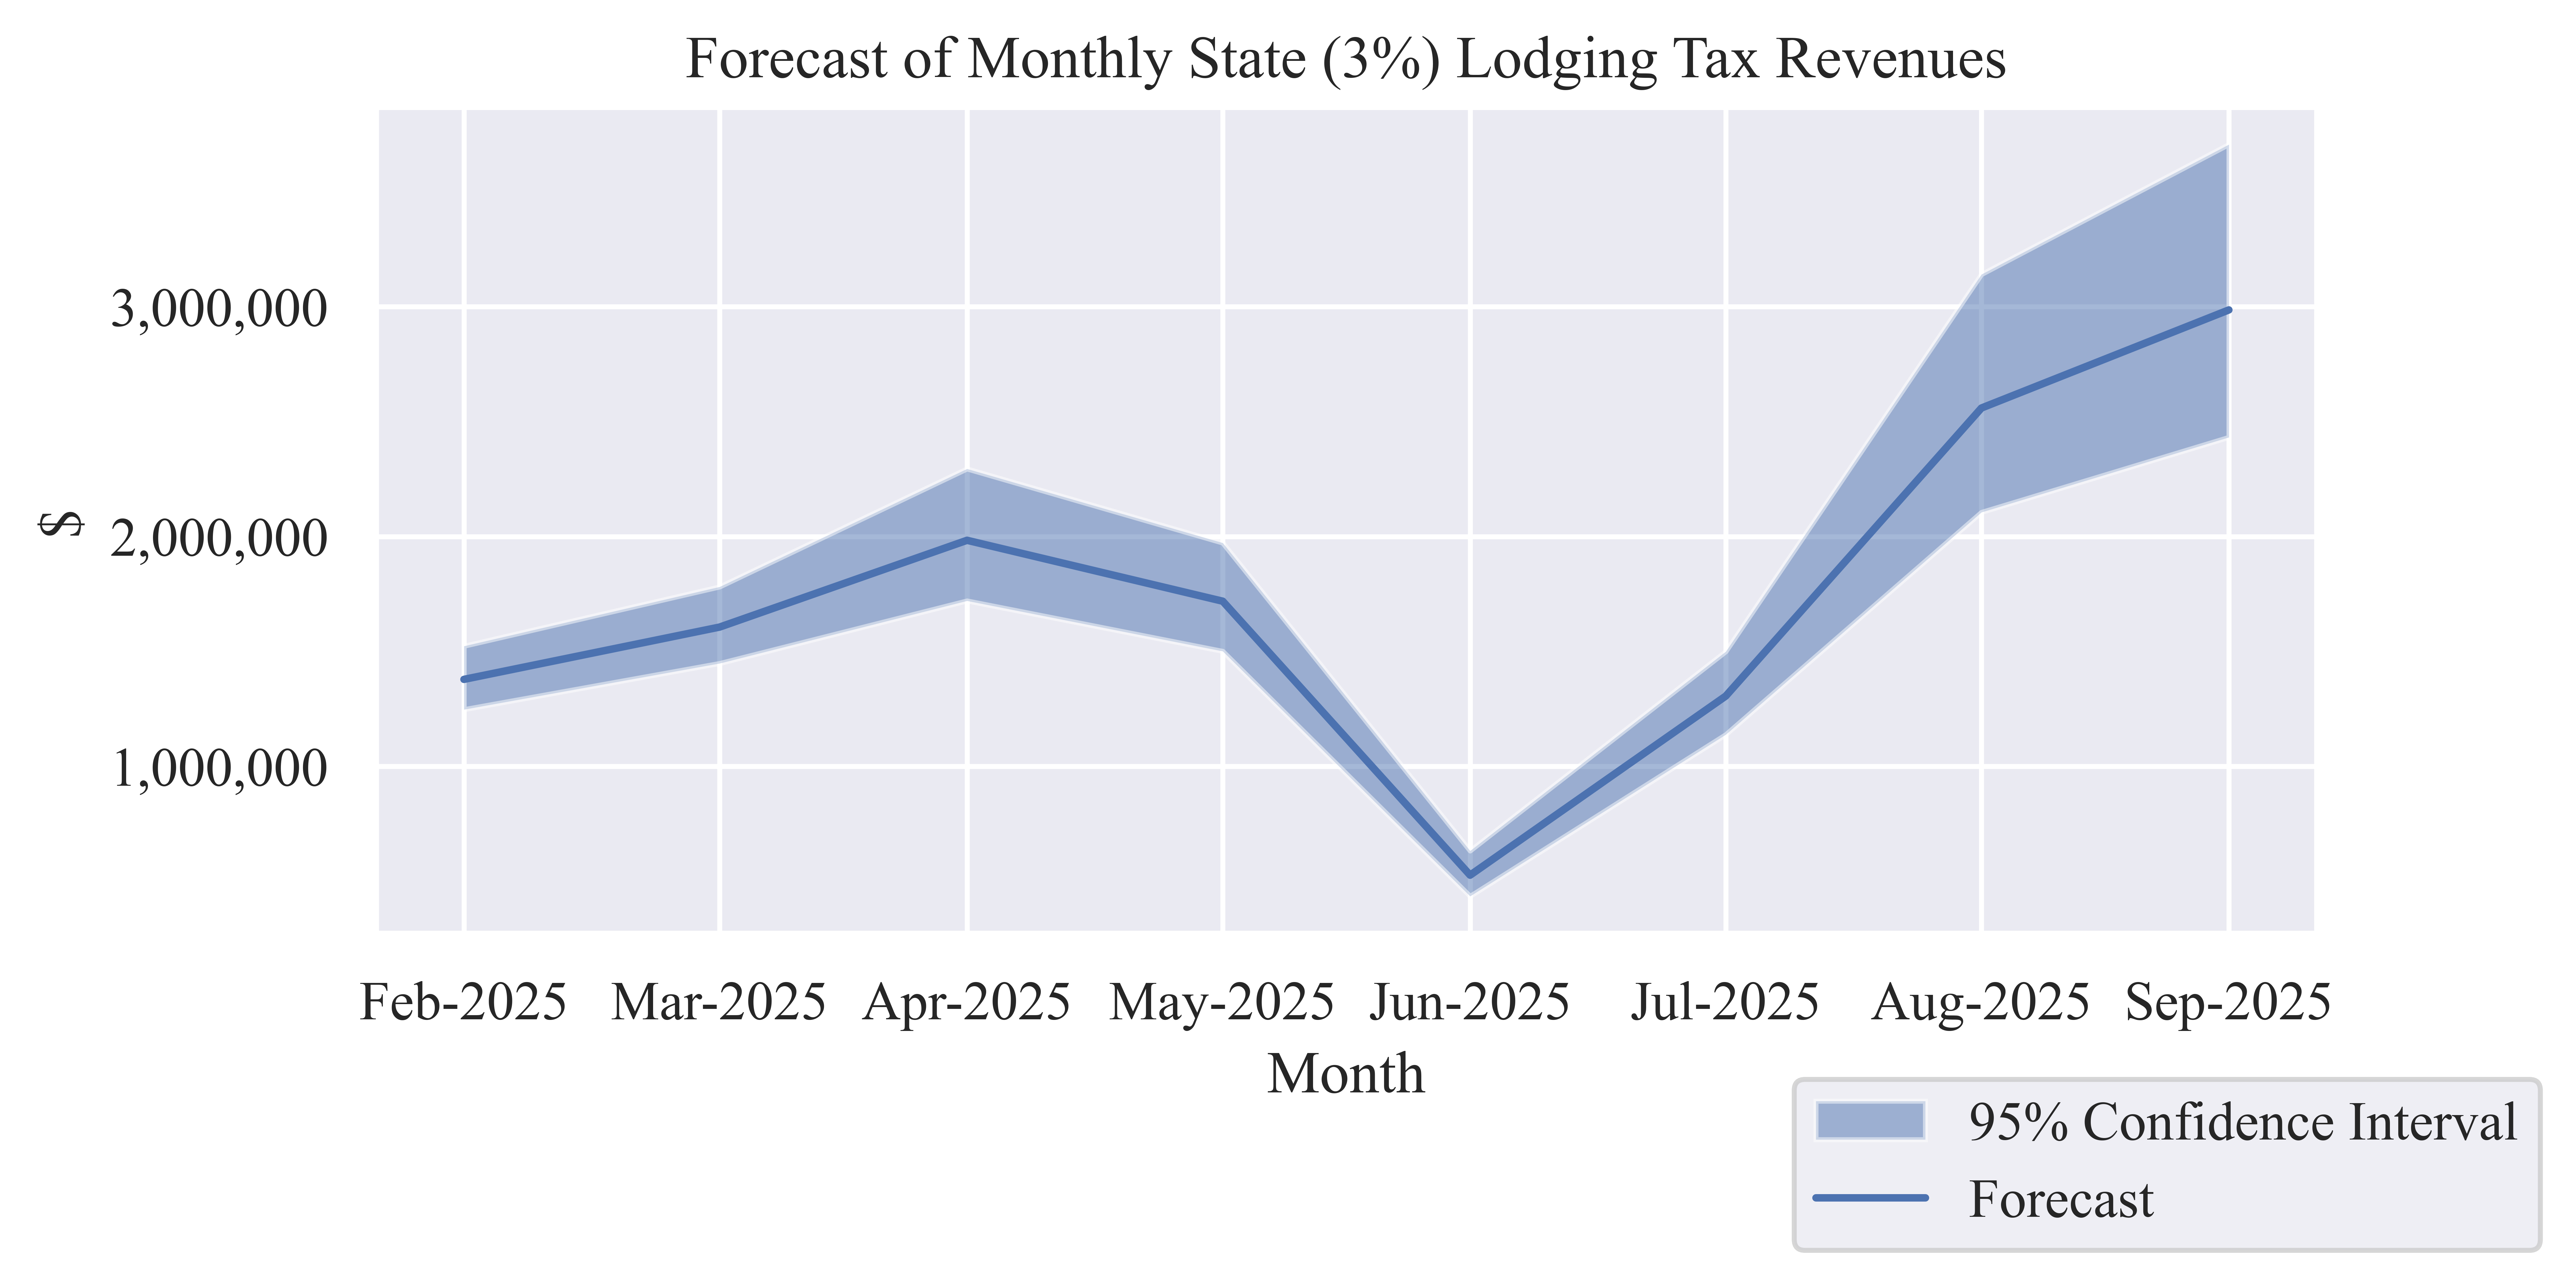
| Date | Tax Revenue Forecast | Lower CI Bound | Upper CI Bound |
|---|---|---|---|
| Mar-2025 | $1,589,920 | $1,442,540 | $1,752,358 |
| Apr-2025 | $1,808,094 | $1,632,885 | $2,002,103 |
| May-2025 | $1,676,137 | $1,486,290 | $1,893,119 |
| Jun-2025 | $502,411 | $418,350 | $600,149 |
| Jul-2025 | $1,304,208 | $1,159,328 | $1,466,961 |
| Aug-2025 | $2,603,081 | $2,205,810 | $3,093,445 |
| Sep-2025 | $2,961,425 | $2,470,550 | $3,580,708 |
| Oct-2025 | $2,903,655 | $2,332,414 | $3,673,094 |
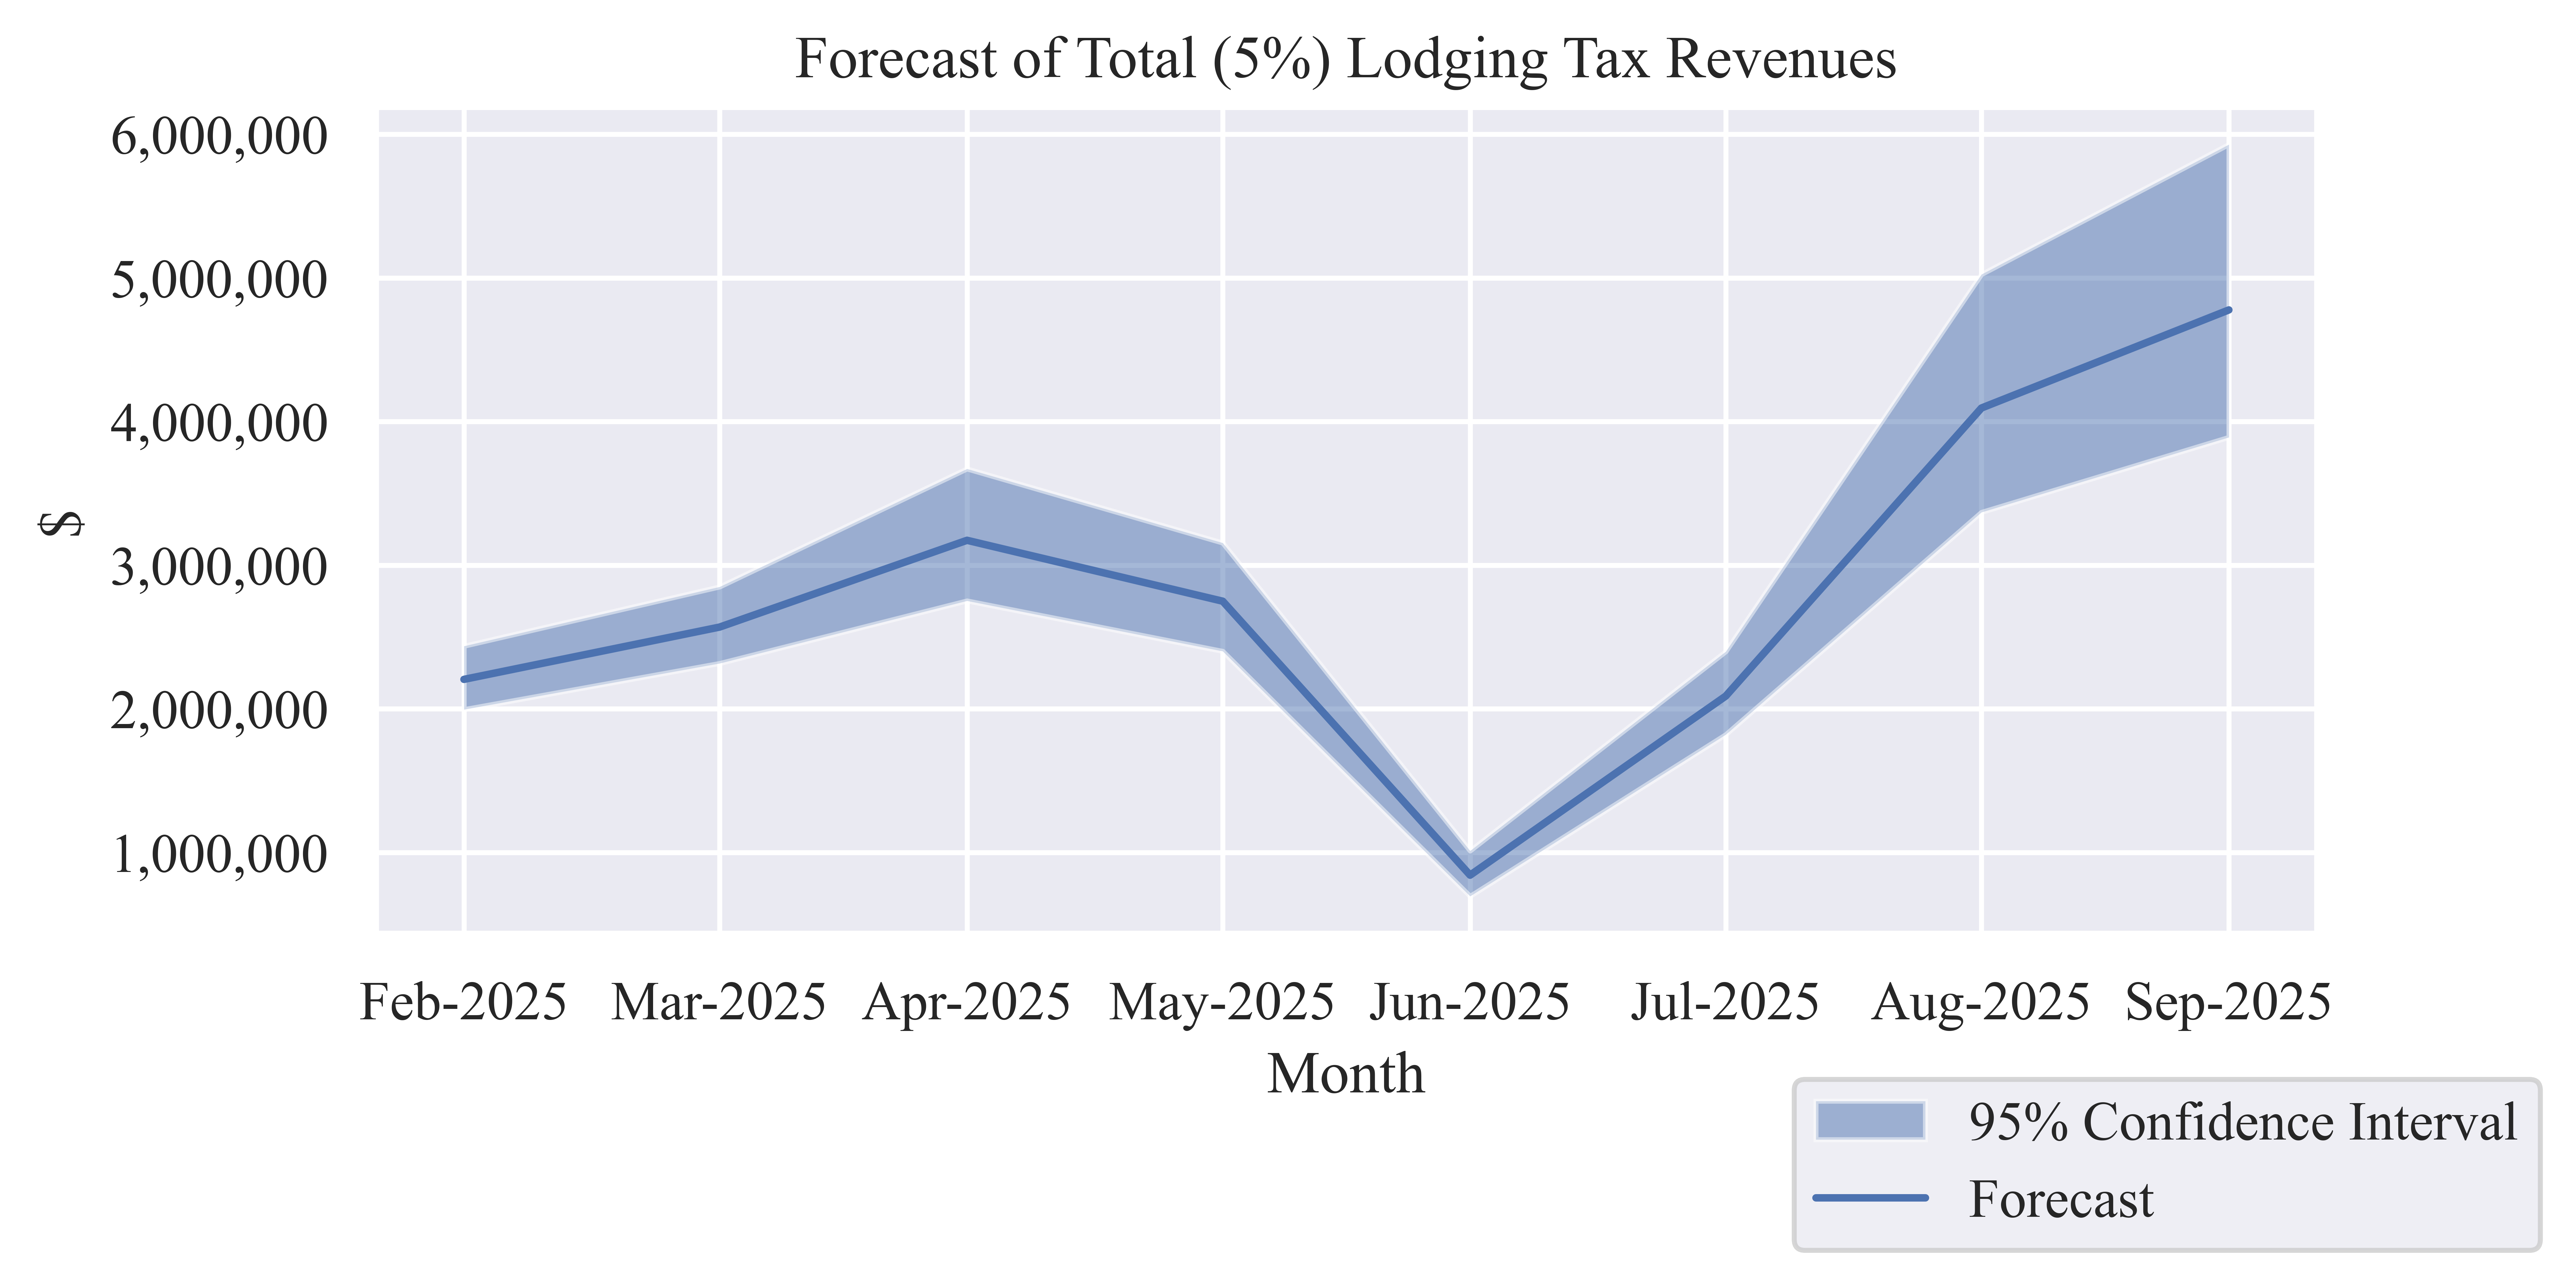
| Date | Tax Revenue Forecast | Lower CI Bound | Upper CI Bound |
|---|---|---|---|
| Mar-2025 | $2,543,872 | $2,308,064 | $2,803,772 |
| Apr-2025 | $2,892,950 | $2,612,616 | $3,203,364 |
| May-2025 | $2,681,819 | $2,378,064 | $3,028,991 |
| Jun-2025 | $803,858 | $669,361 | $960,239 |
| Jul-2025 | $2,086,733 | $1,854,925 | $2,347,137 |
| Aug-2025 | $4,164,929 | $3,529,296 | $4,949,512 |
| Sep-2025 | $4,738,280 | $3,952,880 | $5,729,132 |
| Oct-2025 | $4,645,847 | $3,731,862 | $5,876,951 |
Lodging Sector Sales
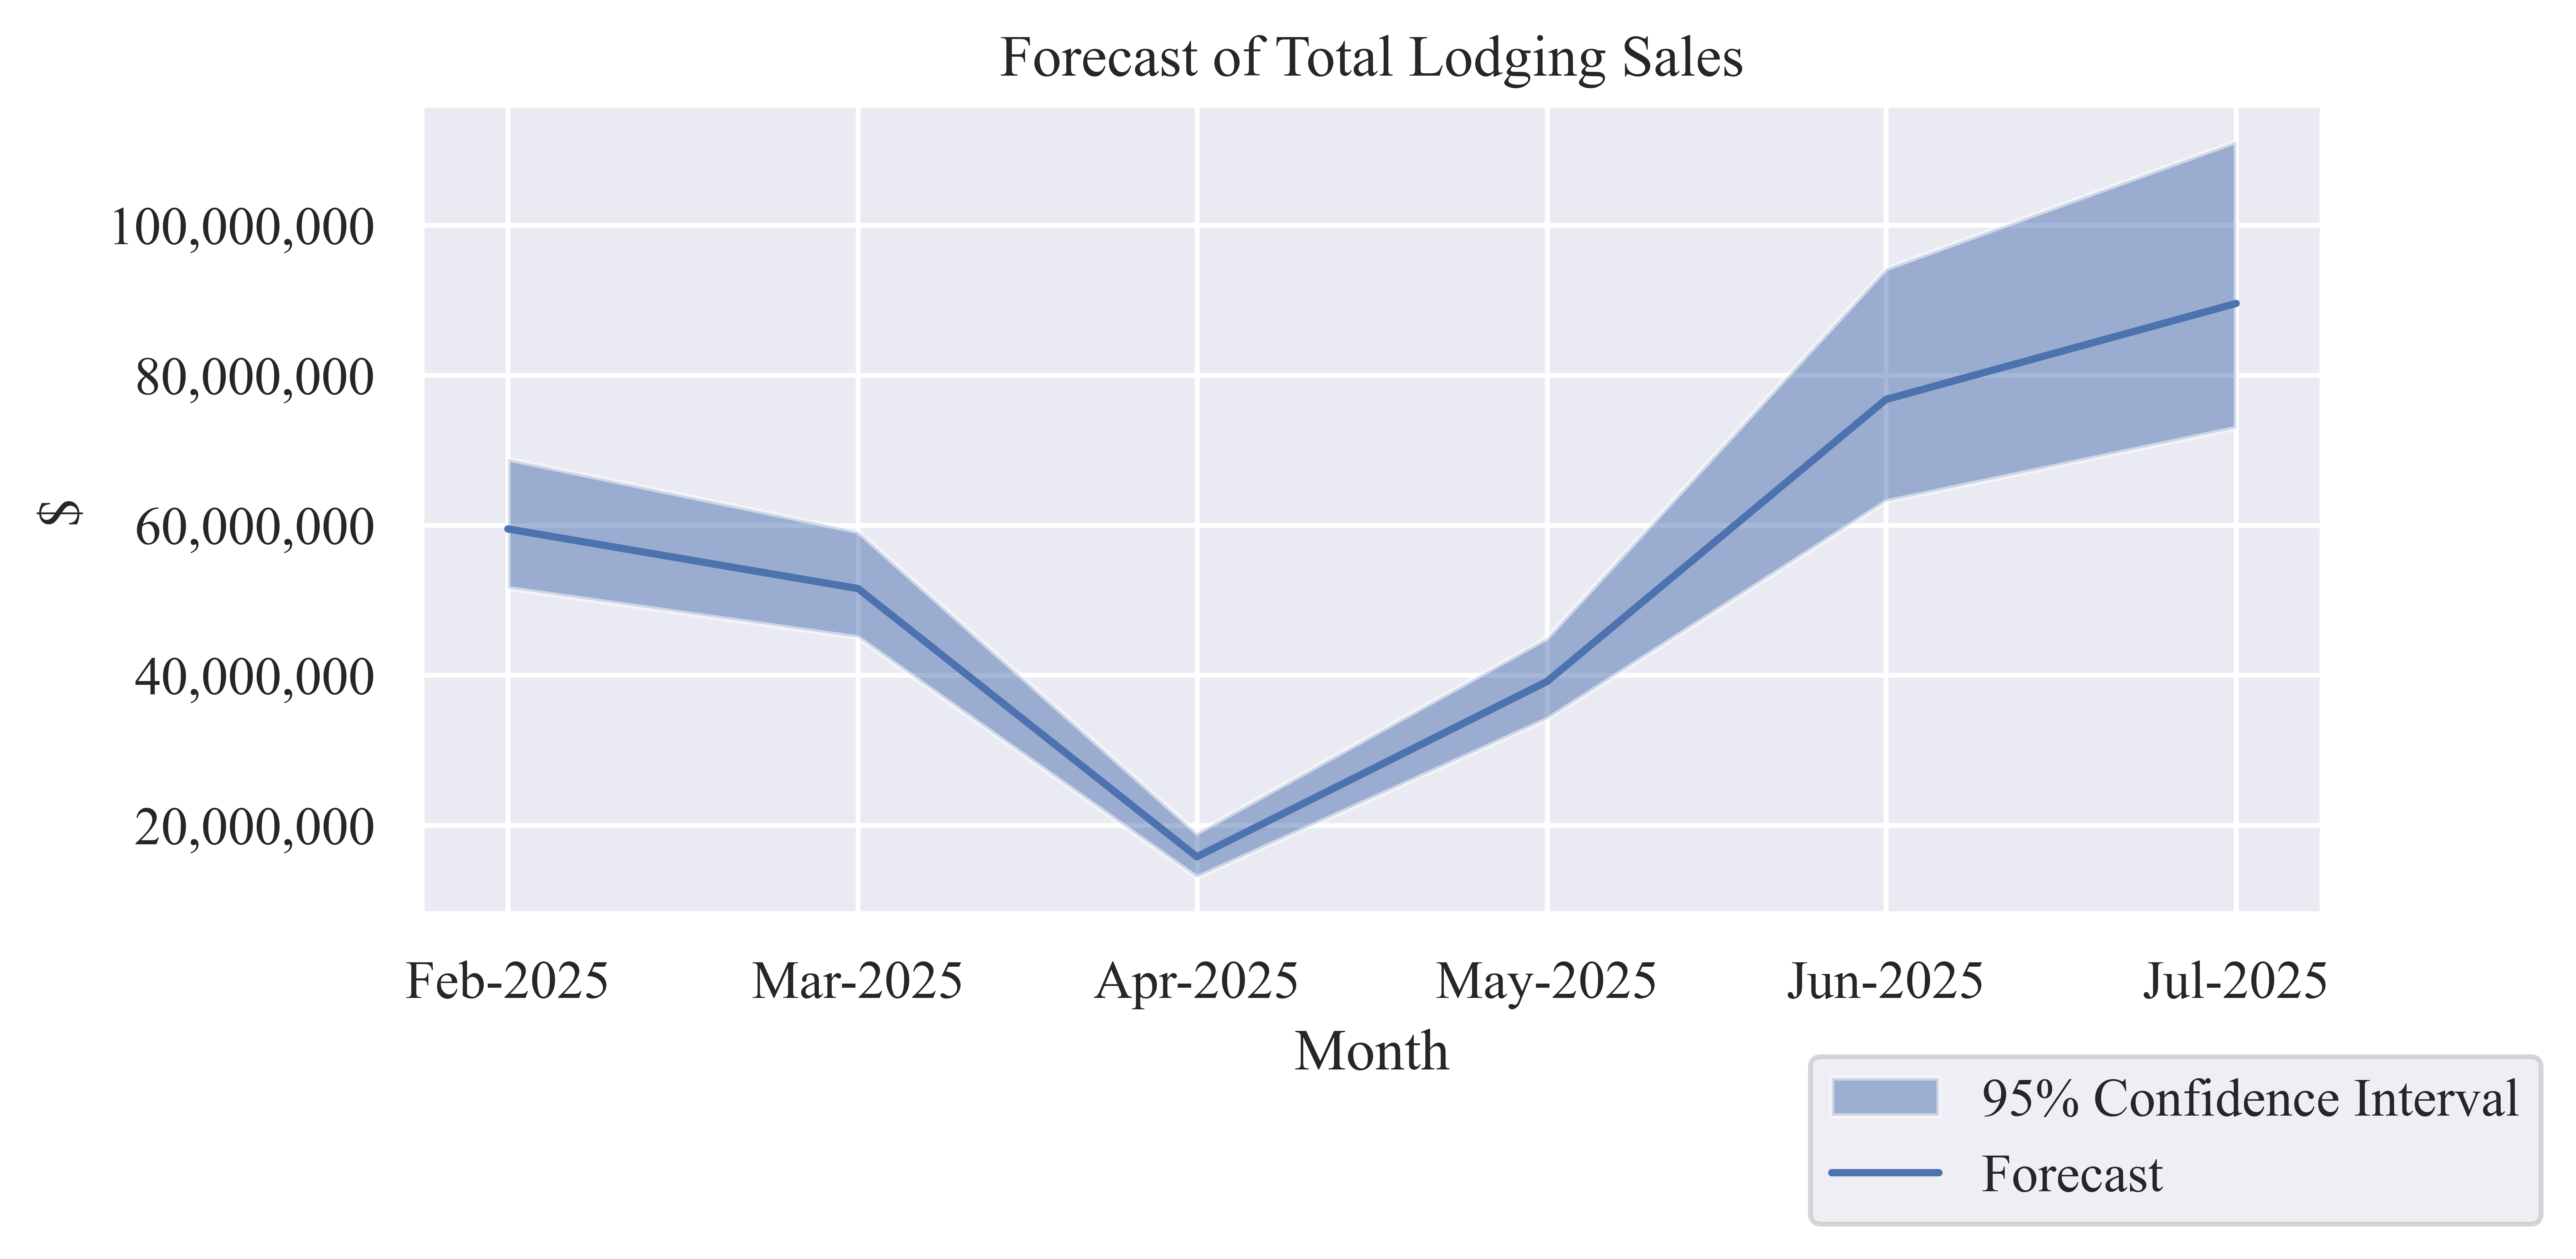
| Date | Lodging Sales Forecast | Lower CI Bound | Upper CI Bound |
|---|---|---|---|
| Mar-2025 | $50,284,098 | $44,588,695 | $56,793,577 |
| Apr-2025 | $15,072,335 | $12,550,513 | $18,004,474 |
| May-2025 | $39,126,253 | $34,779,851 | $44,008,822 |
| Jun-2025 | $78,092,417 | $66,174,295 | $92,803,342 |
| Jul-2025 | $88,842,748 | $74,116,498 | $107,421,233 |
| Aug-2025 | $87,109,635 | $69,972,411 | $110,192,833 |
Economic Indicators
| Estimate | Direct | Indirect | Induced | Total |
|---|---|---|---|---|
| Low Estimate | $239,242,270 | $51,233,082 | $12,978,443 | $303,453,795 |
| Median Estimate | $290,240,105 | $62,154,130 | $15,744,980 | $368,139,214 |
| High Estimate | $355,993,193 | $76,234,978 | $19,311,974 | $451,540,145 |
| Estimate | Direct | Indirect | Induced | Total |
|---|---|---|---|---|
| Low Estimate | $77,379,385 | $17,269,238 | $3,582,192 | $98,230,815 |
| Median Estimate | $93,873,883 | $20,950,417 | $4,345,787 | $119,170,087 |
| High Estimate | $115,140,749 | $25,696,678 | $5,330,316 | $146,167,743 |
| Estimate | Direct | Indirect | Induced | Total |
|---|---|---|---|---|
| Low Estimate | $173,078,720 | $30,122,267 | $7,824,967 | $211,025,954 |
| Median Estimate | $209,972,869 | $36,543,250 | $9,492,968 | $256,009,087 |
| High Estimate | $257,541,638 | $44,822,024 | $11,643,581 | $314,007,243 |
| Estimate | Direct | Indirect | Induced | Total |
|---|---|---|---|---|
| Low Estimate | 3,015 | 484 | 134 | 3,634 |
| Median Estimate | 3,658 | 587 | 163 | 4,408 |
| High Estimate | 4,487 | 720 | 200 | 5,407 |

