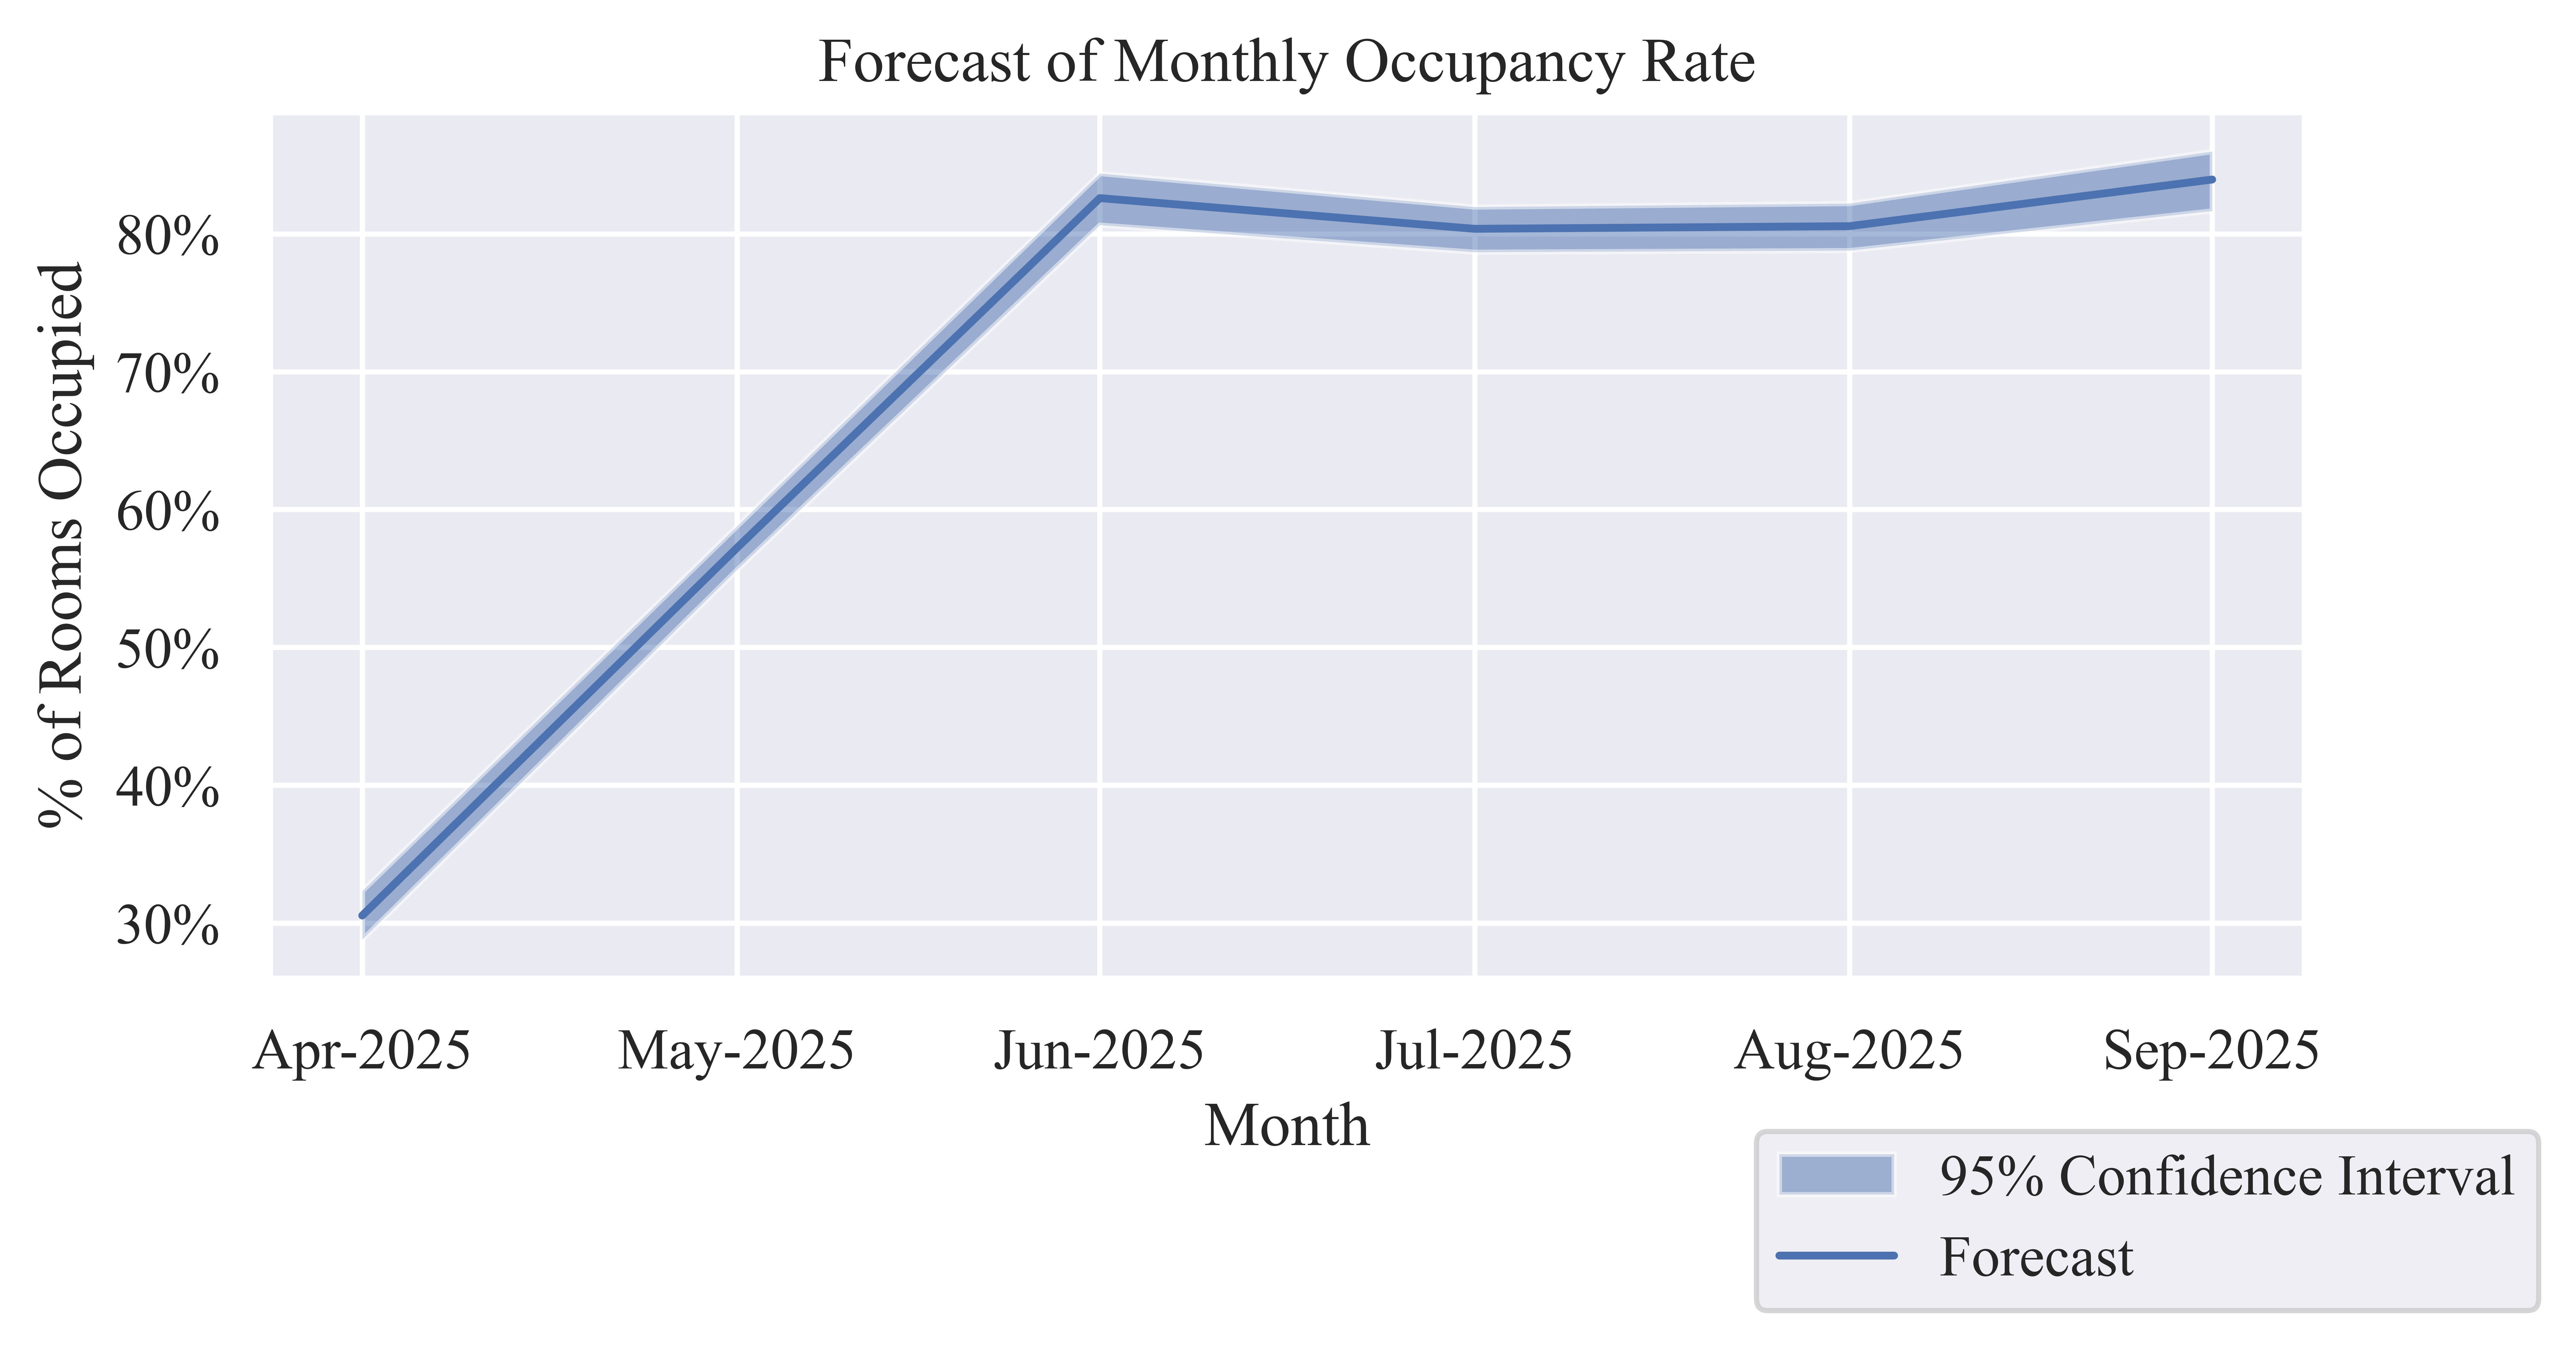
Occupancy Rate (OR)
| Date | Occupancy Rate Forecast | Lower CI Bound | Upper CI Bound |
|---|---|---|---|
| Apr-2025 | 30.54% | 28.81% | 32.33% |
| May-2025 | 57.22% | 55.64% | 58.80% |
| Jun-2025 | 82.59% | 80.64% | 84.38% |
| Jul-2025 | 80.36% | 78.67% | 81.95% |
| Aug-2025 | 80.56% | 78.79% | 82.21% |
| Sep-2025 | 83.94% | 81.67% | 85.98% |
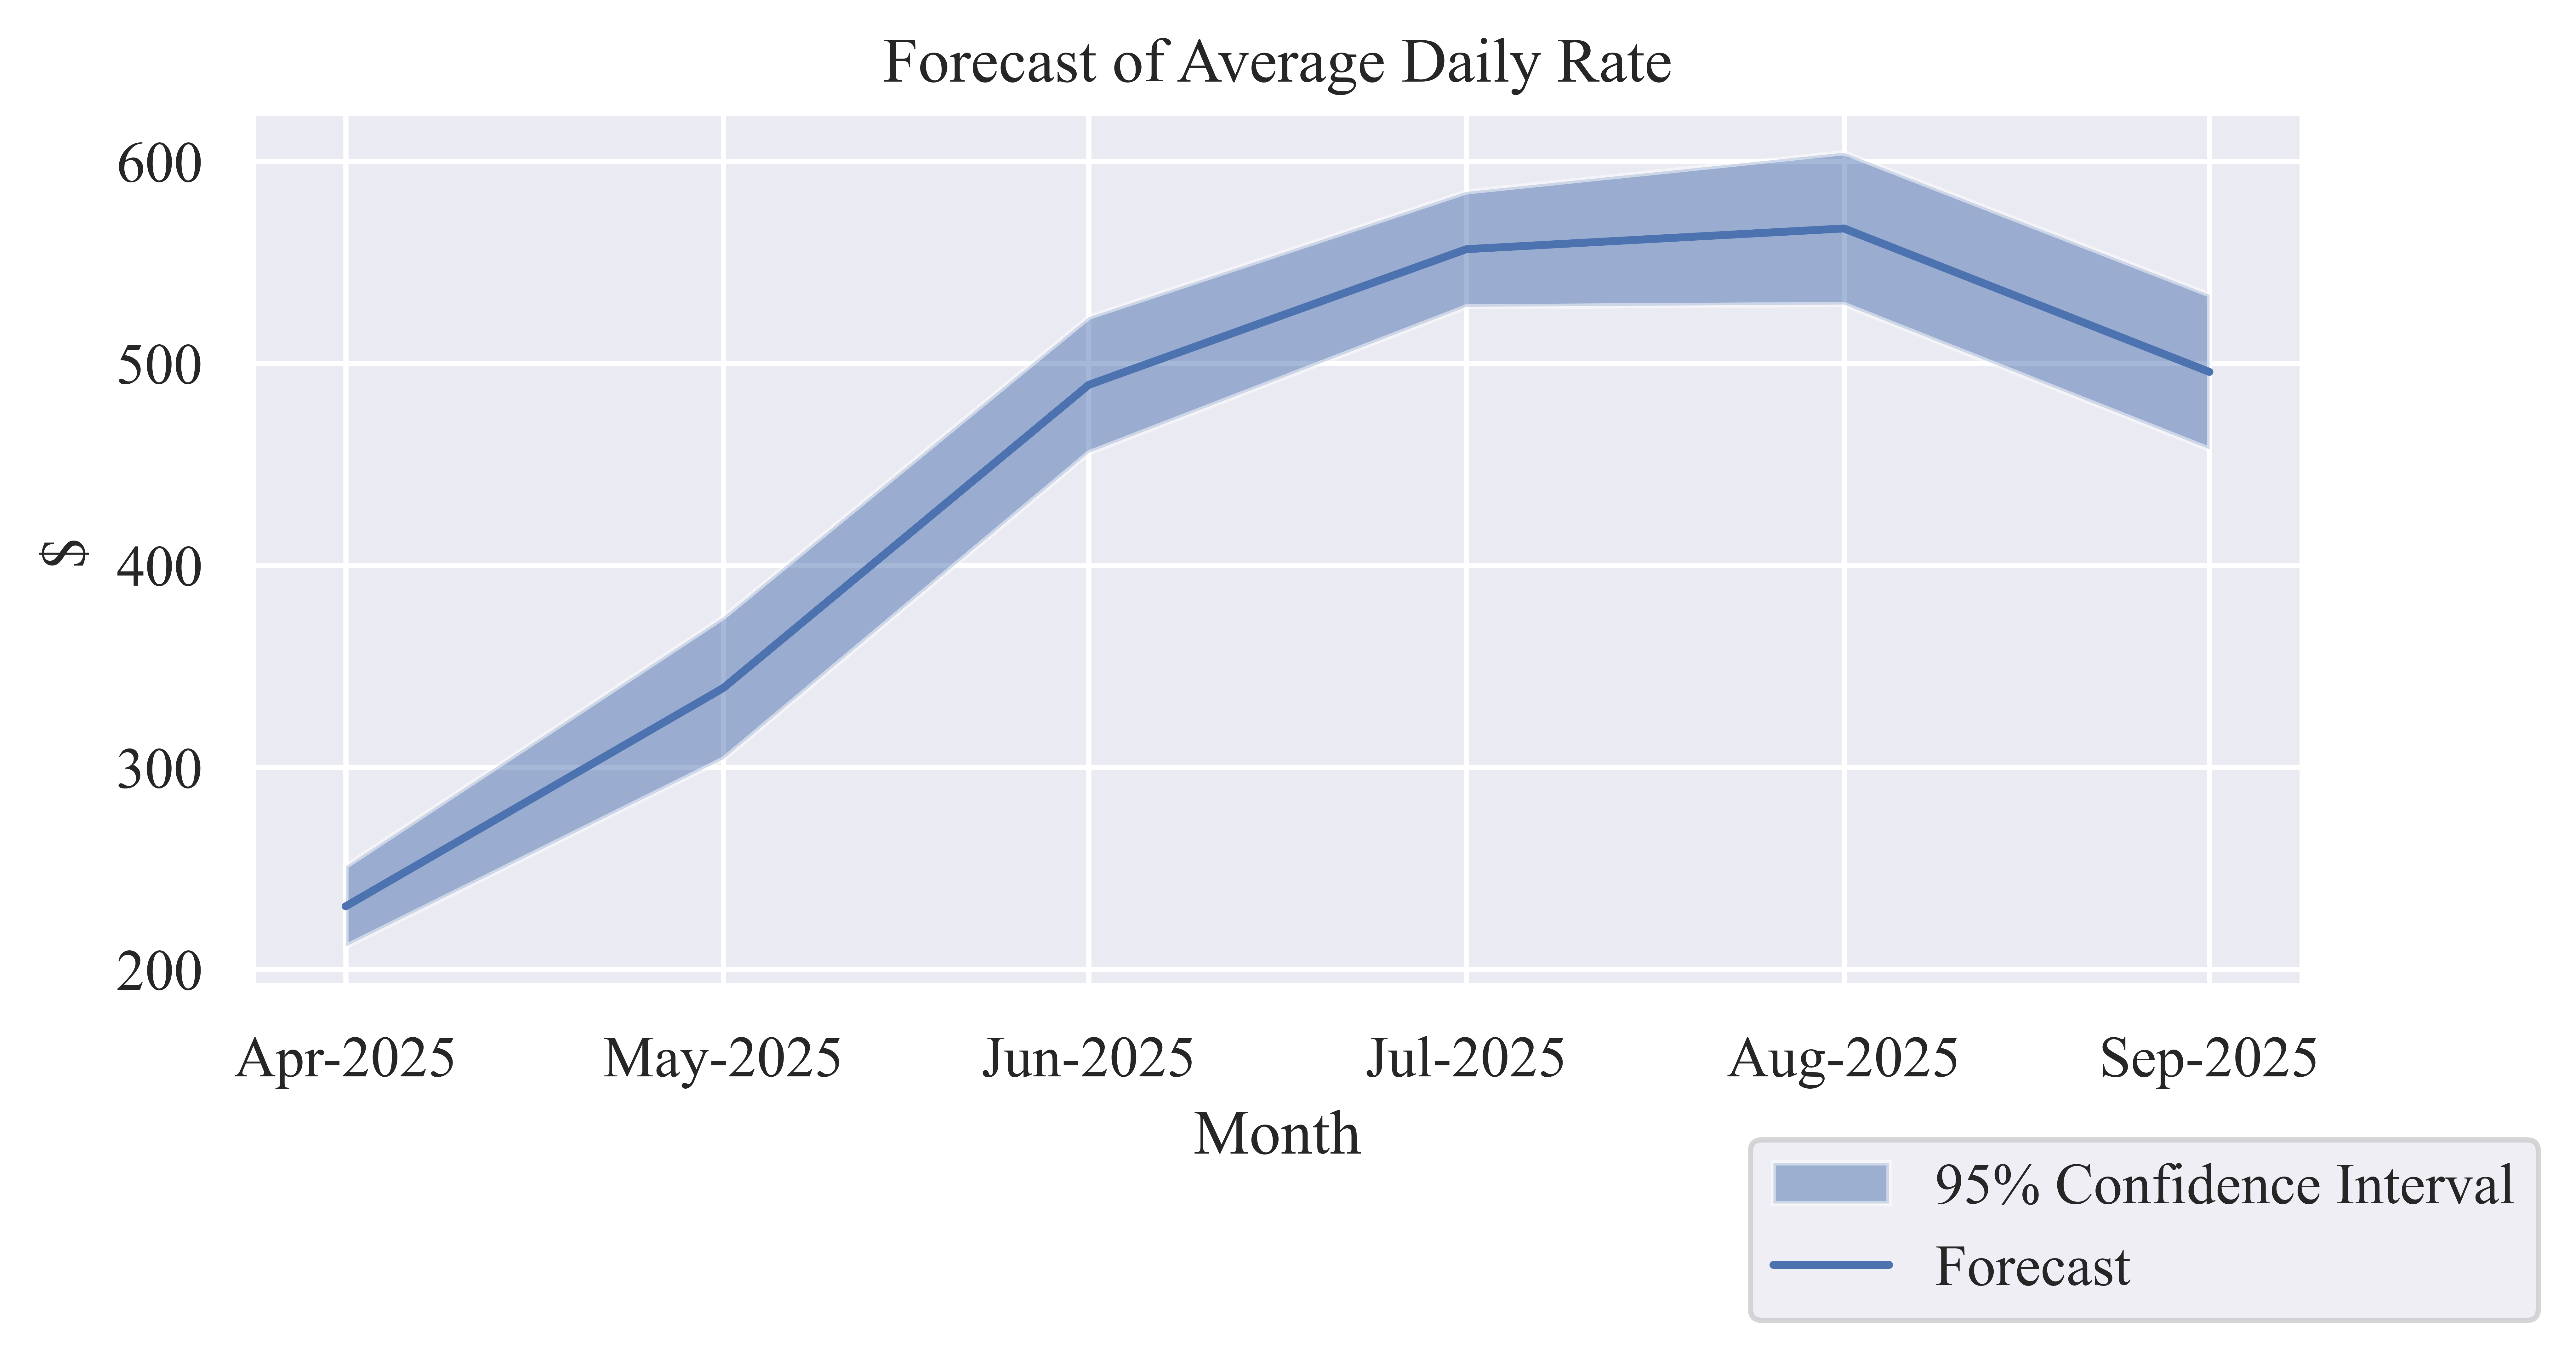
Average Daily Rate (ADR)
| Date | Average Daily Rate Forecast | Lower CI Bound | Upper CI Bound |
|---|---|---|---|
| Apr-2025 | $231.21 | $211.37 | $251.05 |
| May-2025 | $339.29 | $304.18 | $374.39 |
| Jun-2025 | $489.34 | $455.77 | $522.92 |
| Jul-2025 | $556.50 | $528.05 | $584.95 |
| Aug-2025 | $566.76 | $529.19 | $604.33 |
| Sep-2025 | $495.75 | $457.52 | $533.97 |
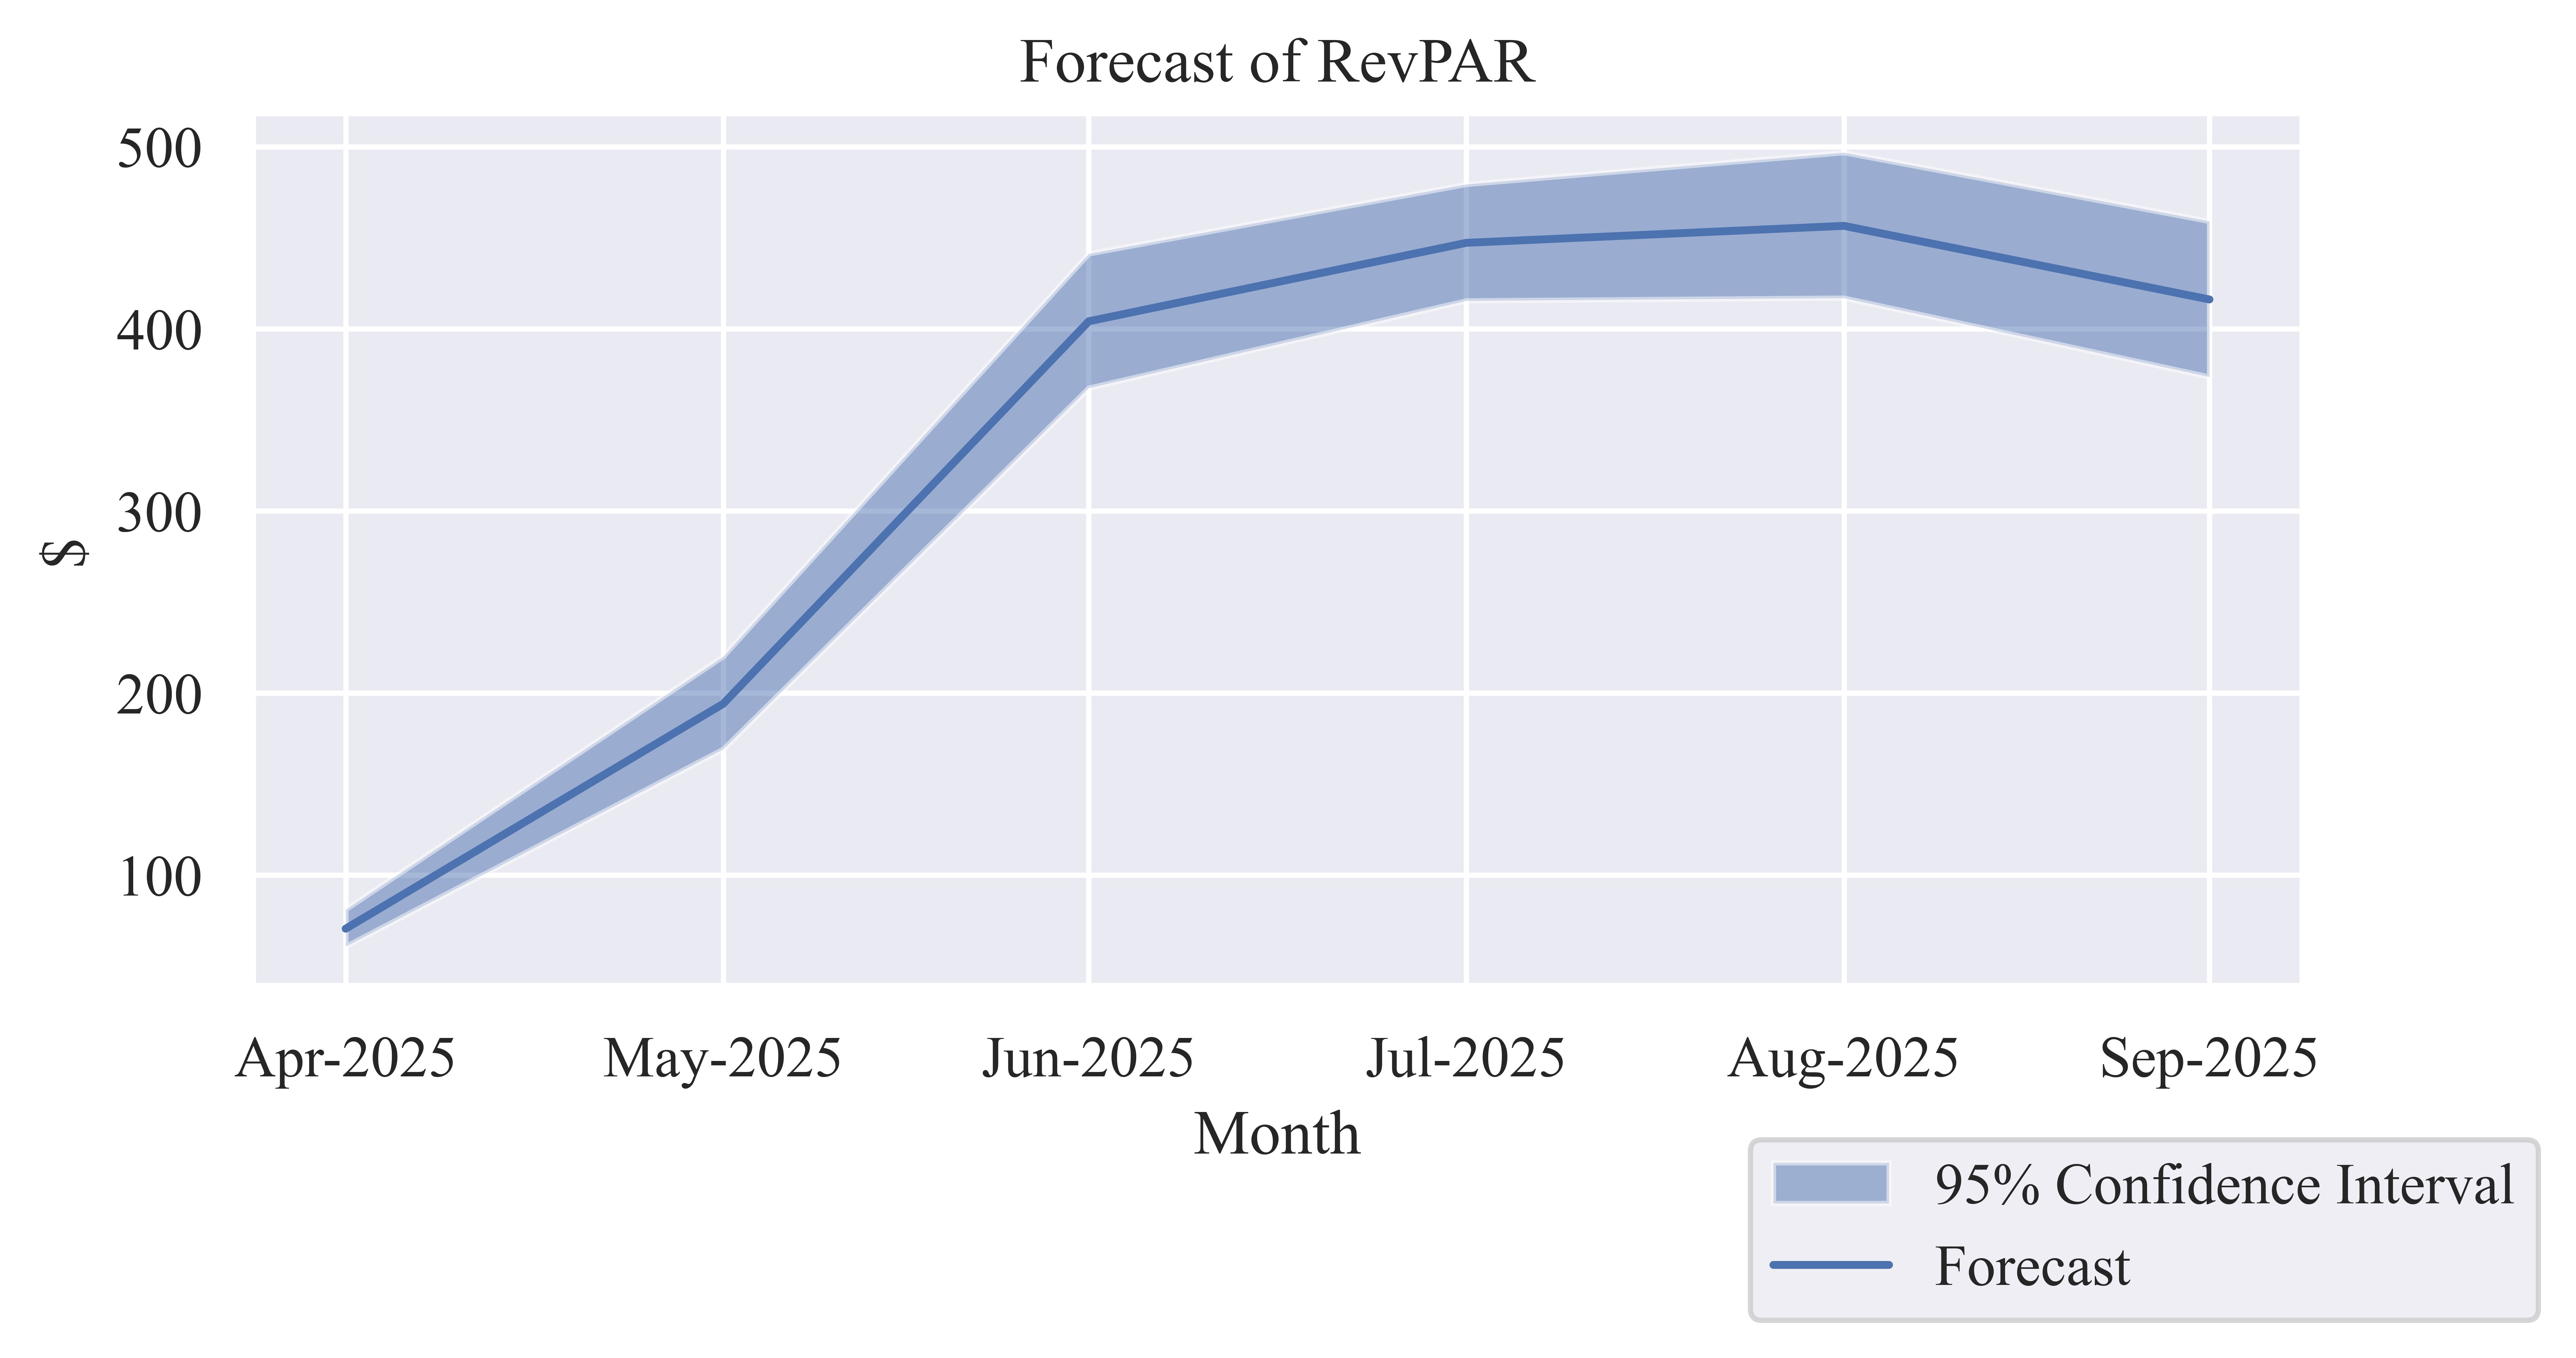
Revenue per Available Room (RevPAR)
| Date | RevPAR Forecast | Lower CI Bound | Upper CI Bound |
|---|---|---|---|
| Apr-2025 | $70.62 | $60.90 | $81.17 |
| May-2025 | $194.16 | $169.24 | $220.13 |
| Jun-2025 | $404.15 | $367.54 | $441.25 |
| Jul-2025 | $447.23 | $415.44 | $479.38 |
| Aug-2025 | $456.56 | $416.96 | $496.79 |
| Sep-2025 | $416.13 | $373.65 | $459.09 |
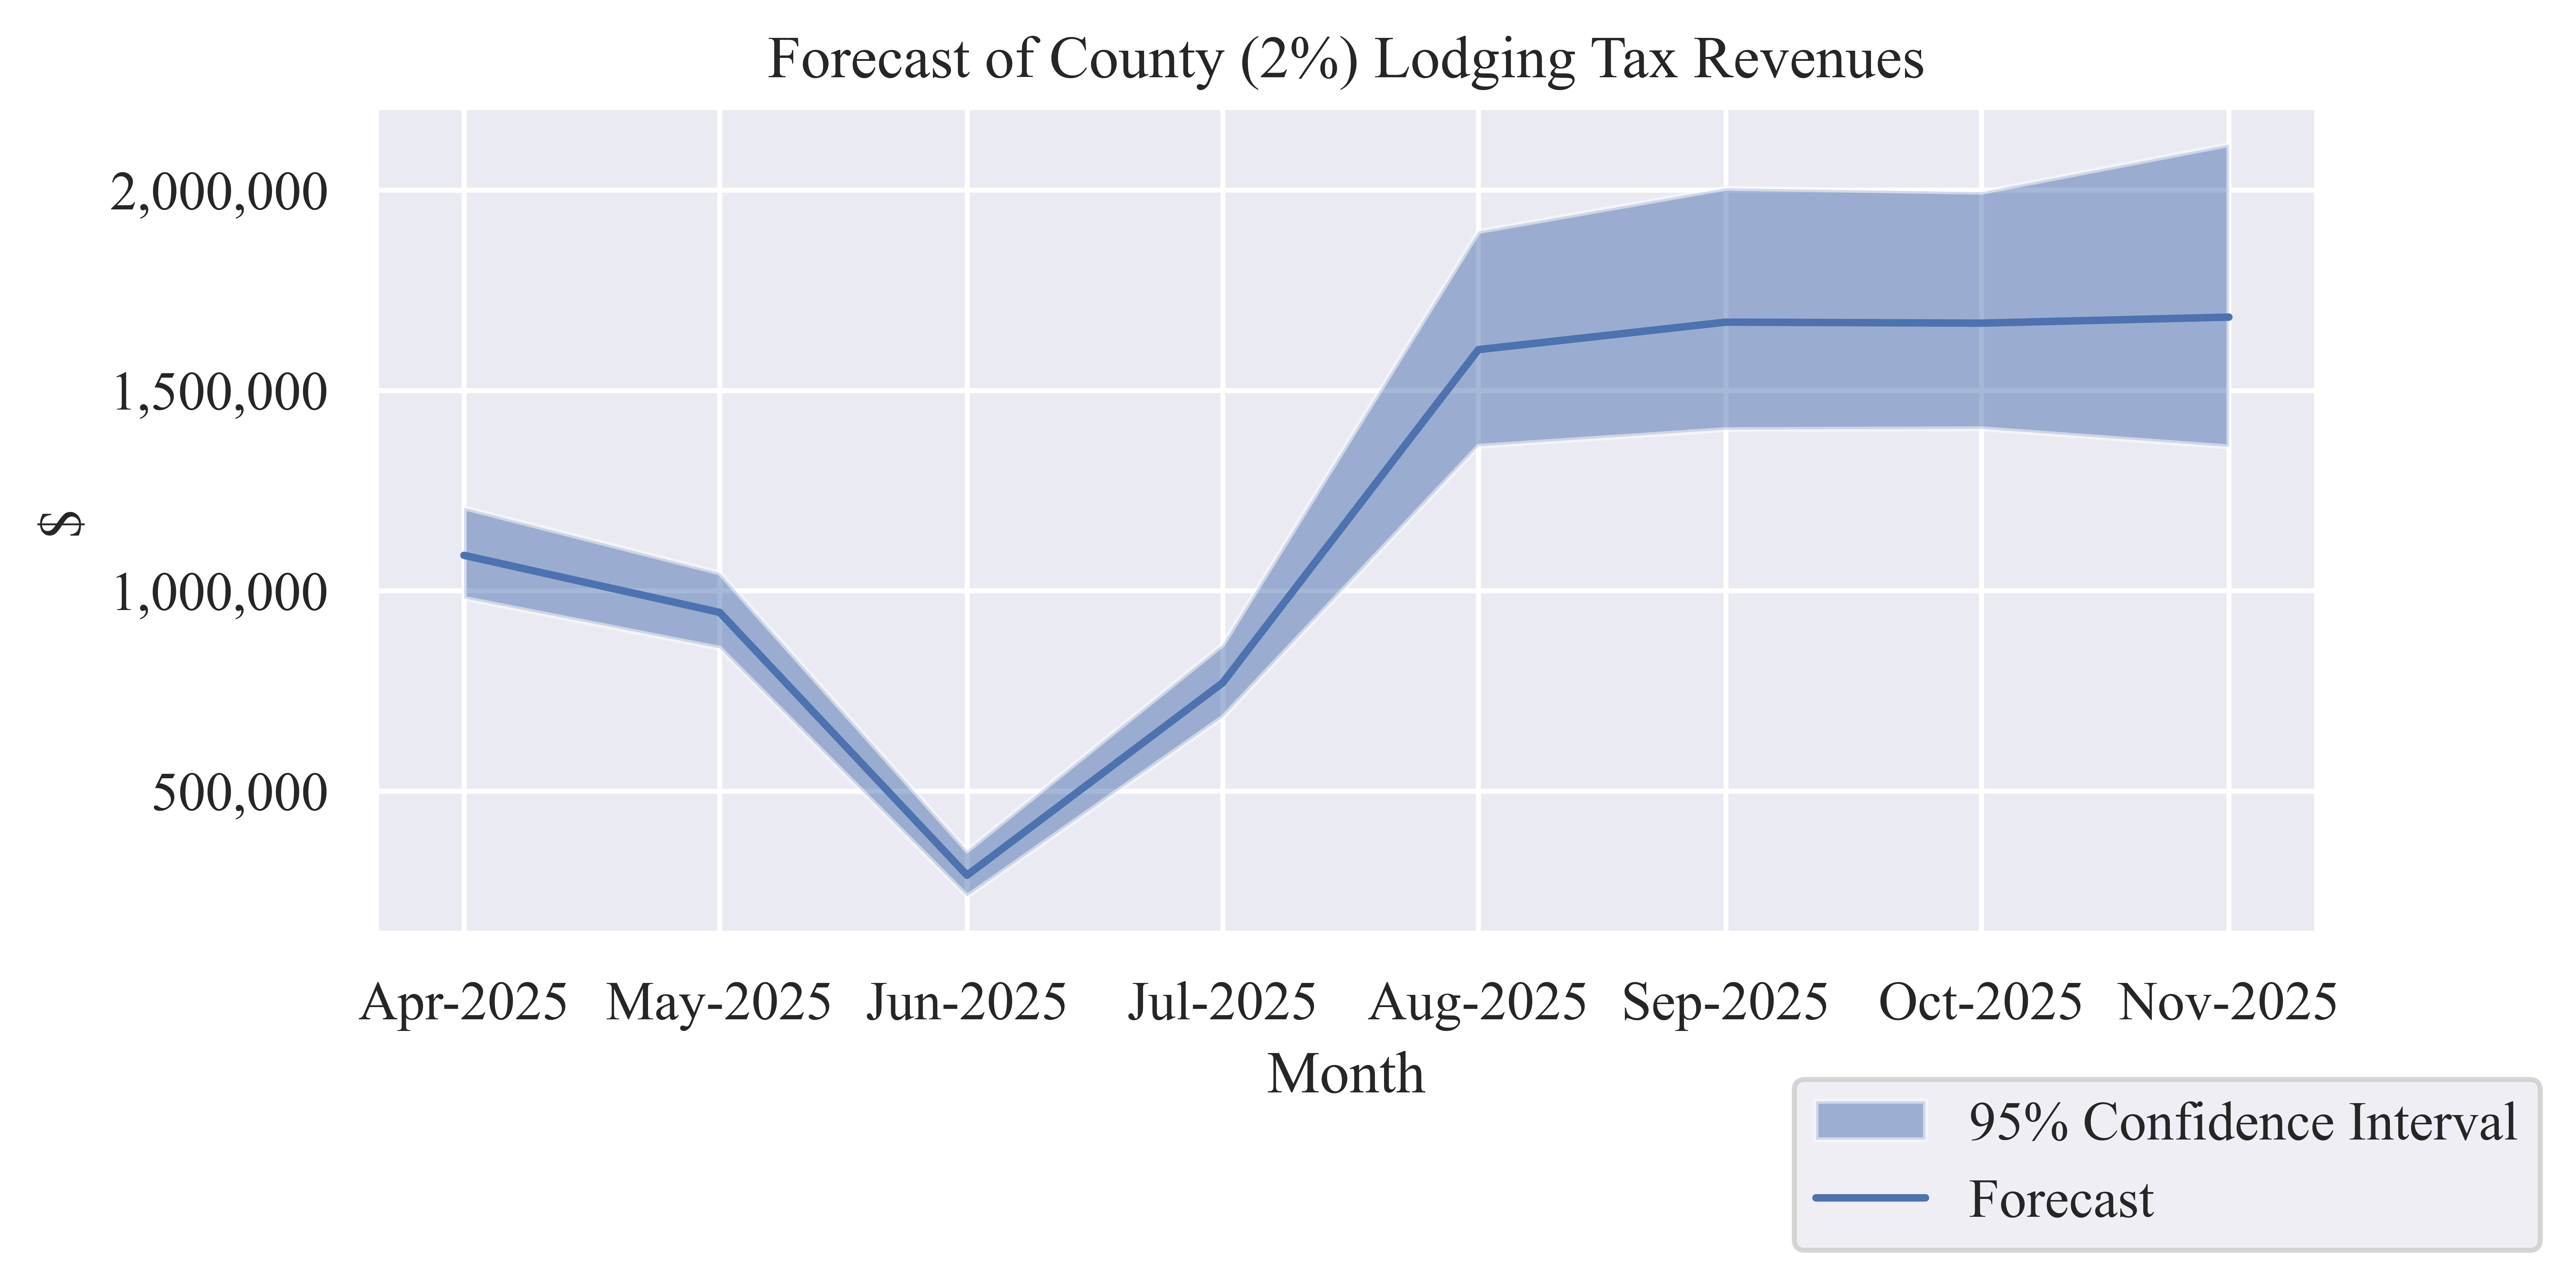
Tax Revenues
| Date | Tax Revenue Forecast | Lower CI Bound | Upper CI Bound |
|---|---|---|---|
| Apr-2025 | $1,088,275 | $981,127 | $1,207,124 |
| May-2025 | $945,883 | $856,478 | $1,044,620 |
| Jun-2025 | $289,627 | $237,301 | $351,079 |
| Jul-2025 | $770,126 | $684,586 | $866,025 |
| Aug-2025 | $1,601,722 | $1,360,705 | $1,896,879 |
| Sep-2025 | $1,670,331 | $1,402,325 | $2,005,089 |
| Oct-2025 | $1,667,822 | $1,404,418 | $1,995,066 |
| Nov-2025 | $1,682,850 | $1,359,350 | $2,113,781 |
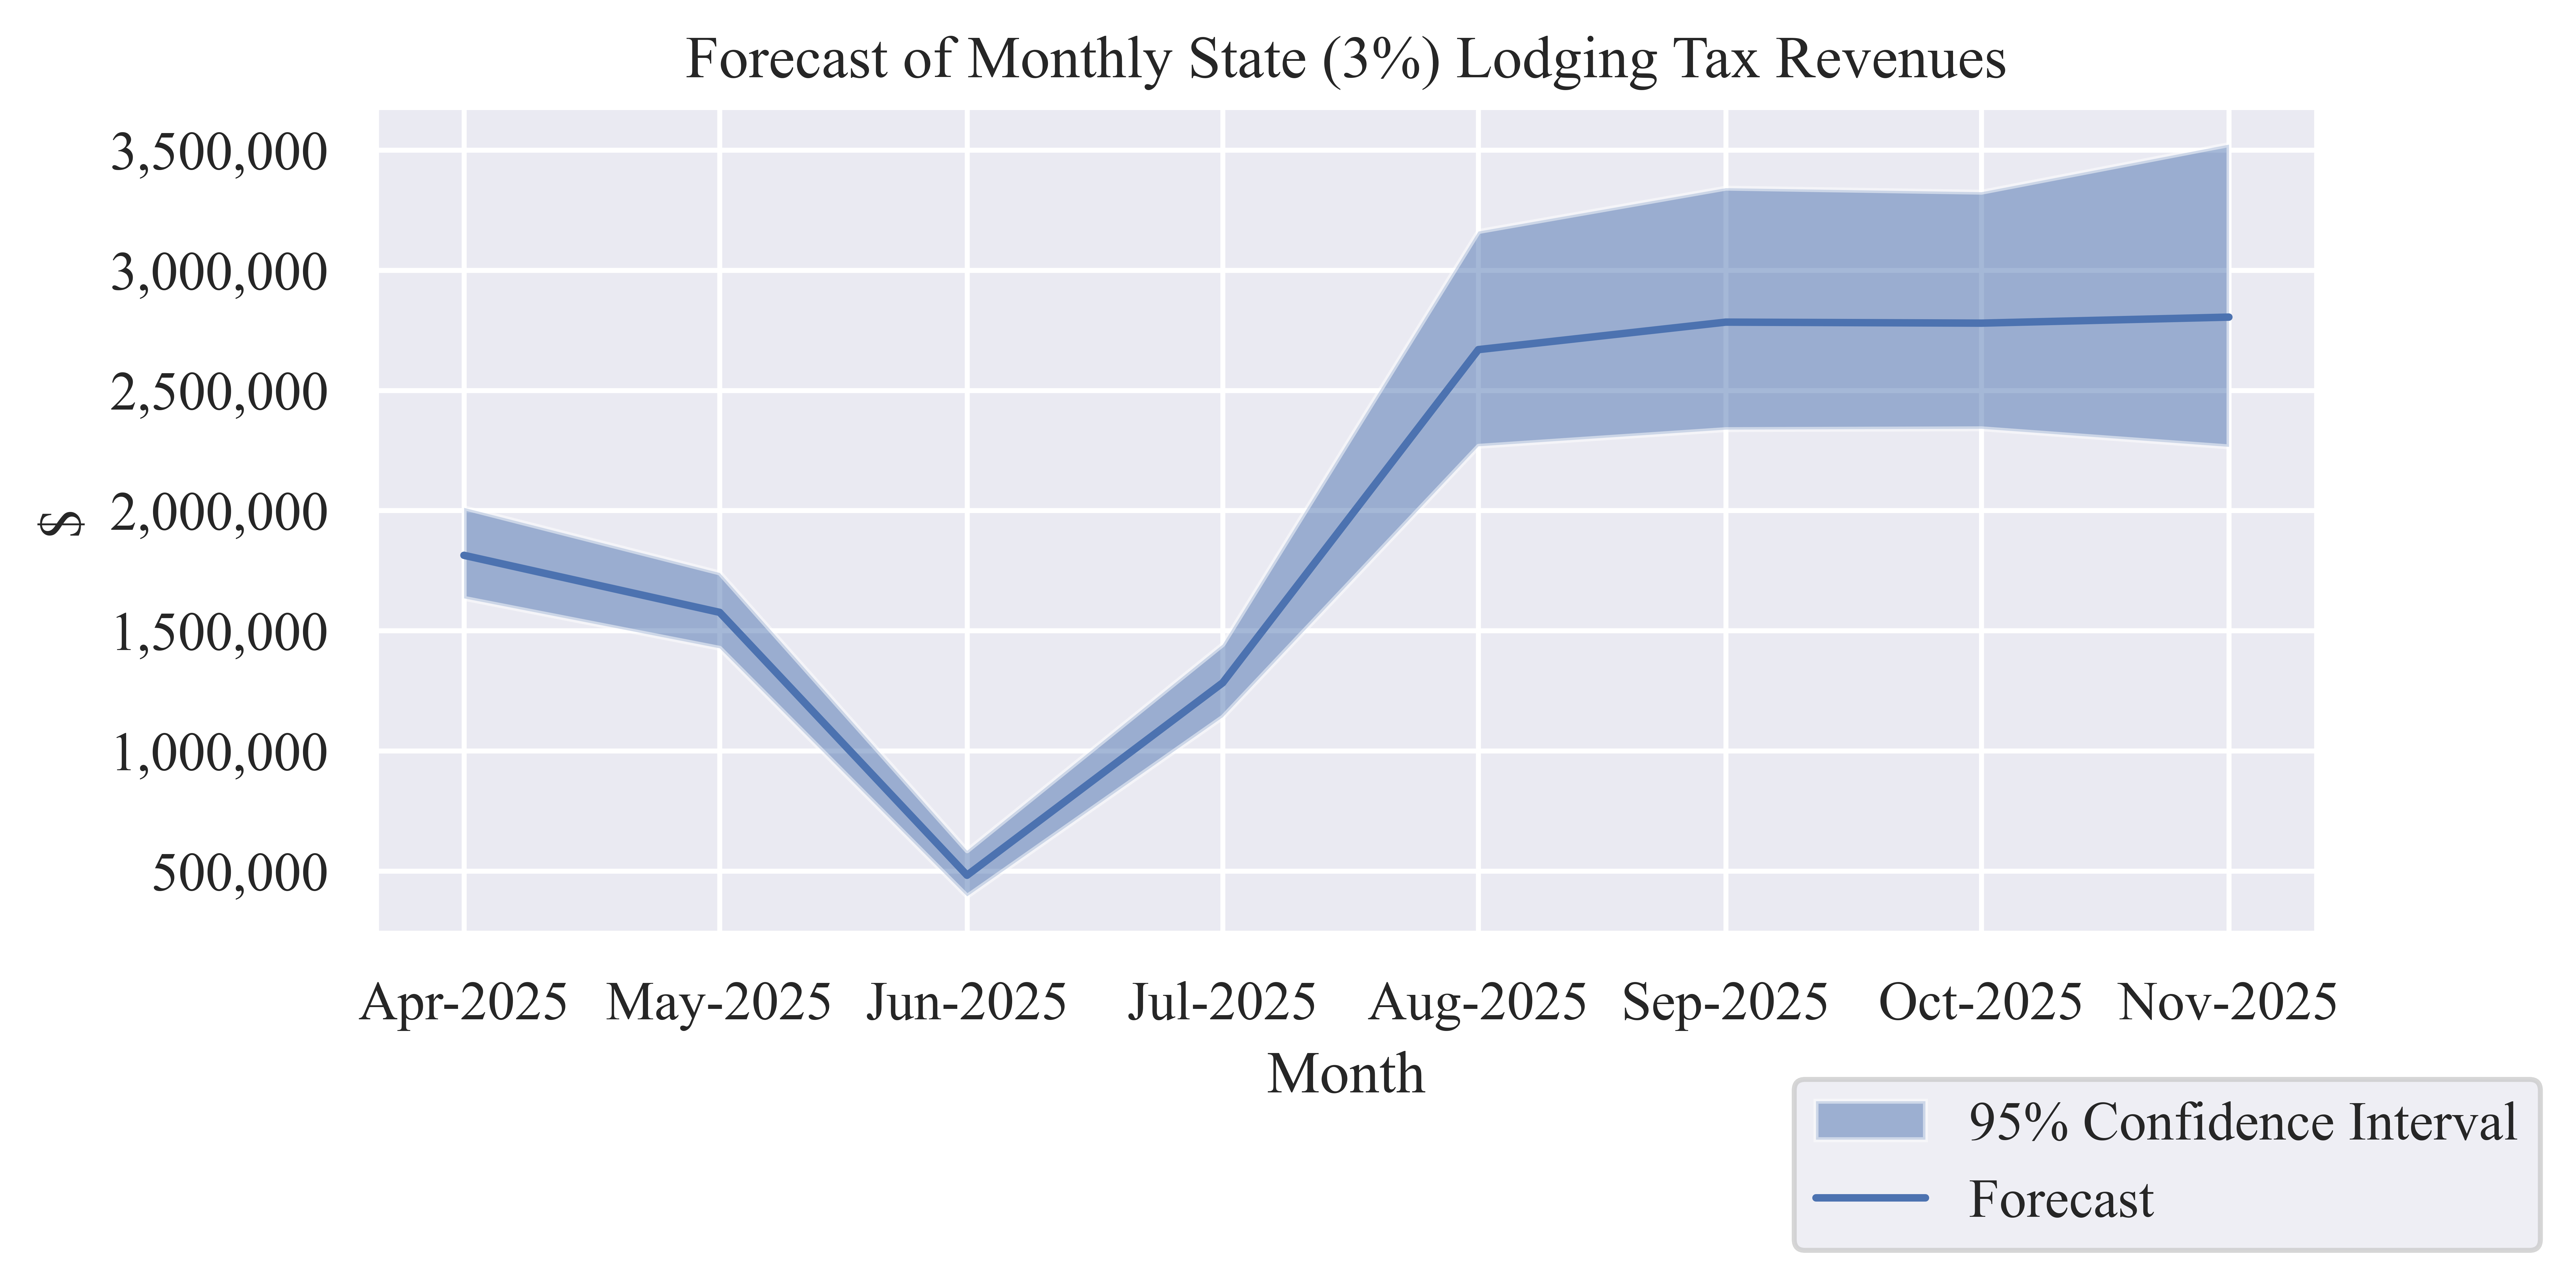
| Date | Tax Revenue Forecast | Lower CI Bound | Upper CI Bound |
|---|---|---|---|
| Apr-2025 | $1,813,792 | $1,635,212 | $2,011,874 |
| May-2025 | $1,576,471 | $1,427,464 | $1,741,033 |
| Jun-2025 | $482,711 | $395,501 | $585,131 |
| Jul-2025 | $1,283,543 | $1,140,977 | $1,443,375 |
| Aug-2025 | $2,669,537 | $2,267,842 | $3,161,465 |
| Sep-2025 | $2,783,885 | $2,337,208 | $3,341,814 |
| Oct-2025 | $2,779,703 | $2,340,696 | $3,325,110 |
| Nov-2025 | $2,804,751 | $2,265,584 | $3,522,969 |
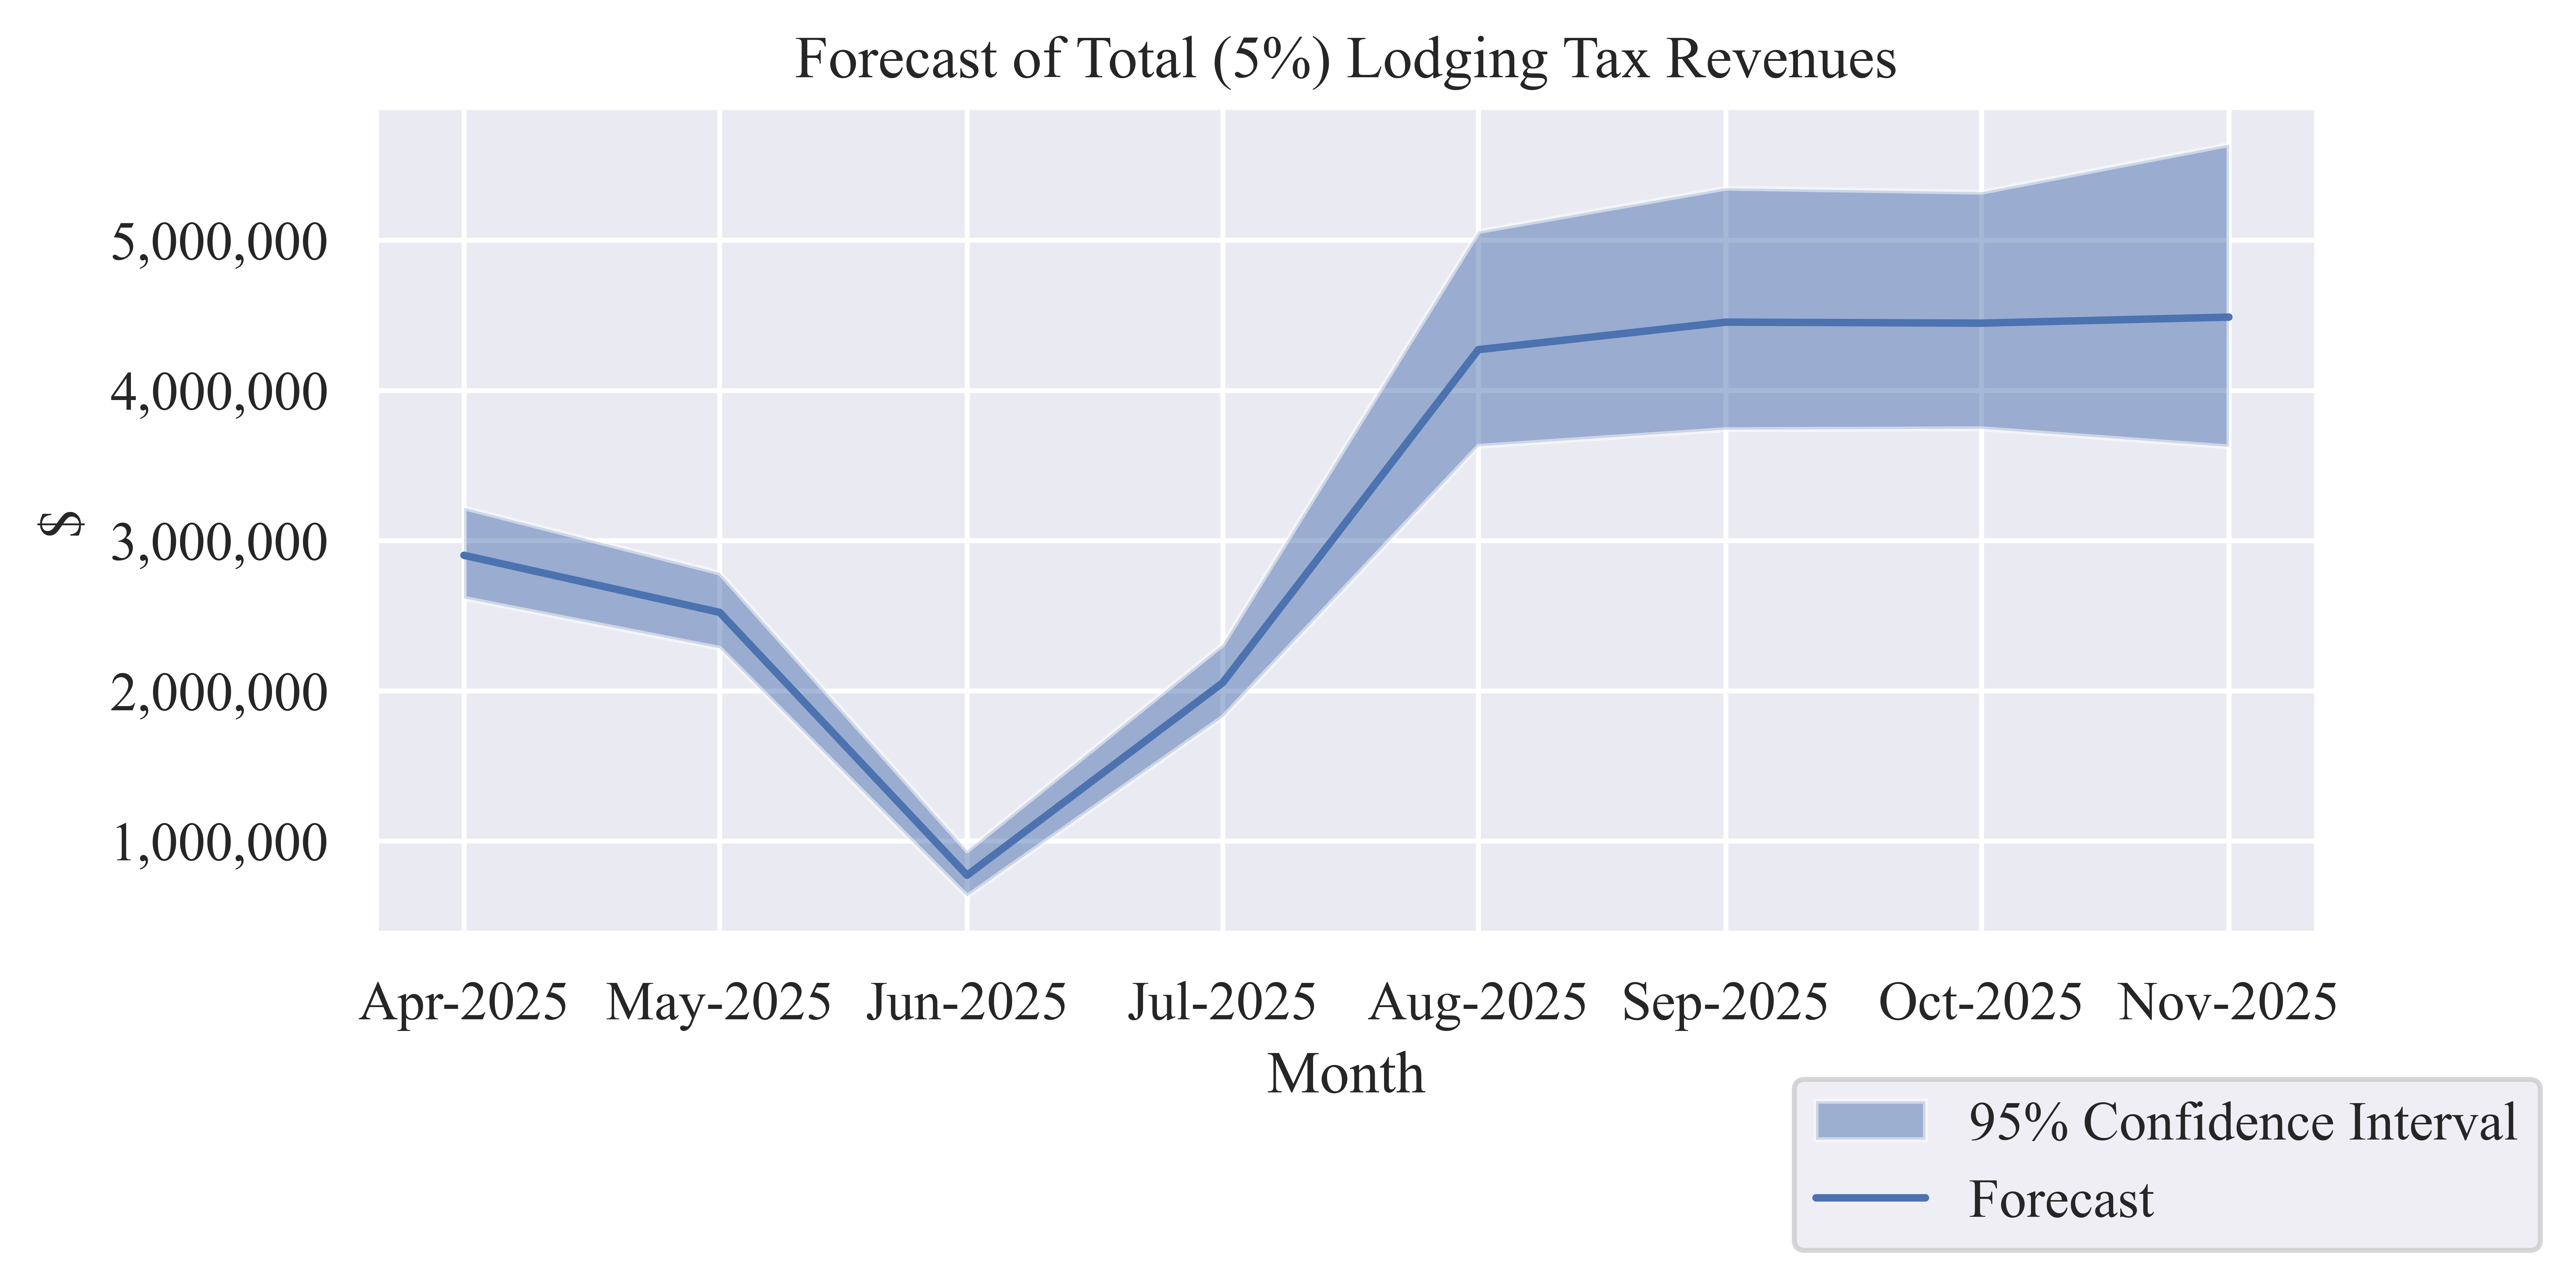
| Date | Tax Revenue Forecast | Lower CI Bound | Upper CI Bound |
|---|---|---|---|
| Apr-2025 | $2,902,067 | $2,616,339 | $3,218,998 |
| May-2025 | $2,522,354 | $2,283,942 | $2,785,652 |
| Jun-2025 | $772,337 | $632,802 | $936,210 |
| Jul-2025 | $2,053,668 | $1,825,563 | $2,309,400 |
| Aug-2025 | $4,271,260 | $3,628,547 | $5,058,344 |
| Sep-2025 | $4,454,216 | $3,739,533 | $5,346,903 |
| Oct-2025 | $4,447,525 | $3,745,114 | $5,320,176 |
| Nov-2025 | $4,487,601 | $3,624,934 | $5,636,750 |
Lodging Sector Sales
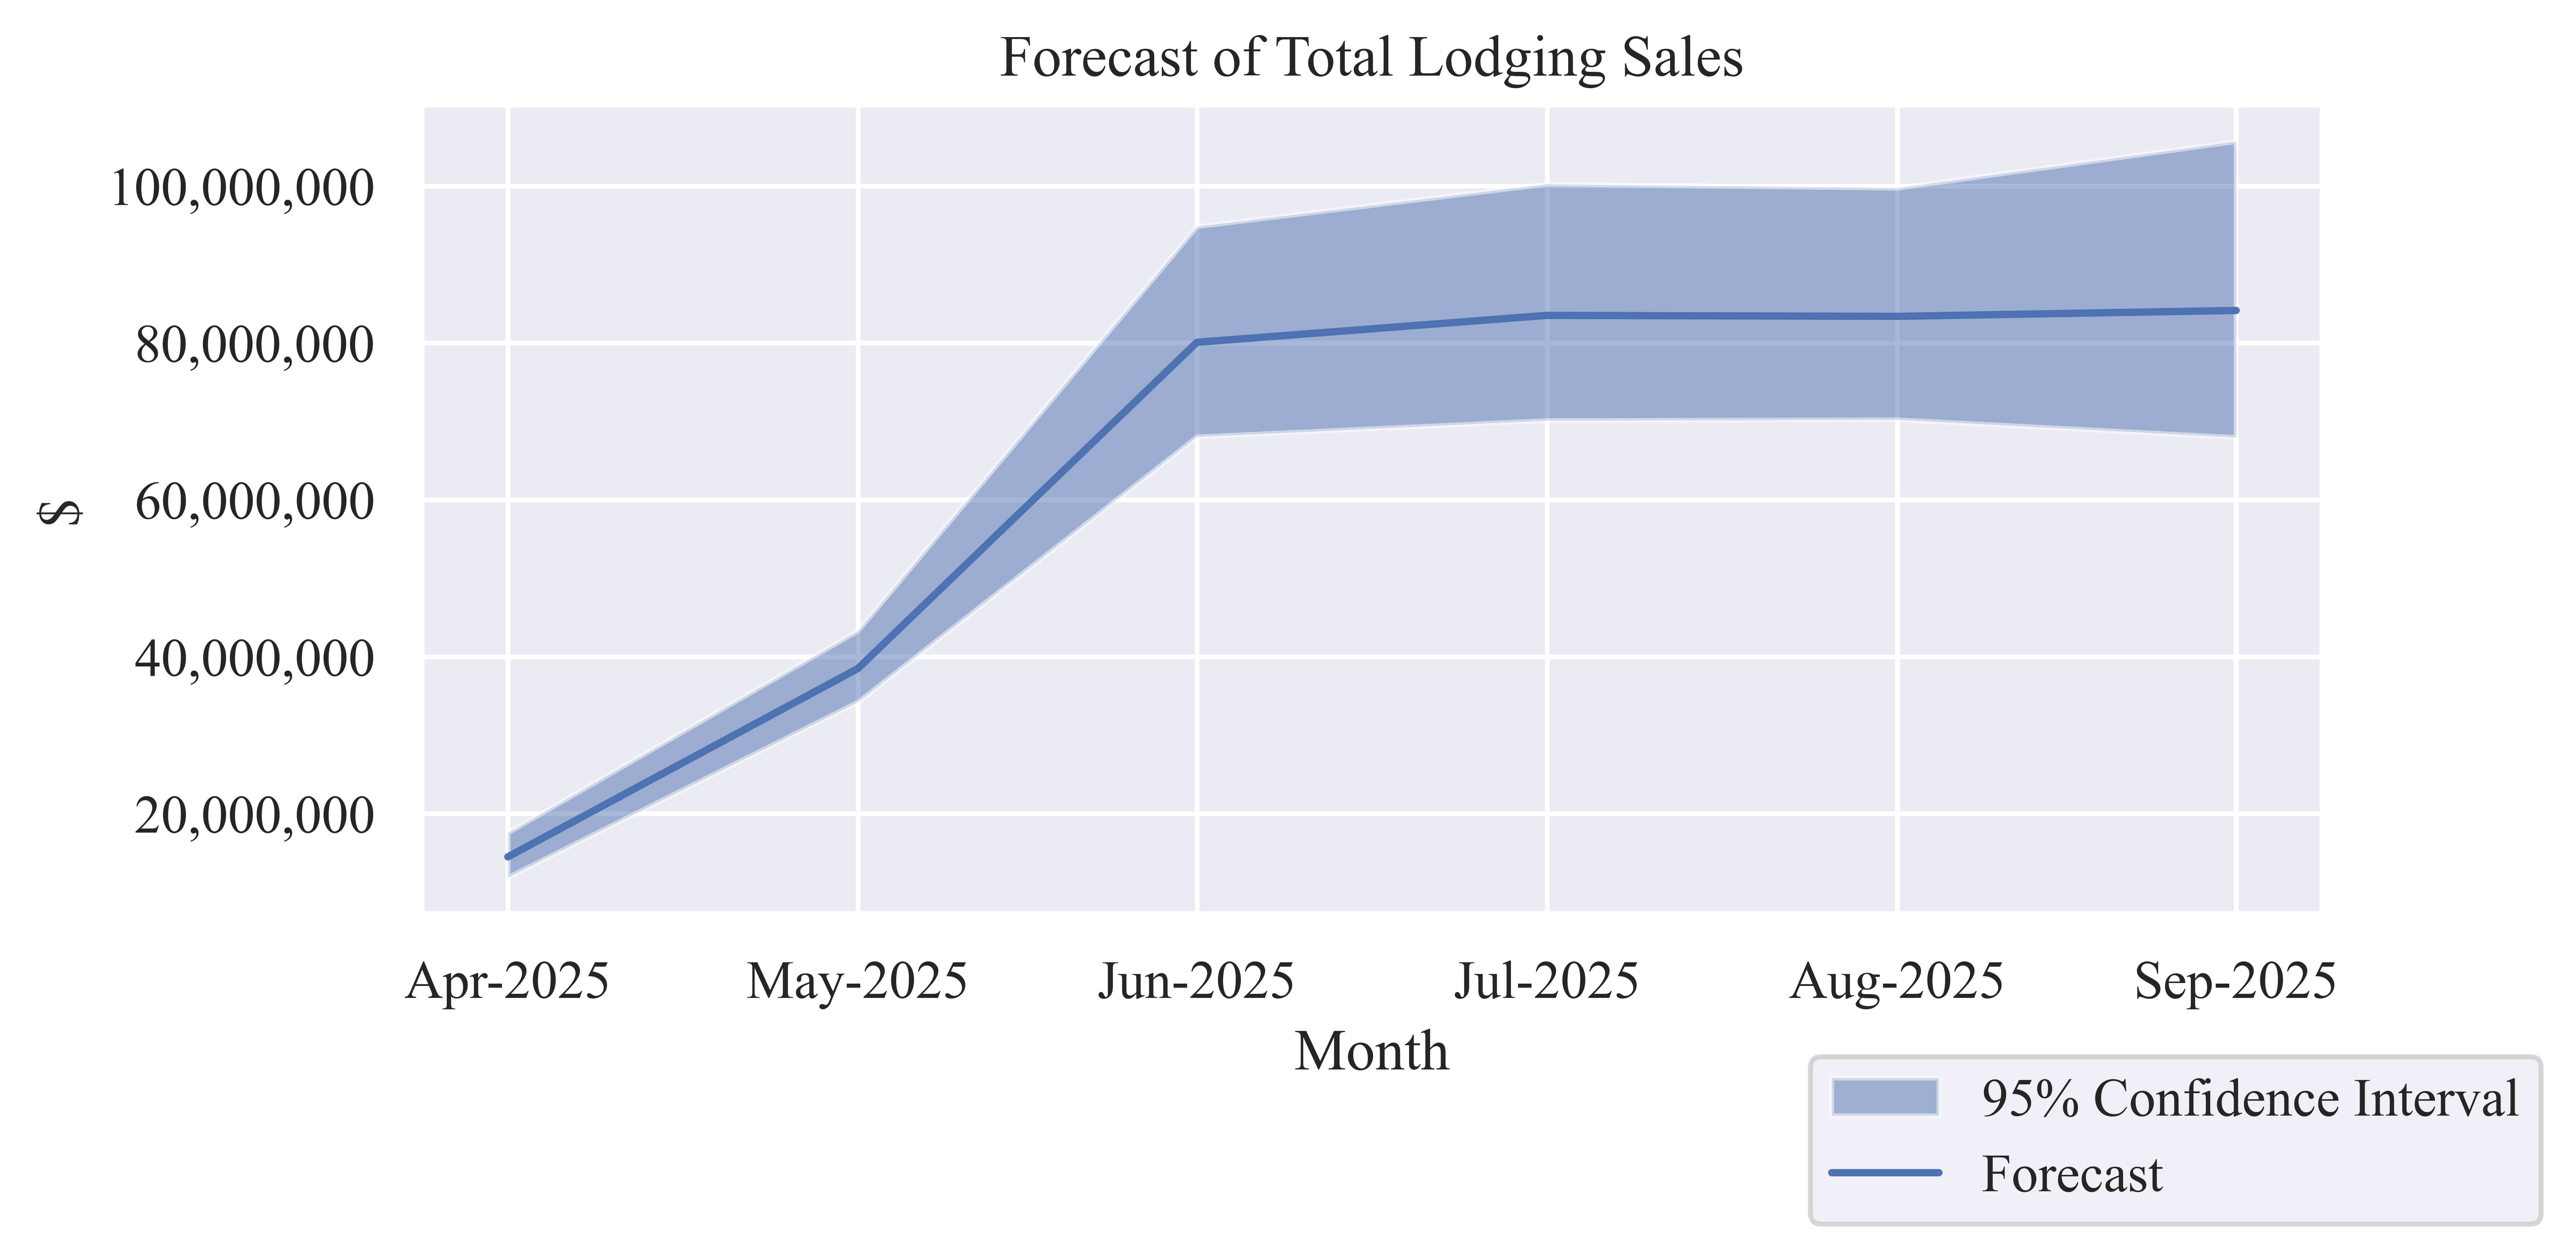
| Date | Lodging Sales Forecast | Lower CI Bound | Upper CI Bound |
|---|---|---|---|
| Apr-2025 | $14,481,325 | $11,865,044 | $17,553,945 |
| May-2025 | $38,506,277 | $34,229,314 | $43,301,245 |
| Jun-2025 | $80,086,123 | $68,035,255 | $94,843,942 |
| Jul-2025 | $83,516,541 | $70,116,236 | $100,254,427 |
| Aug-2025 | $83,391,100 | $70,220,891 | $99,753,300 |
| Sep-2025 | $84,142,521 | $67,967,511 | $105,689,068 |
Economic Indicators
| Estimate | Direct | Indirect | Induced | Total |
|---|---|---|---|---|
| Low Estimate | $322,434,252 | $69,048,422 | $17,491,464 | $408,974,138 |
| Median Estimate | $384,123,887 | $82,259,103 | $20,838,025 | $487,221,015 |
| High Estimate | $461,395,927 | $98,806,707 | $25,029,902 | $585,232,536 |
| Estimate | Direct | Indirect | Induced | Total |
|---|---|---|---|---|
| Low Estimate | $104,286,605 | $23,274,291 | $4,827,835 | $132,388,731 |
| Median Estimate | $124,239,208 | $27,727,241 | $5,751,523 | $157,717,972 |
| High Estimate | $149,231,710 | $33,304,975 | $6,908,527 | $189,445,211 |
| Estimate | Direct | Indirect | Induced | Total |
|---|---|---|---|---|
| Low Estimate | $233,263,577 | $40,596,719 | $10,545,958 | $284,406,255 |
| Median Estimate | $277,892,660 | $48,363,882 | $12,563,668 | $338,820,210 |
| High Estimate | $333,794,761 | $58,092,973 | $15,091,036 | $406,978,771 |
| Estimate | Direct | Indirect | Induced | Total |
|---|---|---|---|---|
| Low Estimate | 4,064 | 653 | 181 | 4,897 |
| Median Estimate | 4,841 | 777 | 215 | 5,834 |
| High Estimate | 5,815 | 934 | 259 | 7,008 |

