Jackson Hole Economic Forecasting
May 2025 Forecast
Occupancy Rate (OR)
Table 1: Forecast of Monthly Occupancy Rate
| Jun-2025 |
82.81% |
81.78% |
83.80% |
| Jul-2025 |
81.48% |
79.51% |
83.30% |
| Aug-2025 |
81.36% |
79.85% |
82.78% |
| Sep-2025 |
81.77% |
79.67% |
83.70% |
| Oct-2025 |
56.39% |
52.91% |
59.80% |
| Nov-2025 |
21.48% |
17.30% |
26.36% |
Average Daily Rate (ADR)
Table 2: Forecast of Monthly Average Daily Rate
| Jun-2025 |
$529.89 |
$510.15 |
$549.63 |
| Jul-2025 |
$592.87 |
$554.59 |
$631.14 |
| Aug-2025 |
$532.15 |
$497.33 |
$566.97 |
| Sep-2025 |
$476.05 |
$448.24 |
$503.86 |
| Oct-2025 |
$318.66 |
$284.08 |
$353.24 |
| Nov-2025 |
$247.82 |
$218.34 |
$277.31 |
Revenue per Available Room (RevPAR)
Table 3: Forecast of Monthly RevPAR
| Jun-2025 |
$438.82 |
$417.18 |
$460.60 |
| Jul-2025 |
$483.06 |
$440.95 |
$525.73 |
| Aug-2025 |
$432.95 |
$397.11 |
$469.35 |
| Sep-2025 |
$389.28 |
$357.10 |
$421.75 |
| Oct-2025 |
$179.68 |
$150.31 |
$211.24 |
| Nov-2025 |
$53.24 |
$37.76 |
$73.10 |
Tax Revenues
Table 4: Forecast County (2%) Lodging Tax Revenue
| Jun-2025 |
$263,938 |
$222,351 |
$313,305 |
| Jul-2025 |
$726,838 |
$652,788 |
$809,287 |
| Aug-2025 |
$1,541,132 |
$1,283,287 |
$1,863,966 |
| Sep-2025 |
$1,737,829 |
$1,405,470 |
$2,173,732 |
| Oct-2025 |
$1,684,625 |
$1,359,948 |
$2,112,782 |
| Nov-2025 |
$1,436,360 |
$1,173,469 |
$1,778,427 |
| Dec-2025 |
$752,575 |
$614,302 |
$923,269 |
| Jan-2026 |
$234,906 |
$160,026 |
$331,693 |
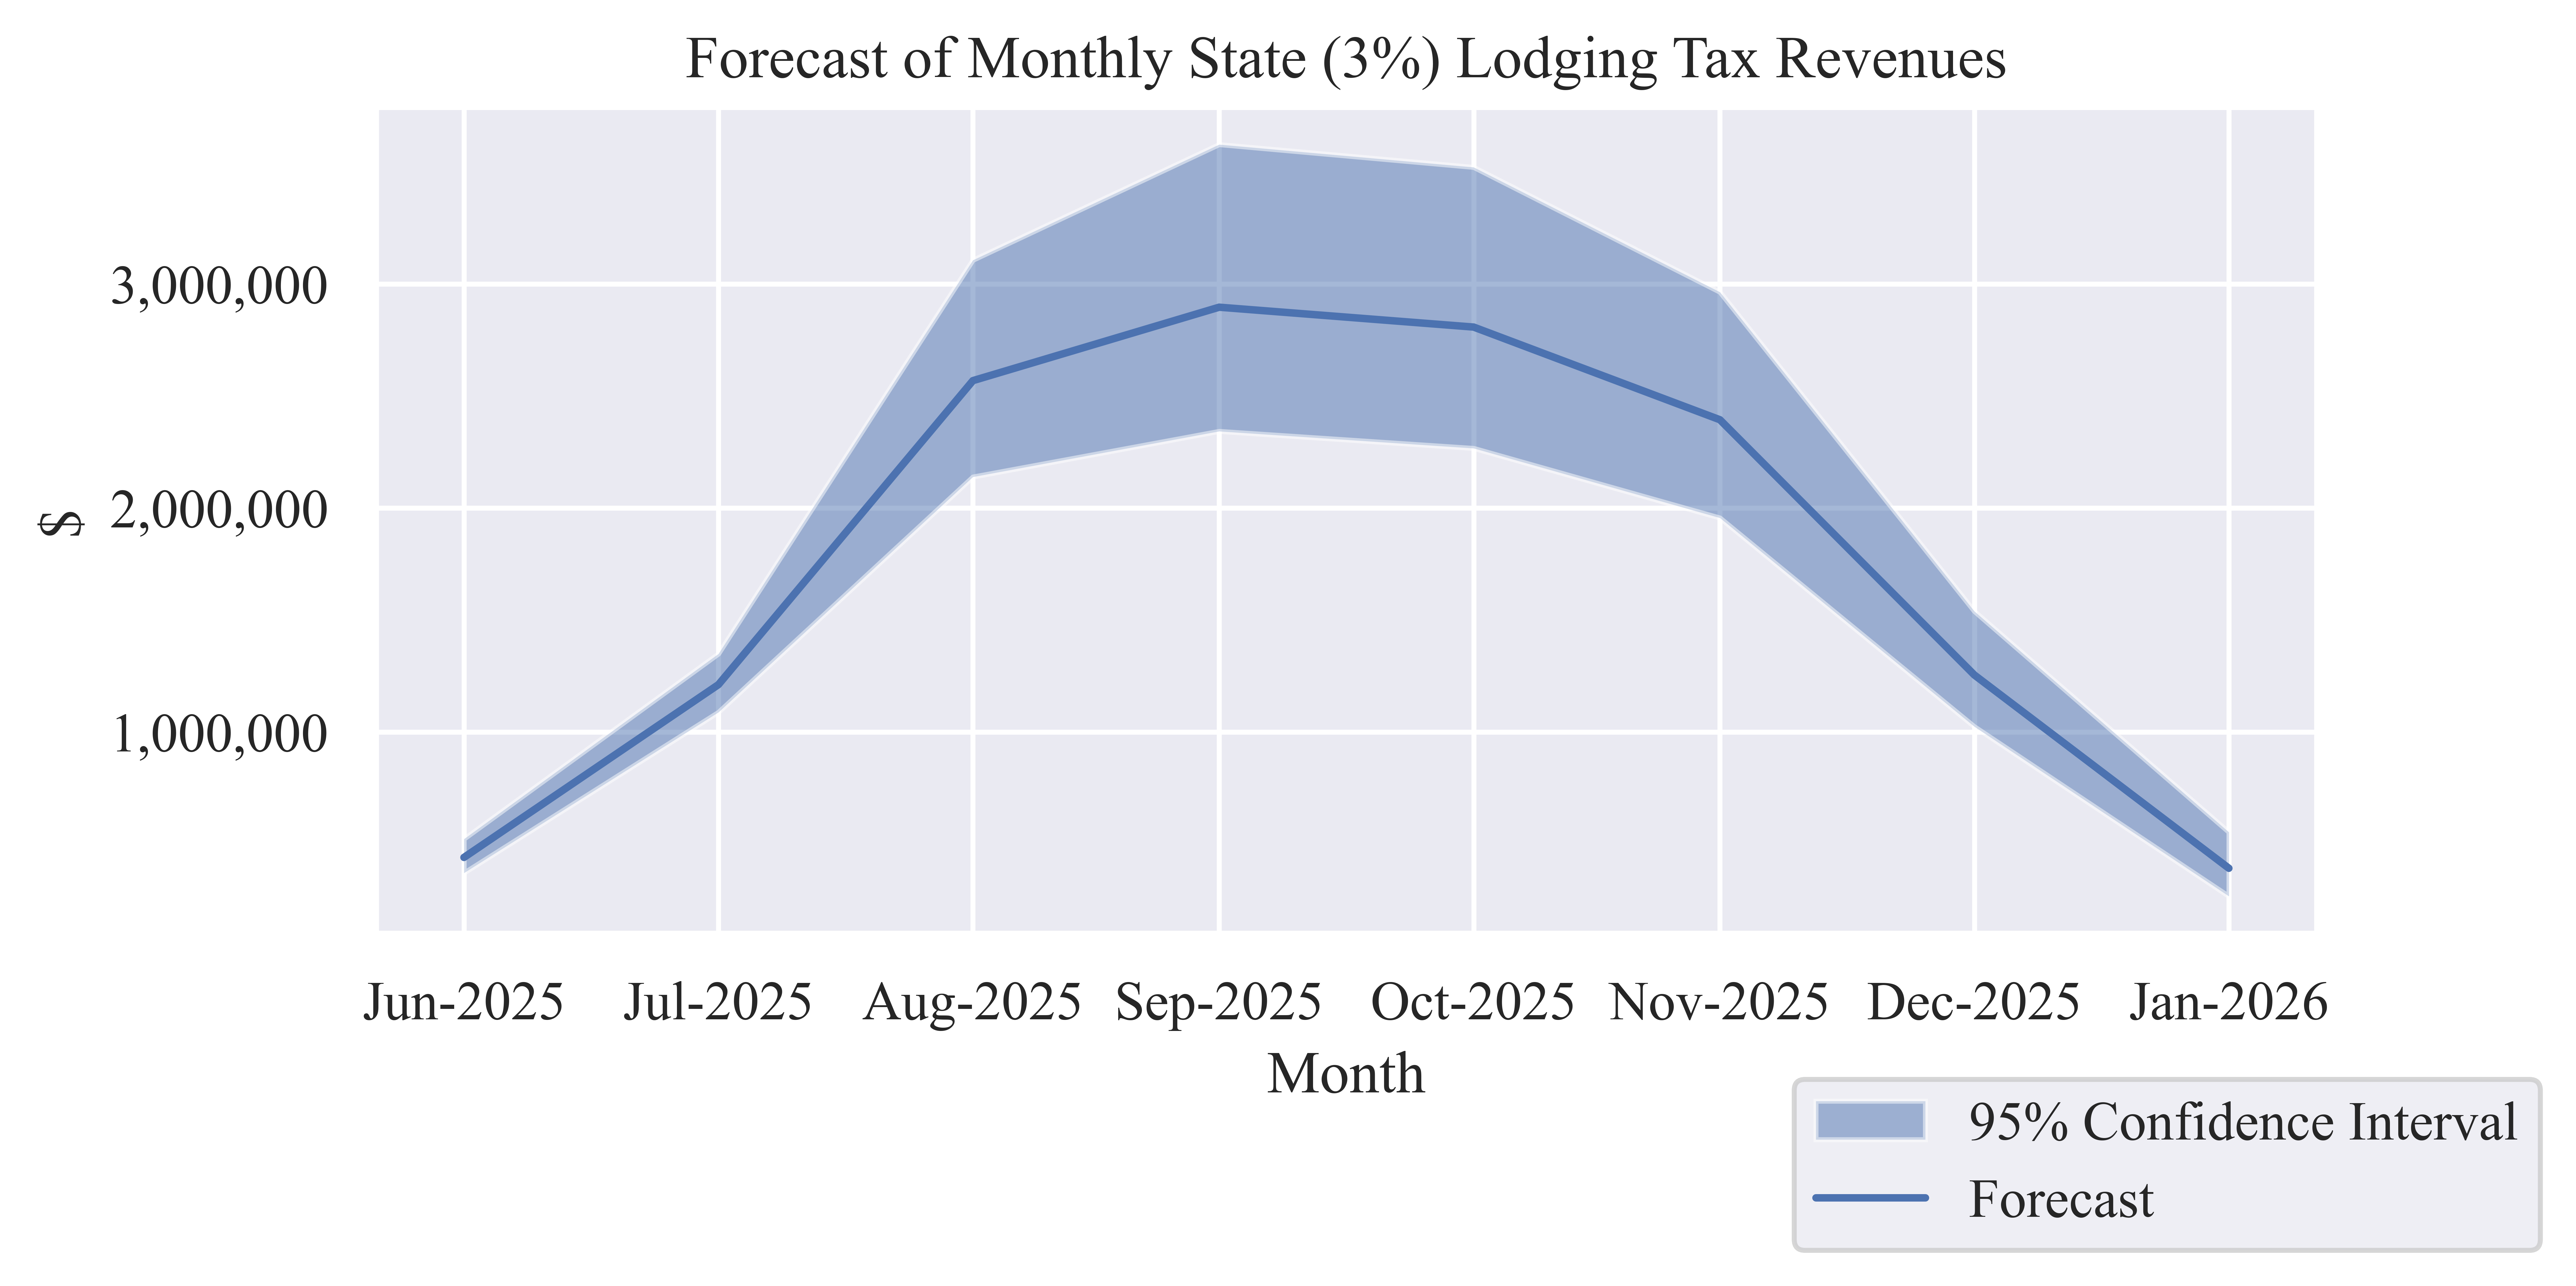
Table 5: Forecast State (3%) Lodging Tax Revenue
| Jun-2025 |
$439,897 |
$370,584 |
$522,175 |
| Jul-2025 |
$1,211,396 |
$1,087,979 |
$1,348,812 |
| Aug-2025 |
$2,568,554 |
$2,138,812 |
$3,106,610 |
| Sep-2025 |
$2,896,382 |
$2,342,451 |
$3,622,886 |
| Oct-2025 |
$2,807,708 |
$2,266,580 |
$3,521,304 |
| Nov-2025 |
$2,393,933 |
$1,955,782 |
$2,964,045 |
| Dec-2025 |
$1,254,292 |
$1,023,836 |
$1,538,782 |
| Jan-2026 |
$391,509 |
$266,709 |
$552,822 |
Table 6: Forecast of Monthly Total (5%) Lodging Tax Revenue
| Jun-2025 |
$703,836 |
$592,935 |
$835,479 |
| Jul-2025 |
$1,938,233 |
$1,740,767 |
$2,158,100 |
| Aug-2025 |
$4,109,686 |
$3,422,099 |
$4,970,576 |
| Sep-2025 |
$4,634,211 |
$3,747,921 |
$5,796,617 |
| Oct-2025 |
$4,492,332 |
$3,626,528 |
$5,634,086 |
| Nov-2025 |
$3,830,293 |
$3,129,251 |
$4,742,472 |
| Dec-2025 |
$2,006,868 |
$1,638,138 |
$2,462,052 |
| Jan-2026 |
$626,415 |
$426,735 |
$884,515 |
Lodging Sector Sales
Table 7: Forecast of Monthly Lodging Sales
| Jun-2025 |
$77,056,615 |
$64,164,363 |
$93,198,300 |
| Jul-2025 |
$86,891,449 |
$70,273,523 |
$108,686,575 |
| Aug-2025 |
$84,231,231 |
$67,997,409 |
$105,639,118 |
| Sep-2025 |
$71,817,996 |
$58,673,460 |
$88,921,350 |
| Oct-2025 |
$37,628,775 |
$30,715,082 |
$46,163,468 |
| Nov-2025 |
$11,745,278 |
$8,001,278 |
$16,584,655 |
Economic Indicators
Table 8: Six-Month Forecast of Economic Output from Lodging Sales
| Low Estimate |
$329,807,332 |
$70,627,347 |
$17,891,439 |
$418,326,119 |
| Median Estimate |
$398,632,853 |
$85,366,159 |
$21,625,110 |
$505,624,122 |
| High Estimate |
$485,686,697 |
$104,008,510 |
$26,347,633 |
$616,042,841 |
Table 9: Six-Month Forecast of Employee Compensation from Lodging Sales
| Low Estimate |
$106,671,319 |
$23,806,502 |
$4,938,233 |
$135,416,054 |
| Median Estimate |
$128,931,919 |
$28,774,543 |
$5,968,767 |
$163,675,228 |
| High Estimate |
$157,088,201 |
$35,058,357 |
$7,272,235 |
$199,418,793 |
Table 10: Six-Month Forecast of Contribution to Gross County Product from Lodging
Sales
| Low Estimate |
$238,597,598 |
$41,525,041 |
$10,787,112 |
$290,909,751 |
| Median Estimate |
$288,389,104 |
$50,190,662 |
$13,038,218 |
$351,617,984 |
| High Estimate |
$351,367,807 |
$61,151,351 |
$15,885,523 |
$428,404,681 |
Table 11: Six-Month Forecast of Employment from Lodging Sales
| Low Estimate |
4,157 |
667 |
185 |
5,009 |
| Median Estimate |
5,024 |
807 |
224 |
6,055 |
| High Estimate |
6,121 |
983 |
272 |
7,377 |


