Jackson Hole Economic Forecasting
January 2025 Forecast
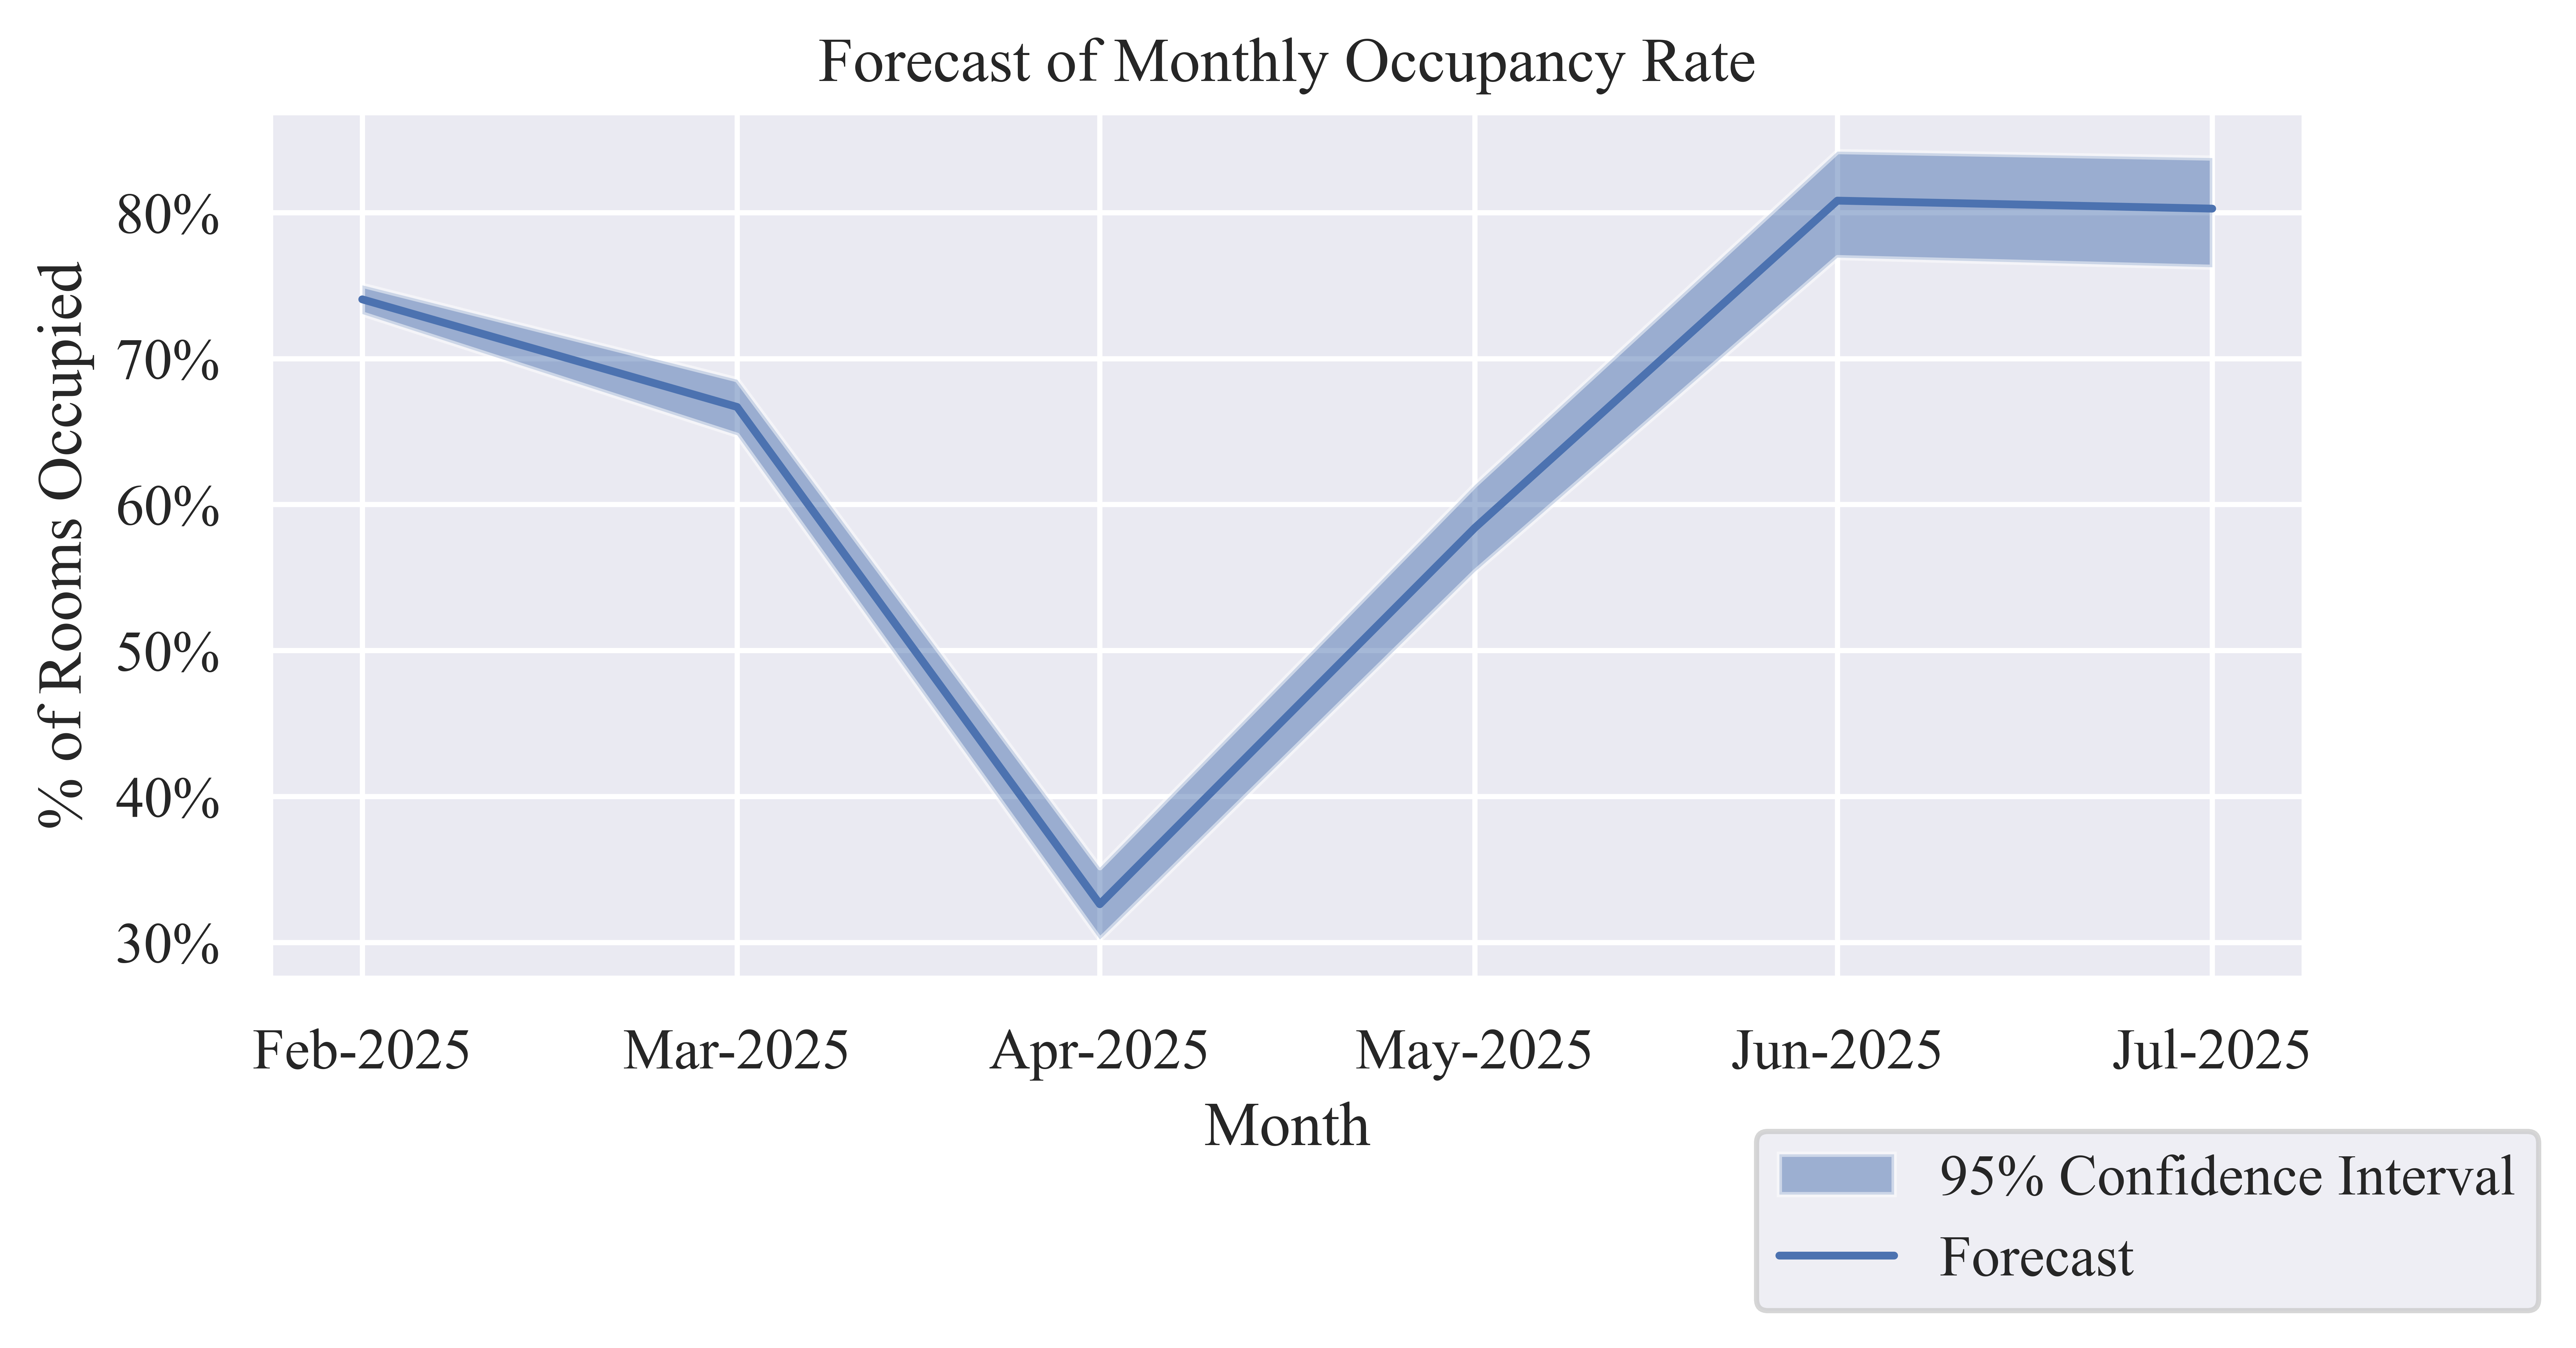
Occupancy Rate (OR)
Table 1: Forecast of Monthly Occupancy Rate
| Feb-2025 |
74.06% |
73.06% |
75.03% |
| Mar-2025 |
66.68% |
64.75% |
68.56% |
| Apr-2025 |
32.61% |
30.20% |
35.12% |
| May-2025 |
58.39% |
55.39% |
61.33% |
| Jun-2025 |
80.82% |
76.93% |
84.19% |
| Jul-2025 |
80.27% |
76.26% |
83.75% |
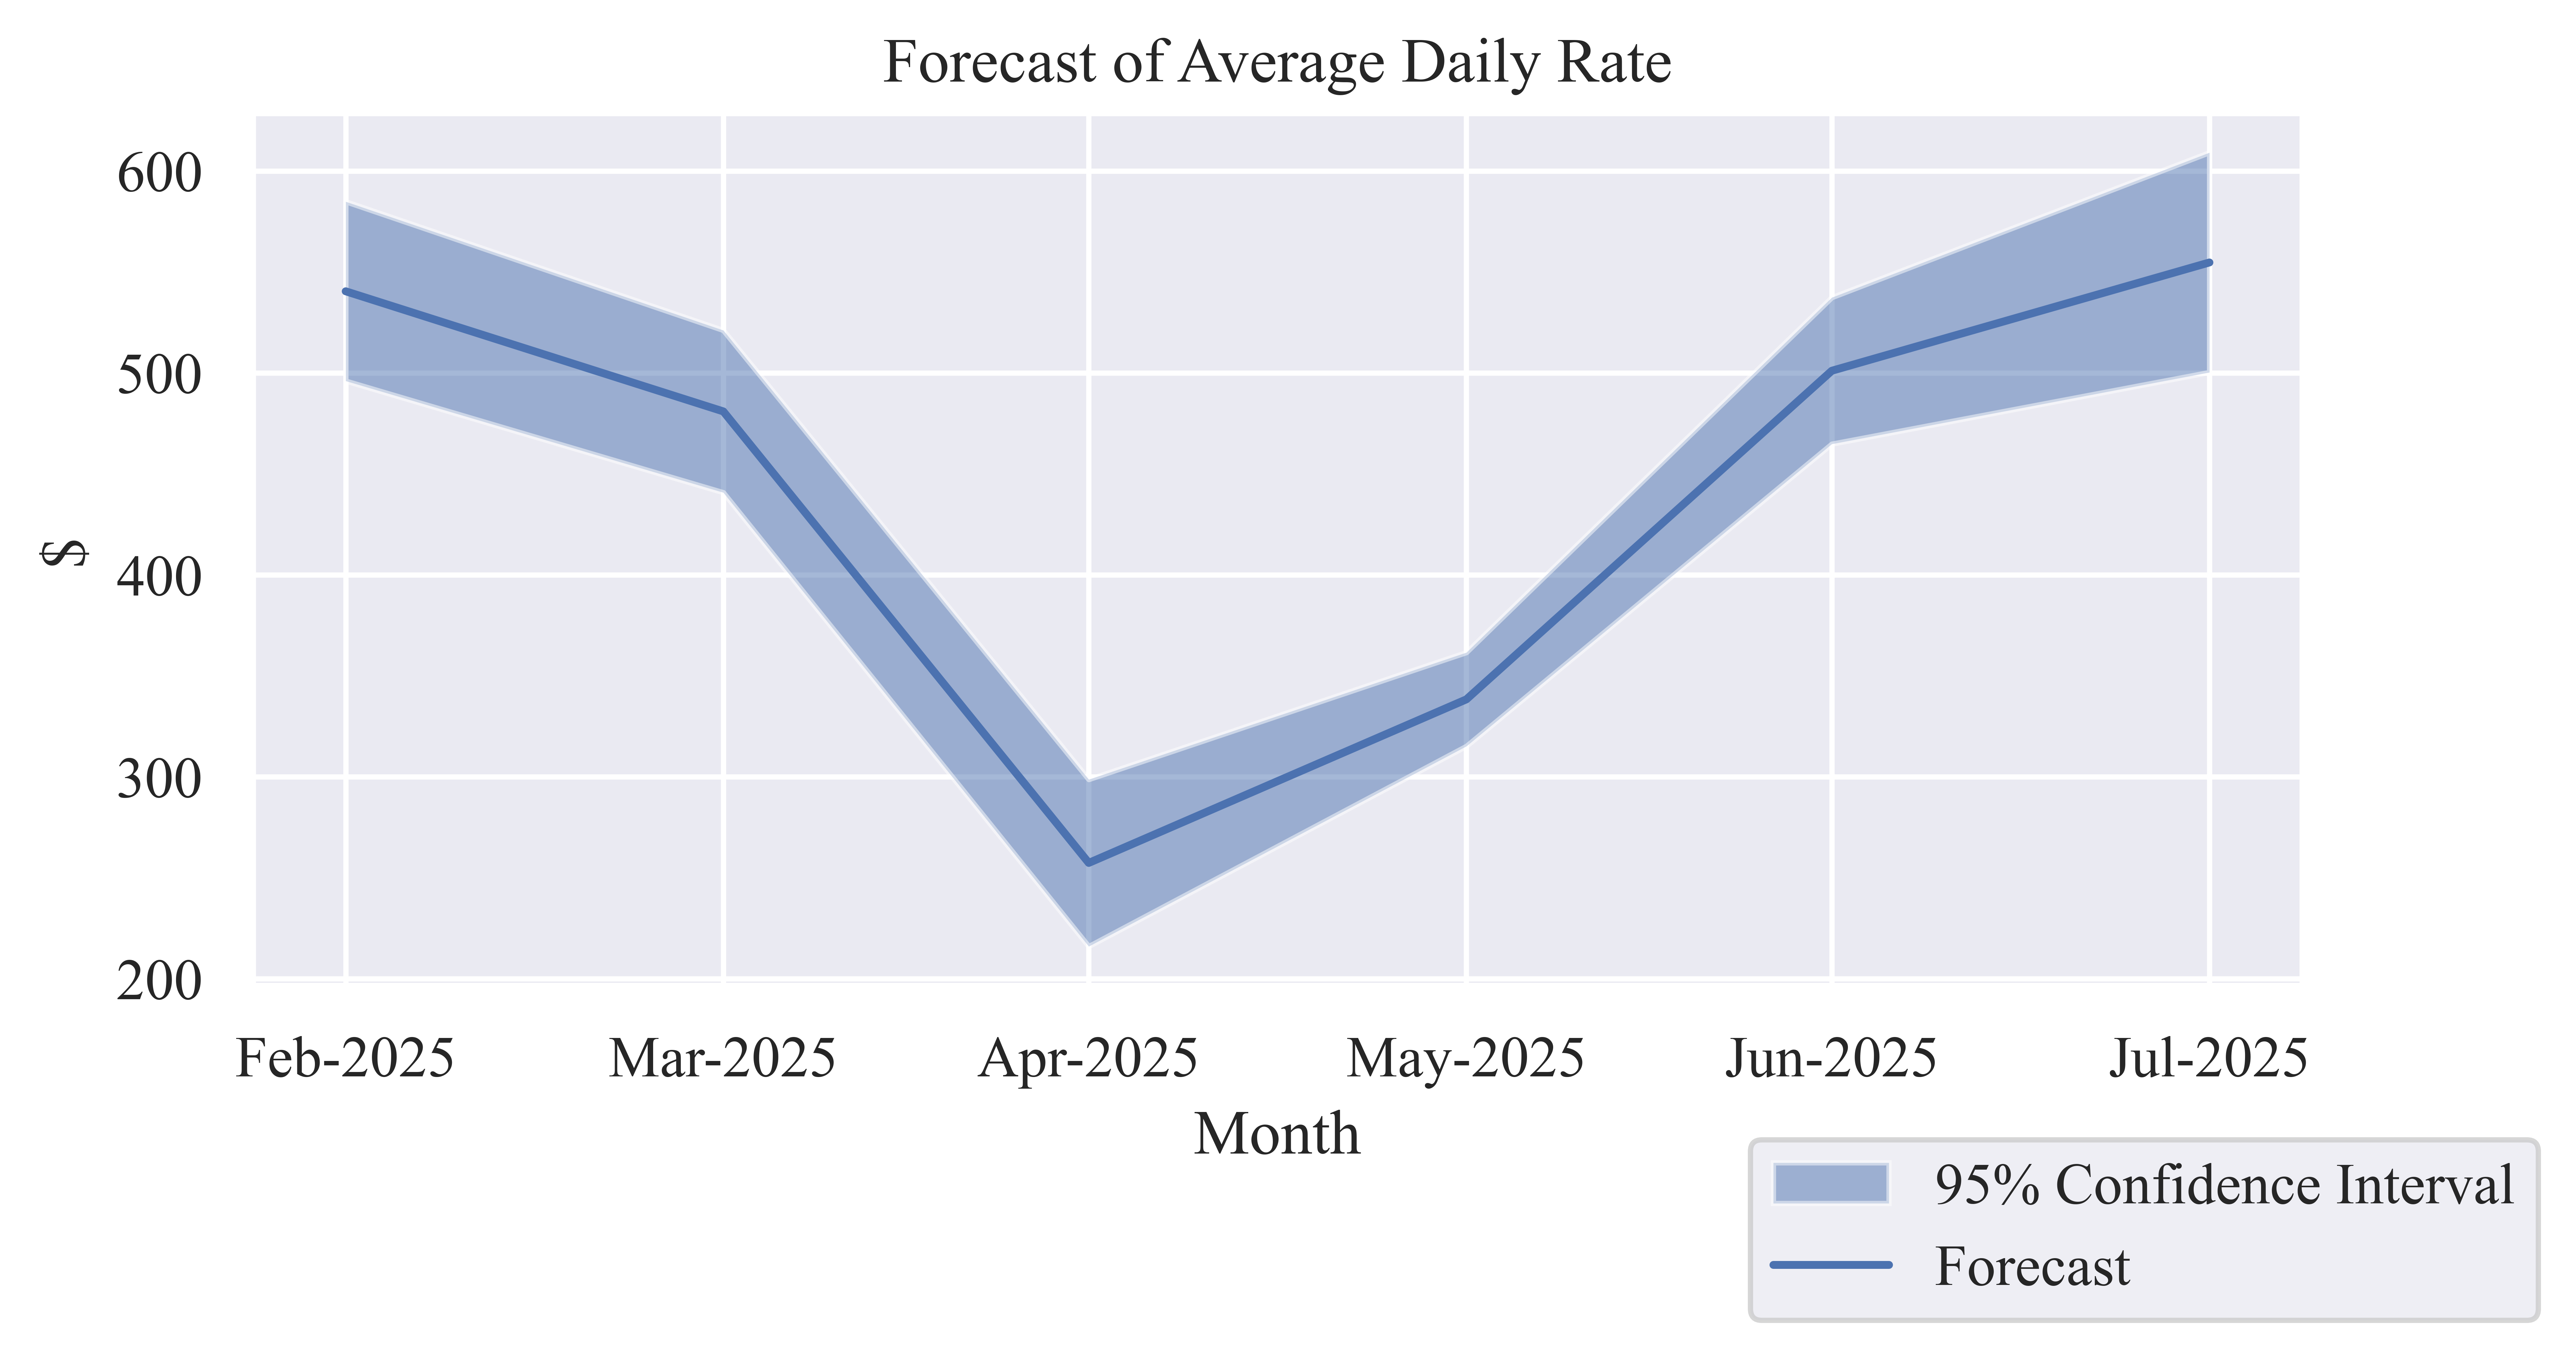
Average Daily Rate (ADR)
Table 2: Forecast of Monthly Average Daily Rate
| Feb-2025 |
$540.41 |
$496.02 |
$584.81 |
| Mar-2025 |
$480.94 |
$440.77 |
$521.10 |
| Apr-2025 |
$257.38 |
$216.04 |
$298.71 |
| May-2025 |
$338.36 |
$315.15 |
$361.56 |
| Jun-2025 |
$501.07 |
$464.80 |
$537.34 |
| Jul-2025 |
$554.68 |
$500.27 |
$609.10 |
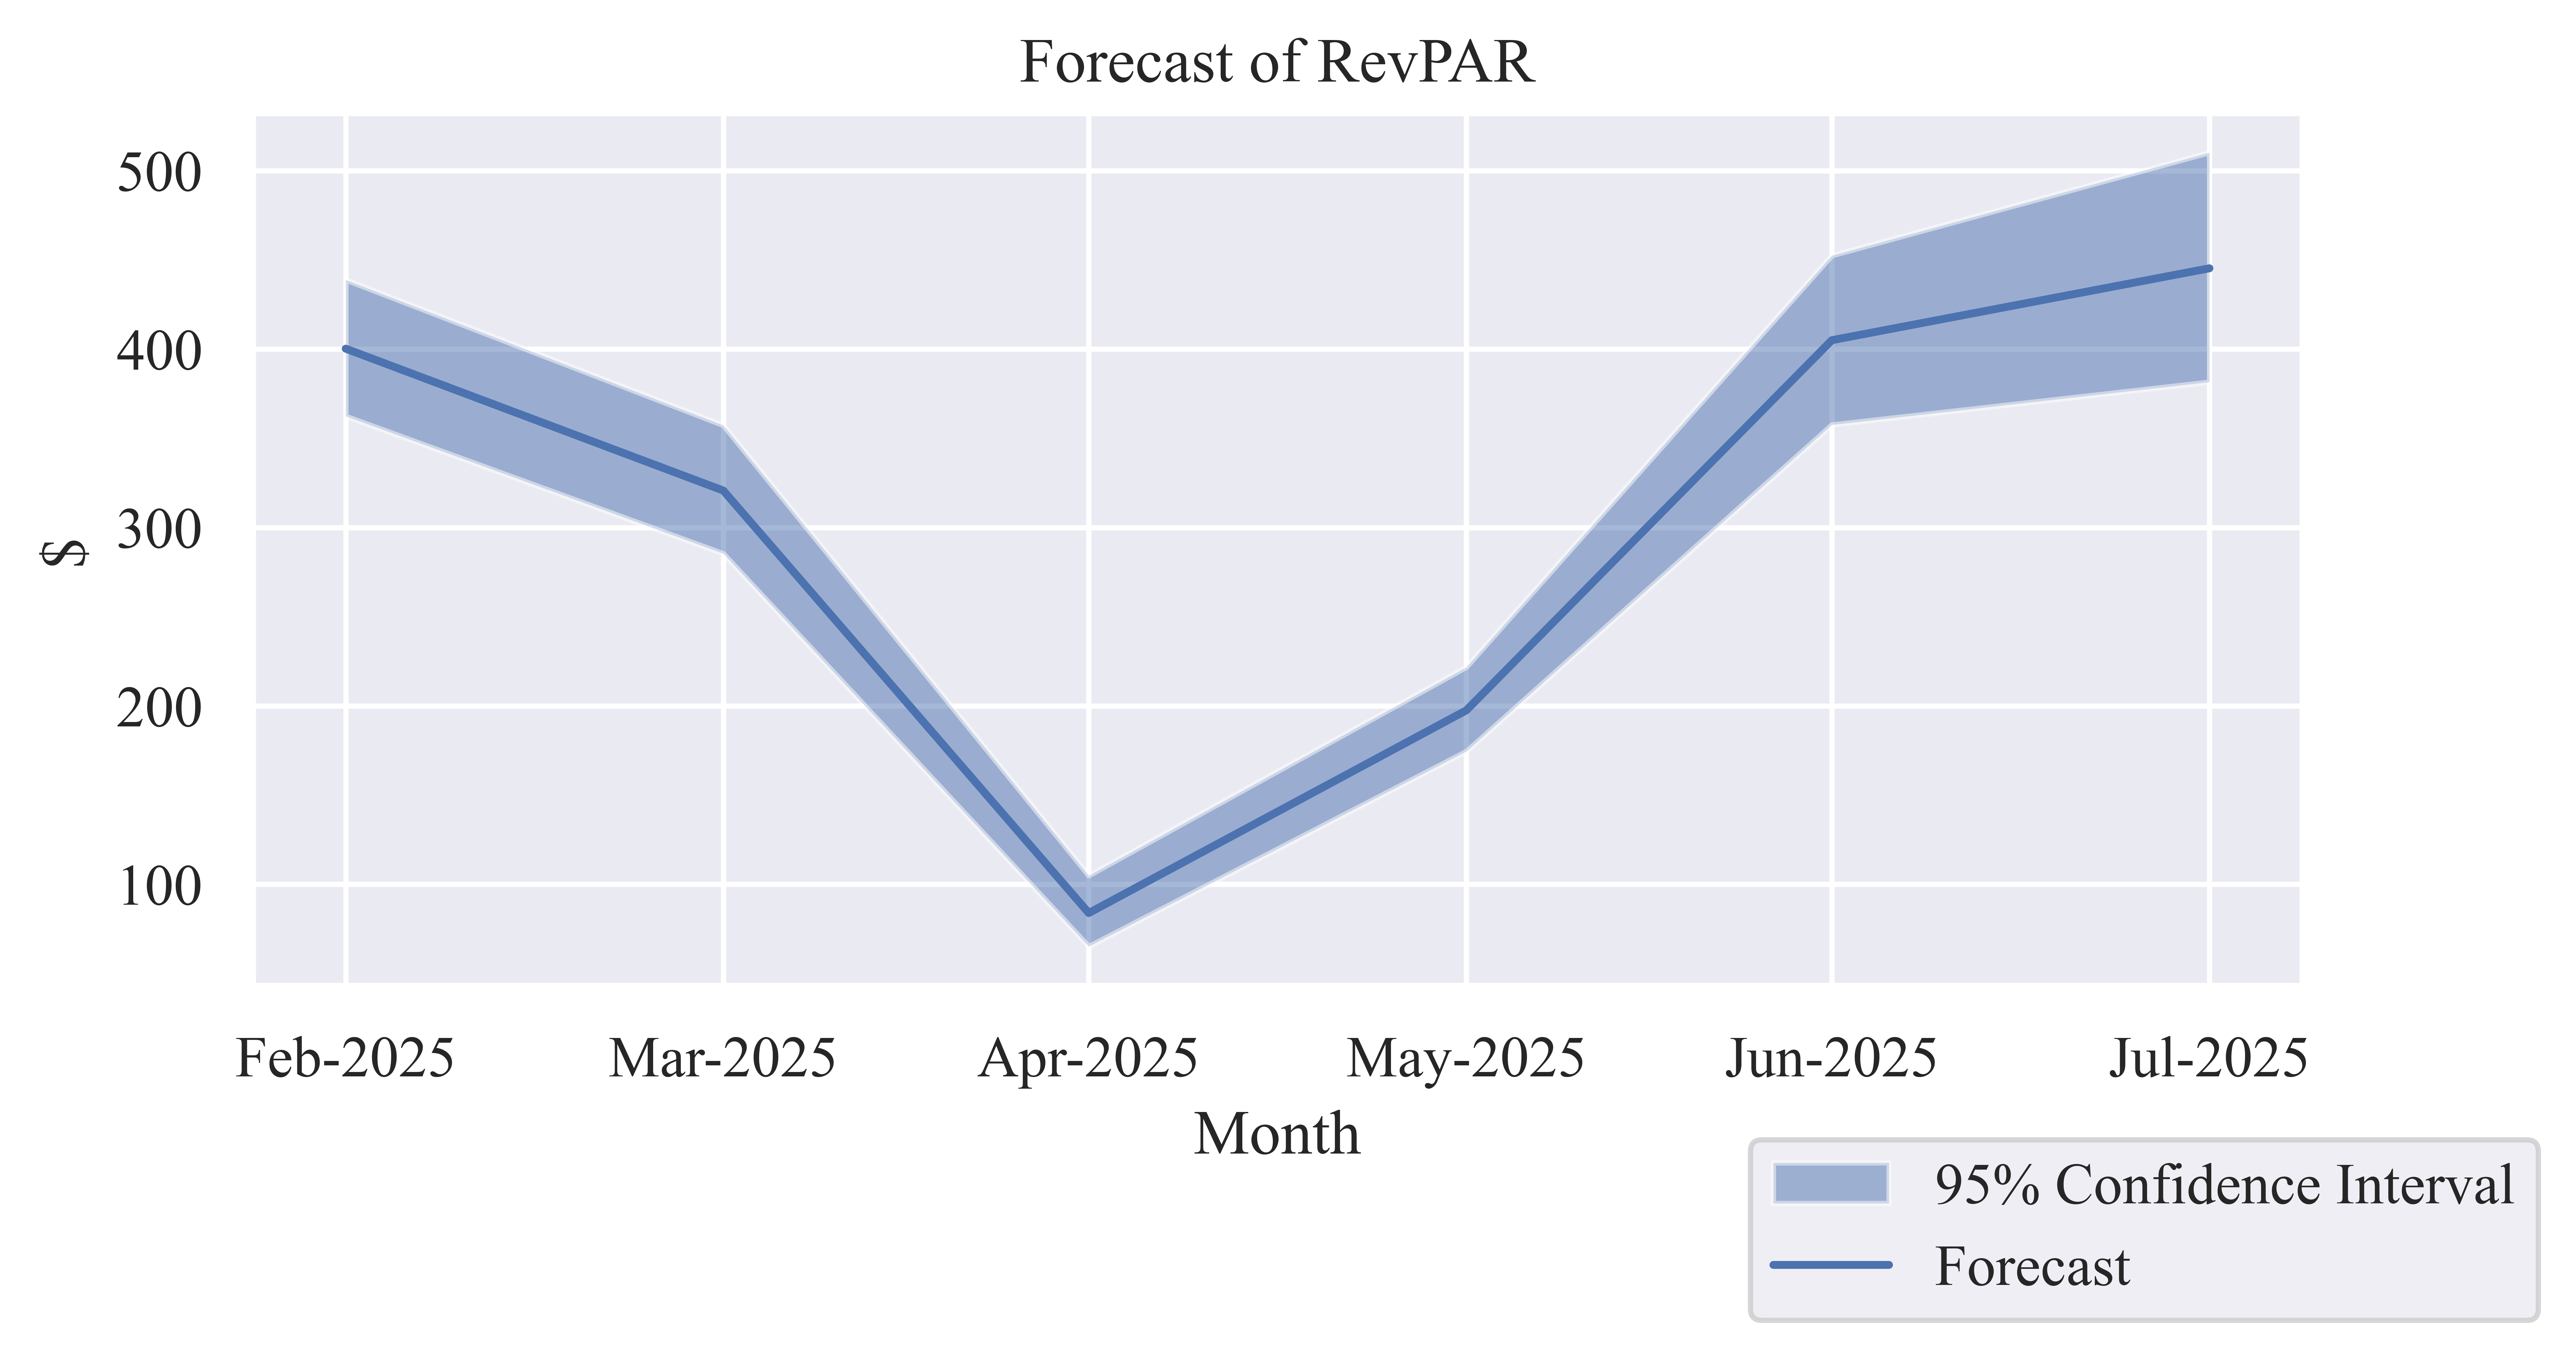
Revenue per Available Room (RevPAR)
Table 3: Forecast of Monthly RevPAR
| Feb-2025 |
$400.21 |
$362.40 |
$438.77 |
| Mar-2025 |
$320.71 |
$285.41 |
$357.27 |
| Apr-2025 |
$83.94 |
$65.25 |
$104.91 |
| May-2025 |
$197.56 |
$174.56 |
$221.73 |
| Jun-2025 |
$404.96 |
$357.55 |
$452.39 |
| Jul-2025 |
$445.26 |
$381.53 |
$510.11 |
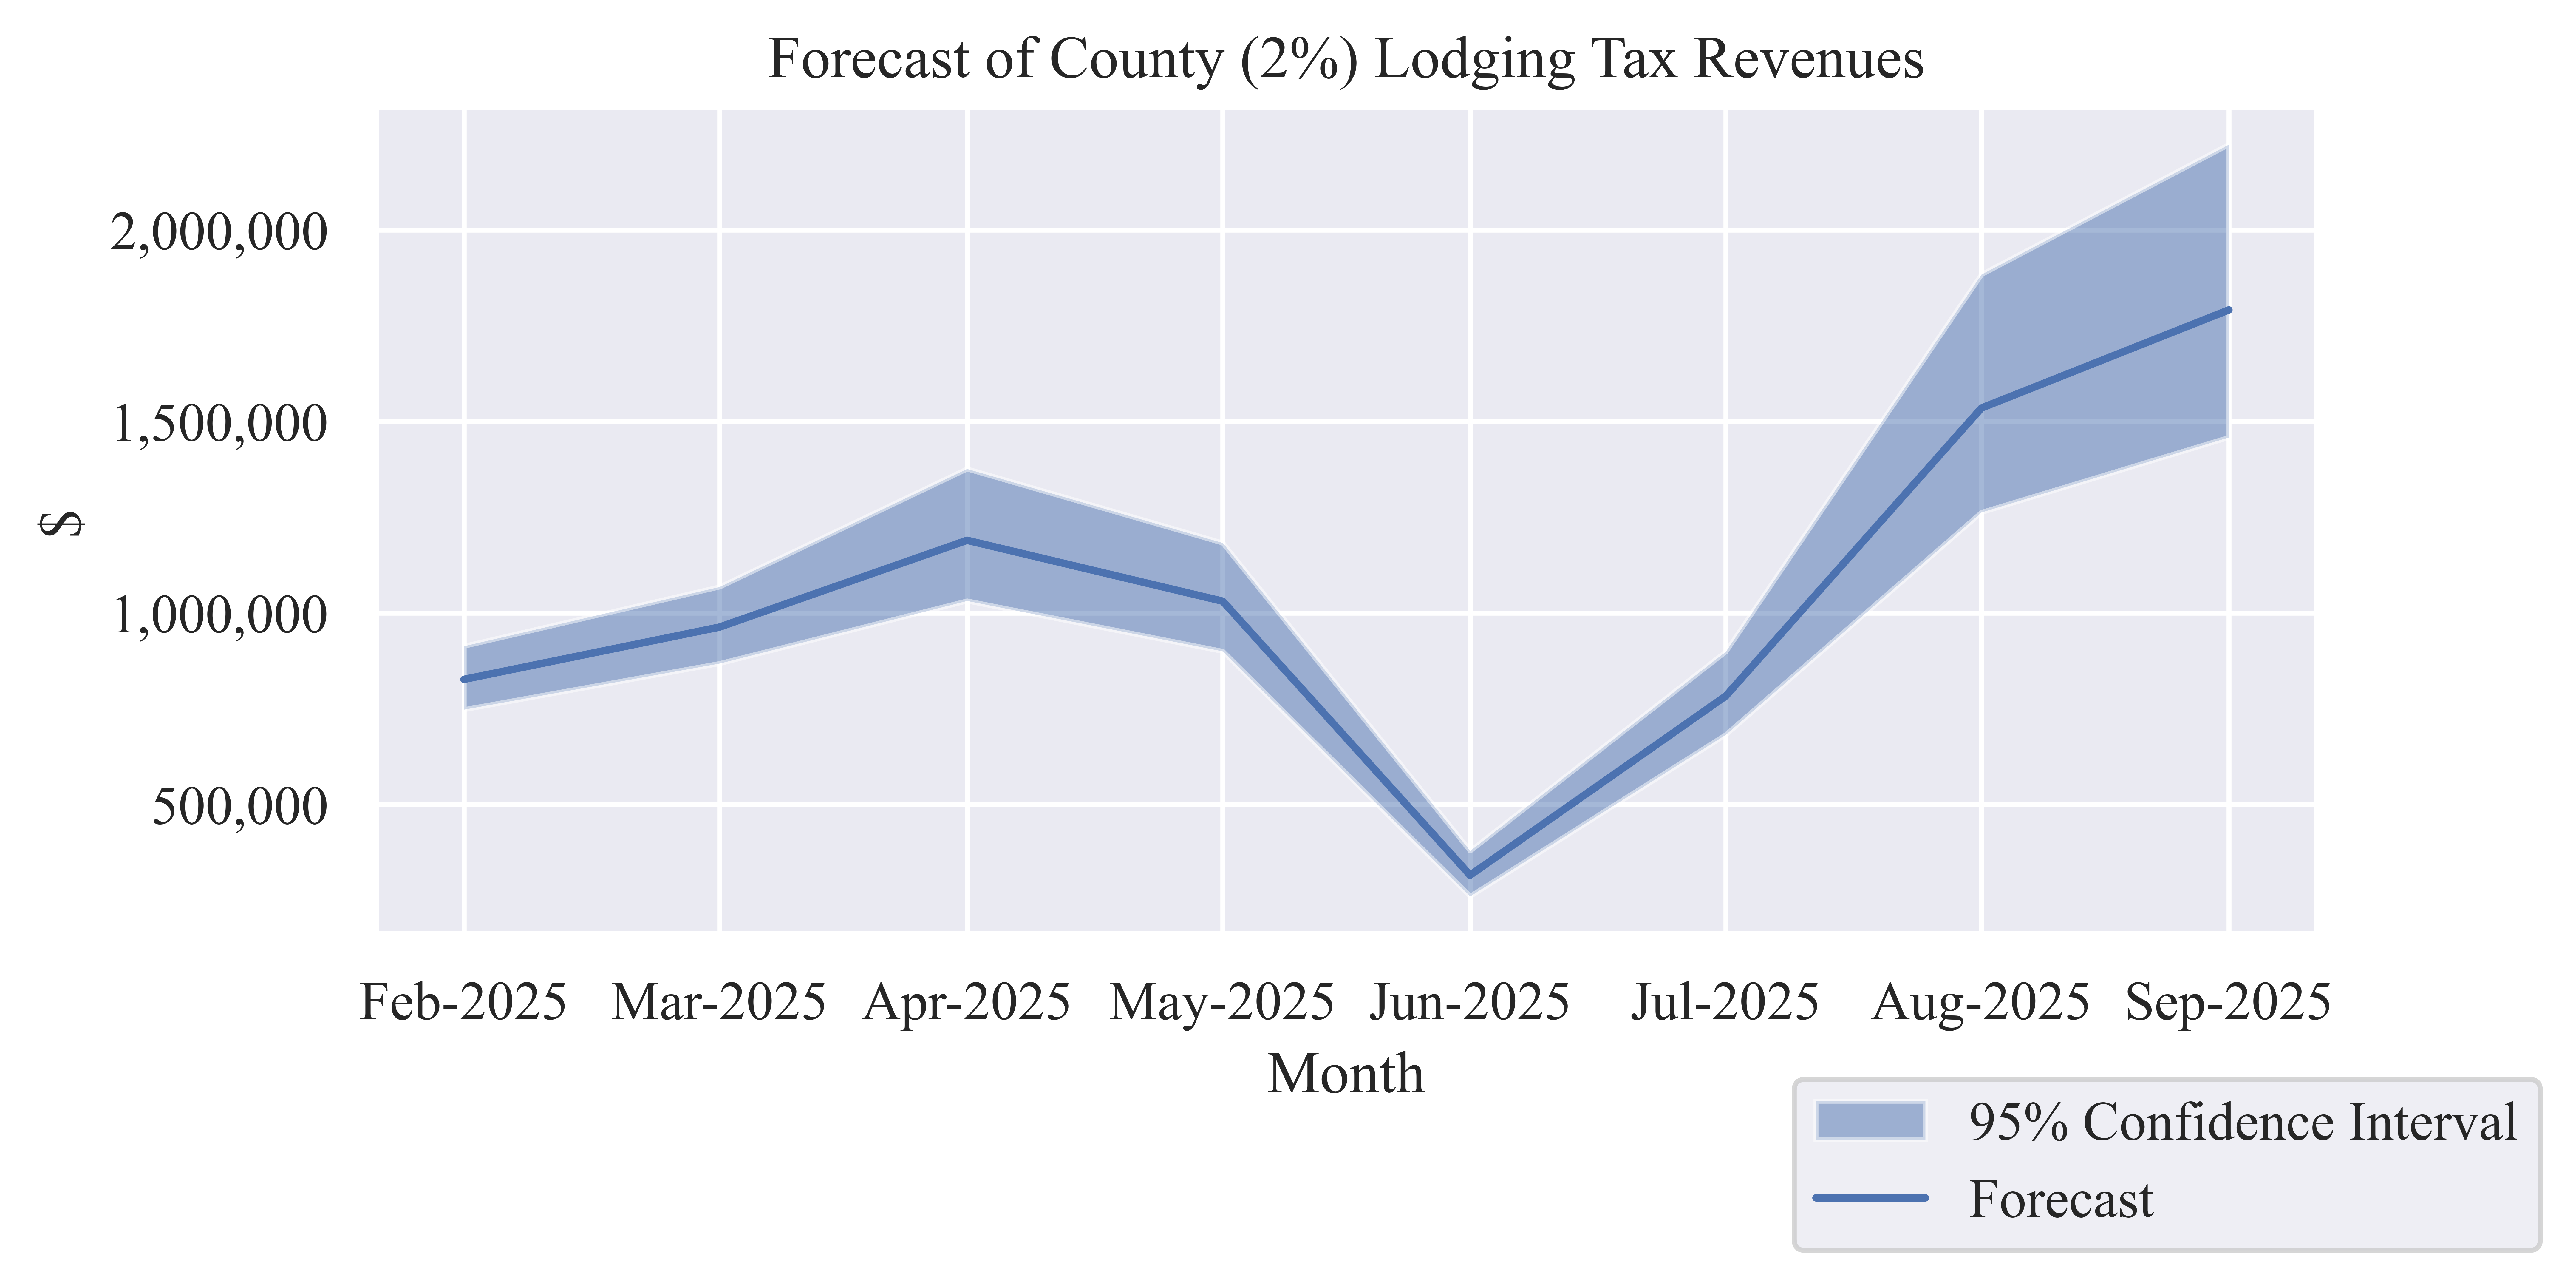
Tax Revenues
Table 4: Forecast County (2%) Lodging Tax Revenue
| Feb-2025 |
$827,071 |
$748,433 |
$913,972 |
| Mar-2025 |
$963,582 |
$868,825 |
$1,068,675 |
| Apr-2025 |
$1,190,135 |
$1,032,126 |
$1,376,701 |
| May-2025 |
$1,031,149 |
$900,567 |
$1,183,408 |
| Jun-2025 |
$315,937 |
$260,989 |
$379,507 |
| Jul-2025 |
$783,545 |
$682,929 |
$899,645 |
| Aug-2025 |
$1,535,440 |
$1,263,287 |
$1,884,295 |
| Sep-2025 |
$1,791,526 |
$1,459,026 |
$2,223,422 |
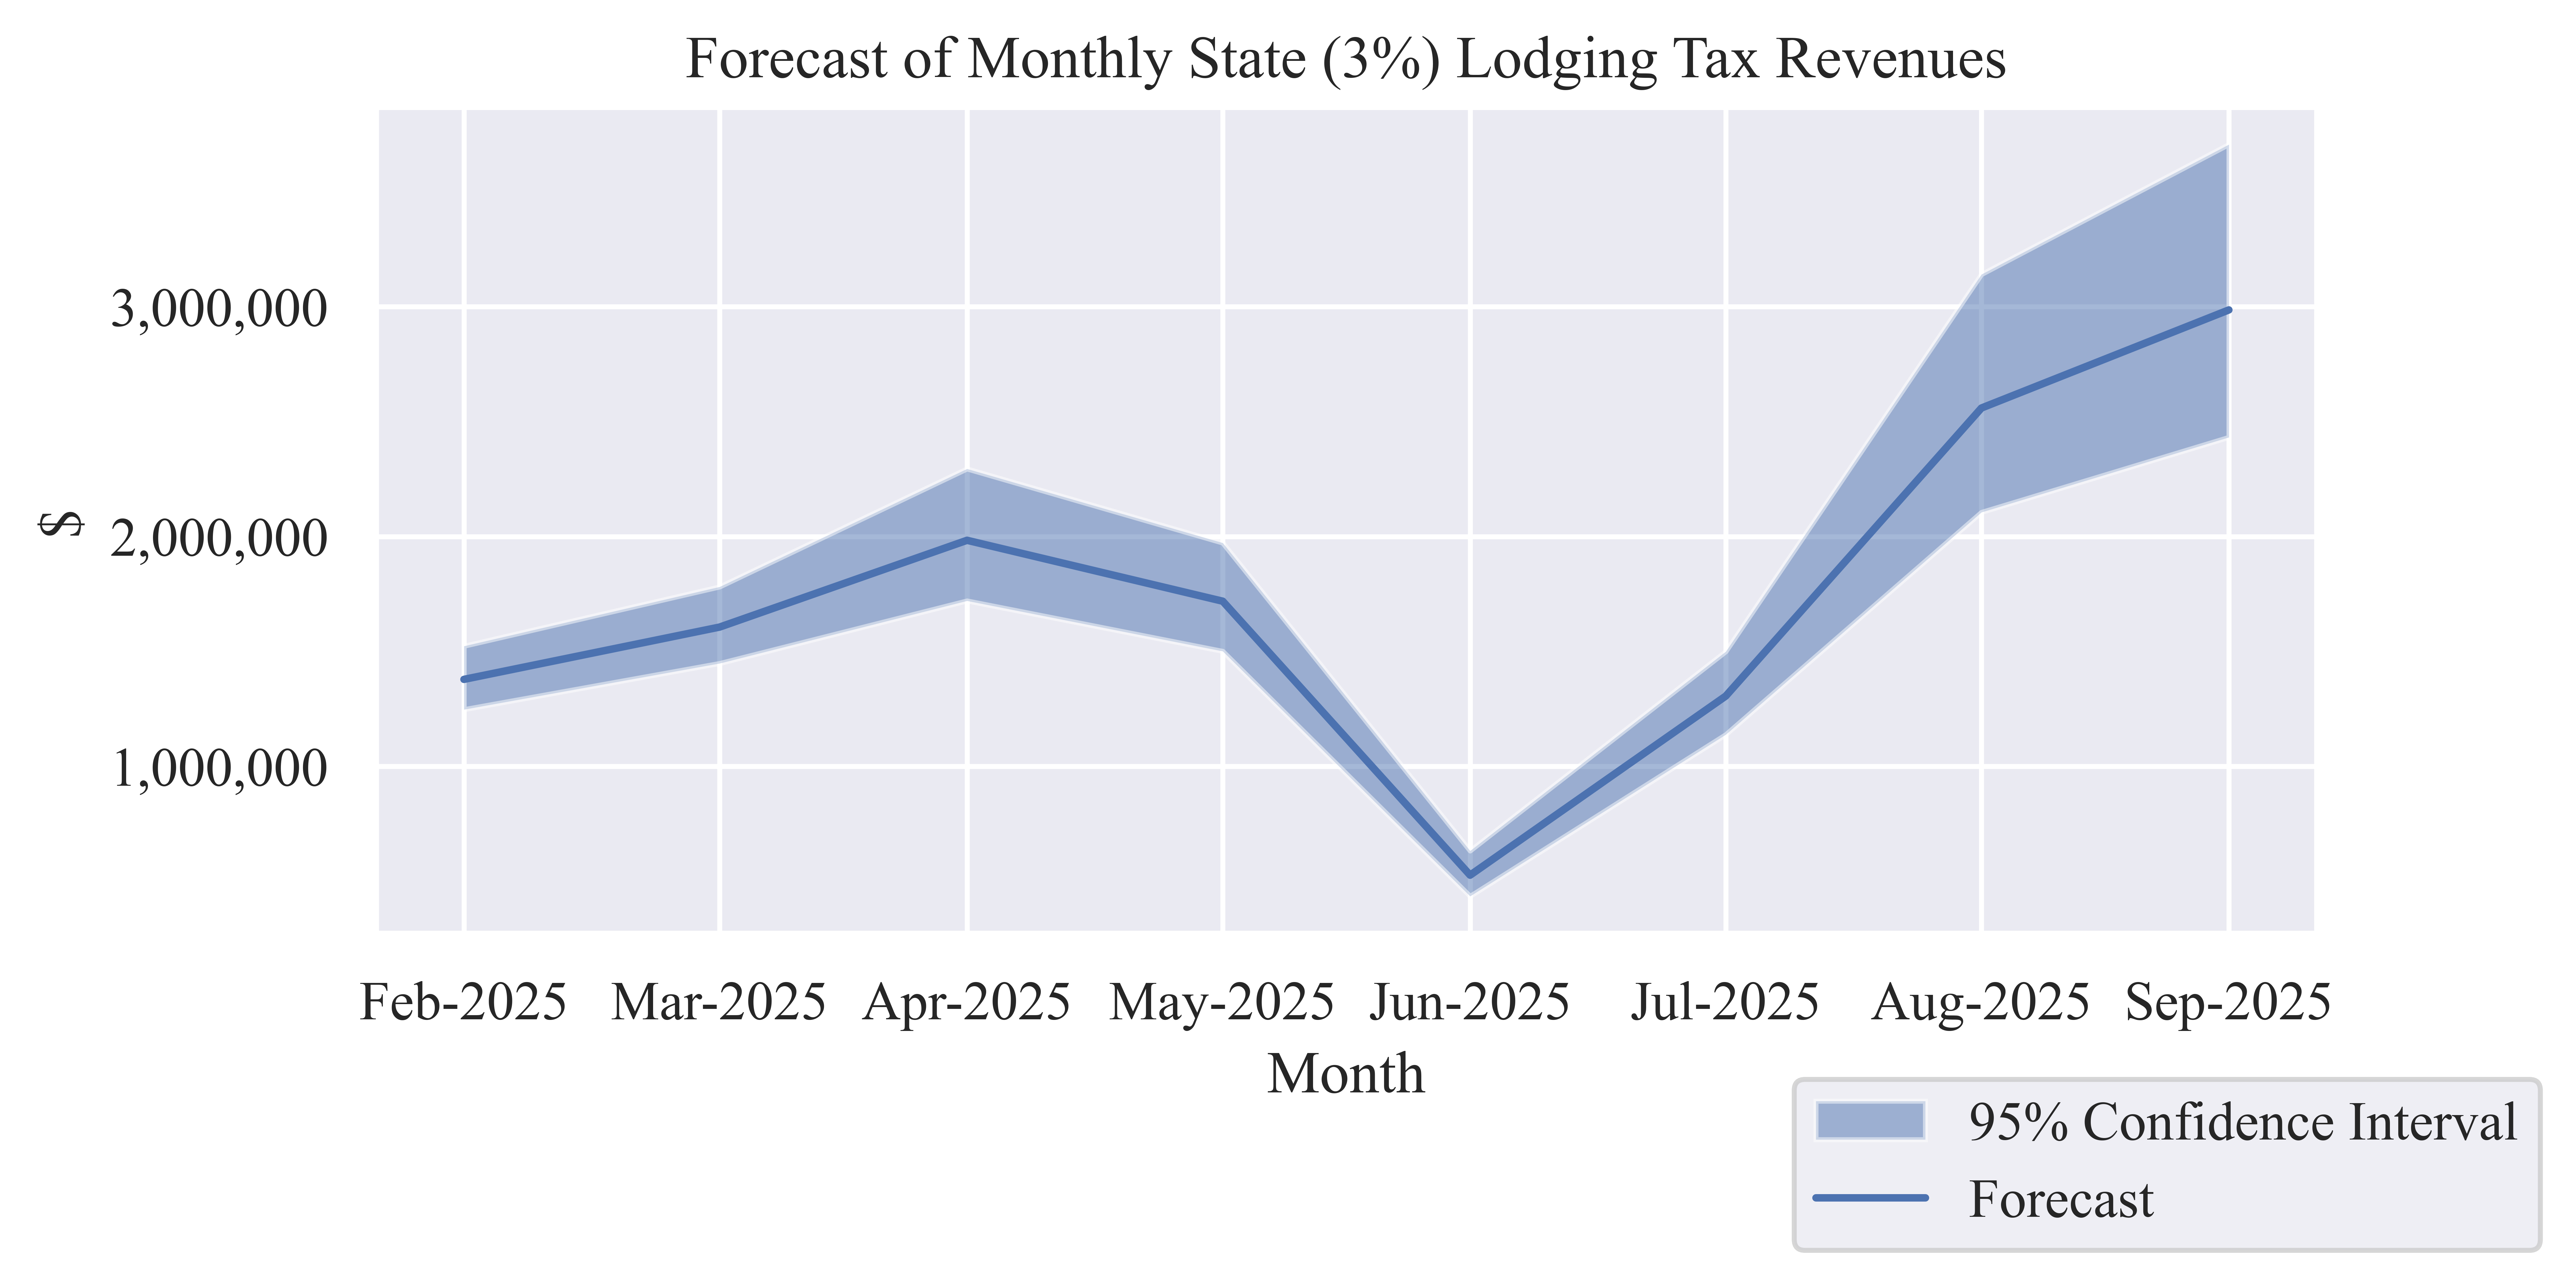
Table 5: Forecast State (3%) Lodging Tax Revenue
| Feb-2025 |
$1,378,452 |
$1,247,389 |
$1,523,286 |
| Mar-2025 |
$1,605,971 |
$1,448,041 |
$1,781,124 |
| Apr-2025 |
$1,983,558 |
$1,720,211 |
$2,294,501 |
| May-2025 |
$1,718,582 |
$1,500,946 |
$1,972,347 |
| Jun-2025 |
$526,562 |
$434,982 |
$632,512 |
| Jul-2025 |
$1,305,908 |
$1,138,216 |
$1,499,408 |
| Aug-2025 |
$2,559,067 |
$2,105,479 |
$3,140,491 |
| Sep-2025 |
$2,985,877 |
$2,431,710 |
$3,705,703 |
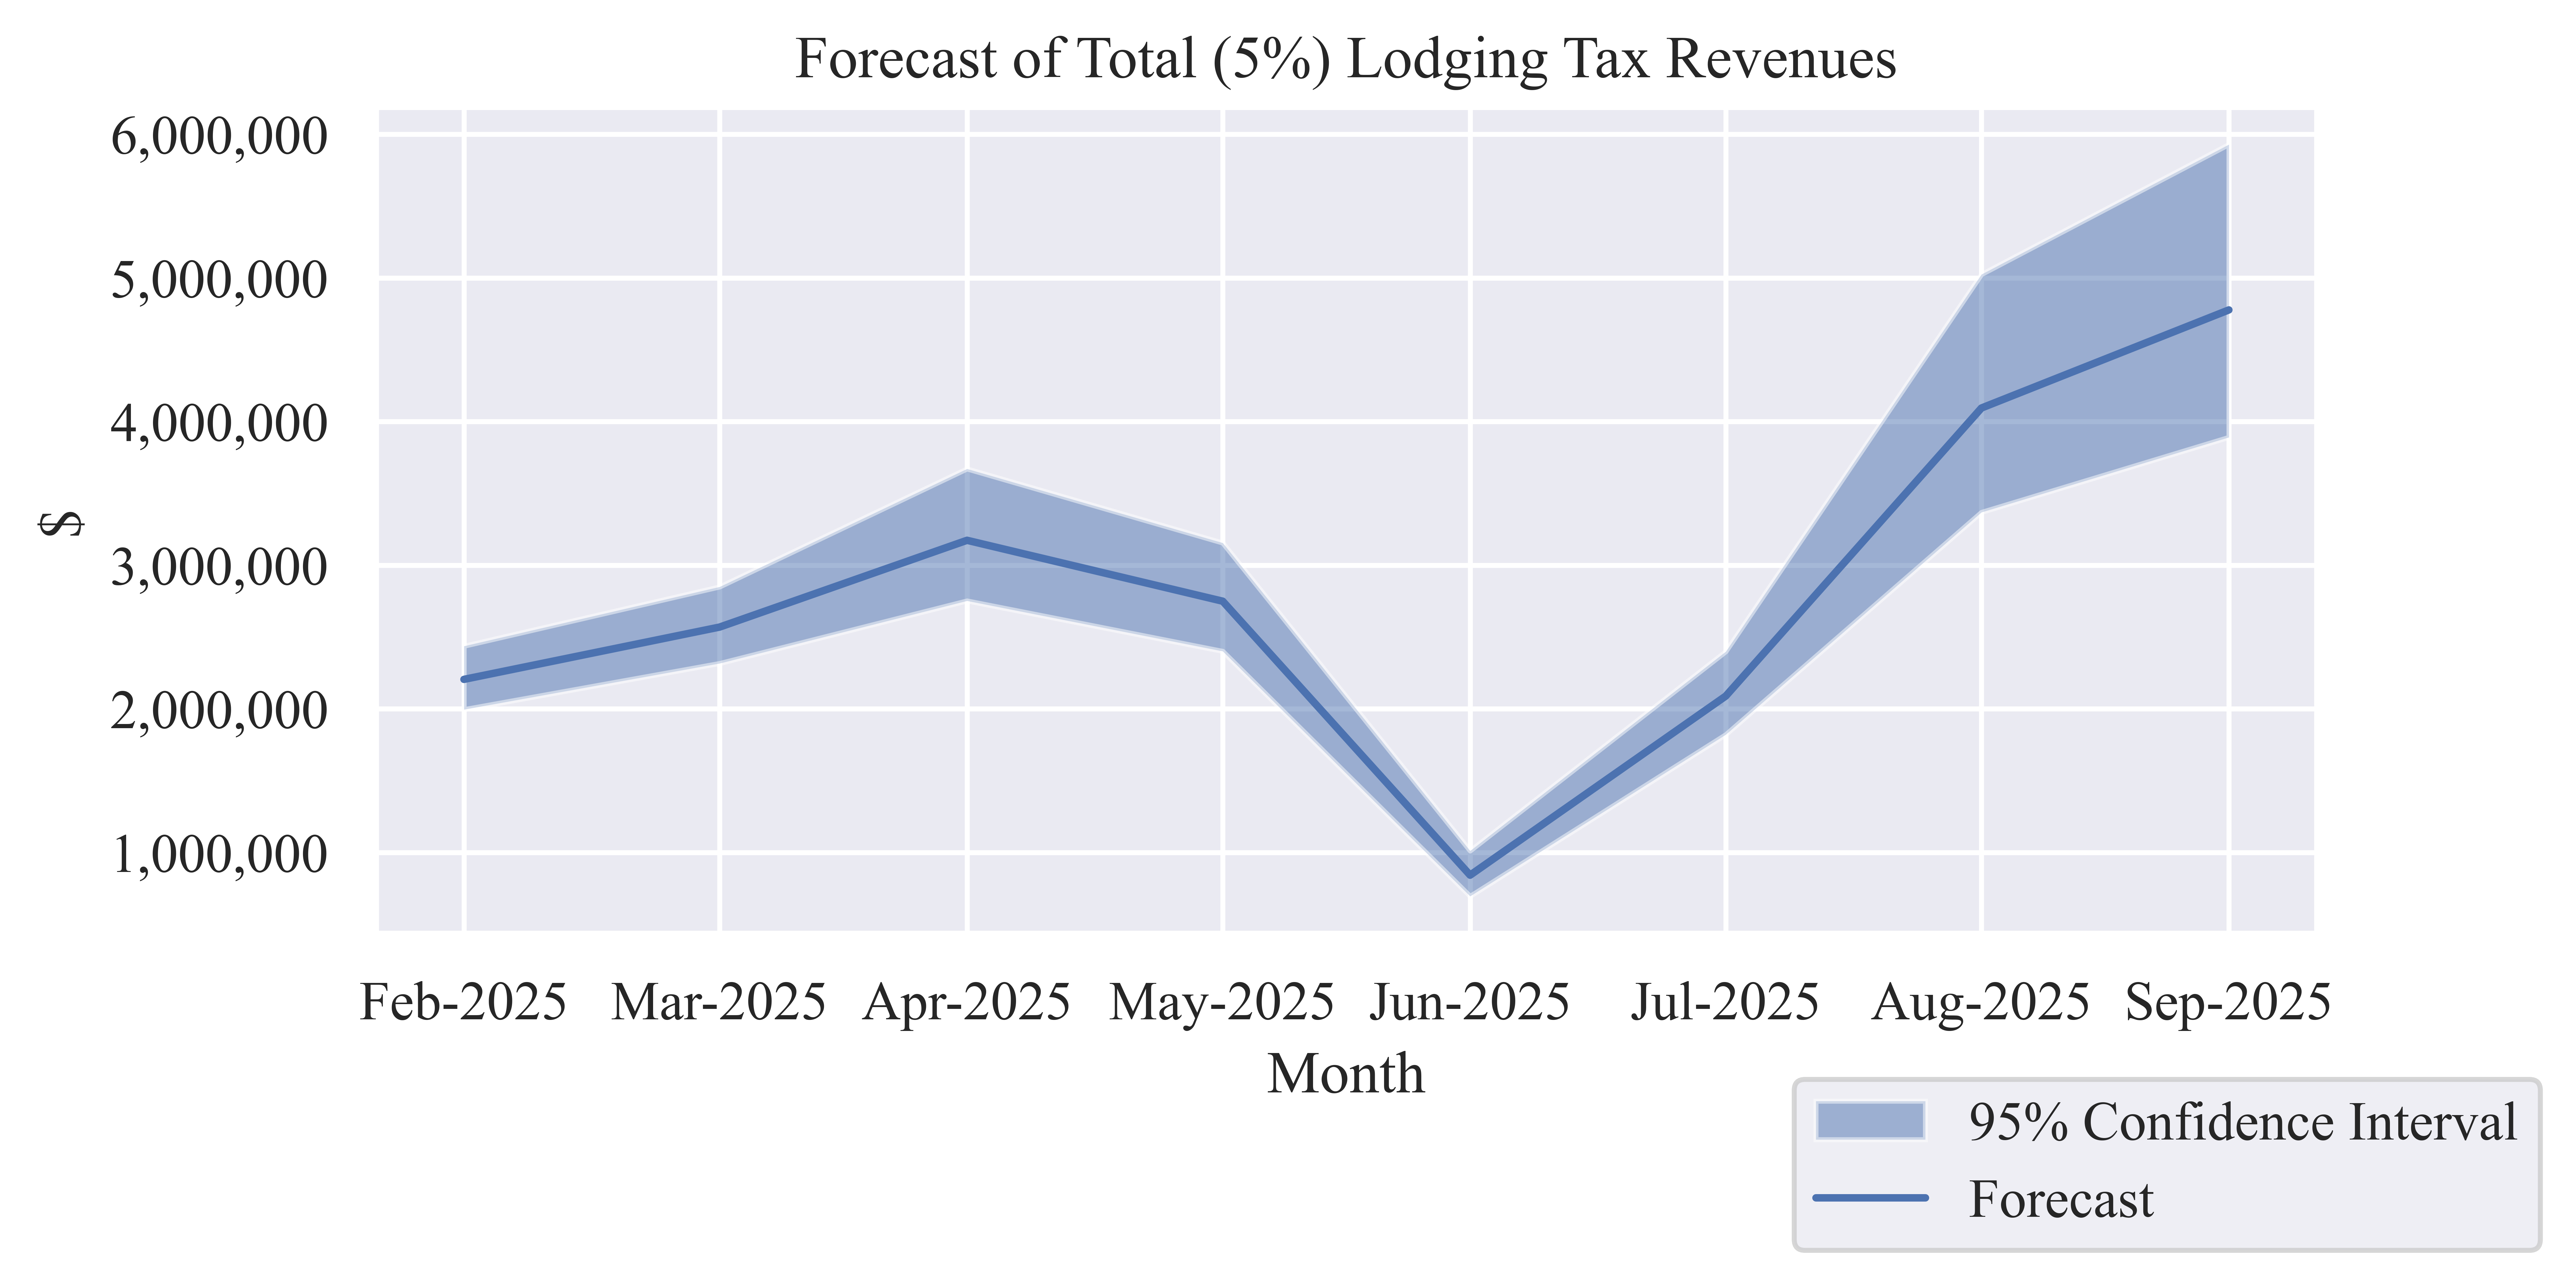
Table 6: Forecast of Monthly Total (5%) Lodging Tax Revenue
| Feb-2025 |
$2,205,523 |
$1,995,823 |
$2,437,258 |
| Mar-2025 |
$2,569,553 |
$2,316,866 |
$2,849,799 |
| Apr-2025 |
$3,173,693 |
$2,752,337 |
$3,671,202 |
| May-2025 |
$2,749,732 |
$2,401,513 |
$3,155,755 |
| Jun-2025 |
$842,500 |
$695,971 |
$1,012,019 |
| Jul-2025 |
$2,089,453 |
$1,821,145 |
$2,399,054 |
| Aug-2025 |
$4,094,507 |
$3,368,766 |
$5,024,786 |
| Sep-2025 |
$4,777,404 |
$3,890,735 |
$5,929,125 |
Lodging Sector Sales
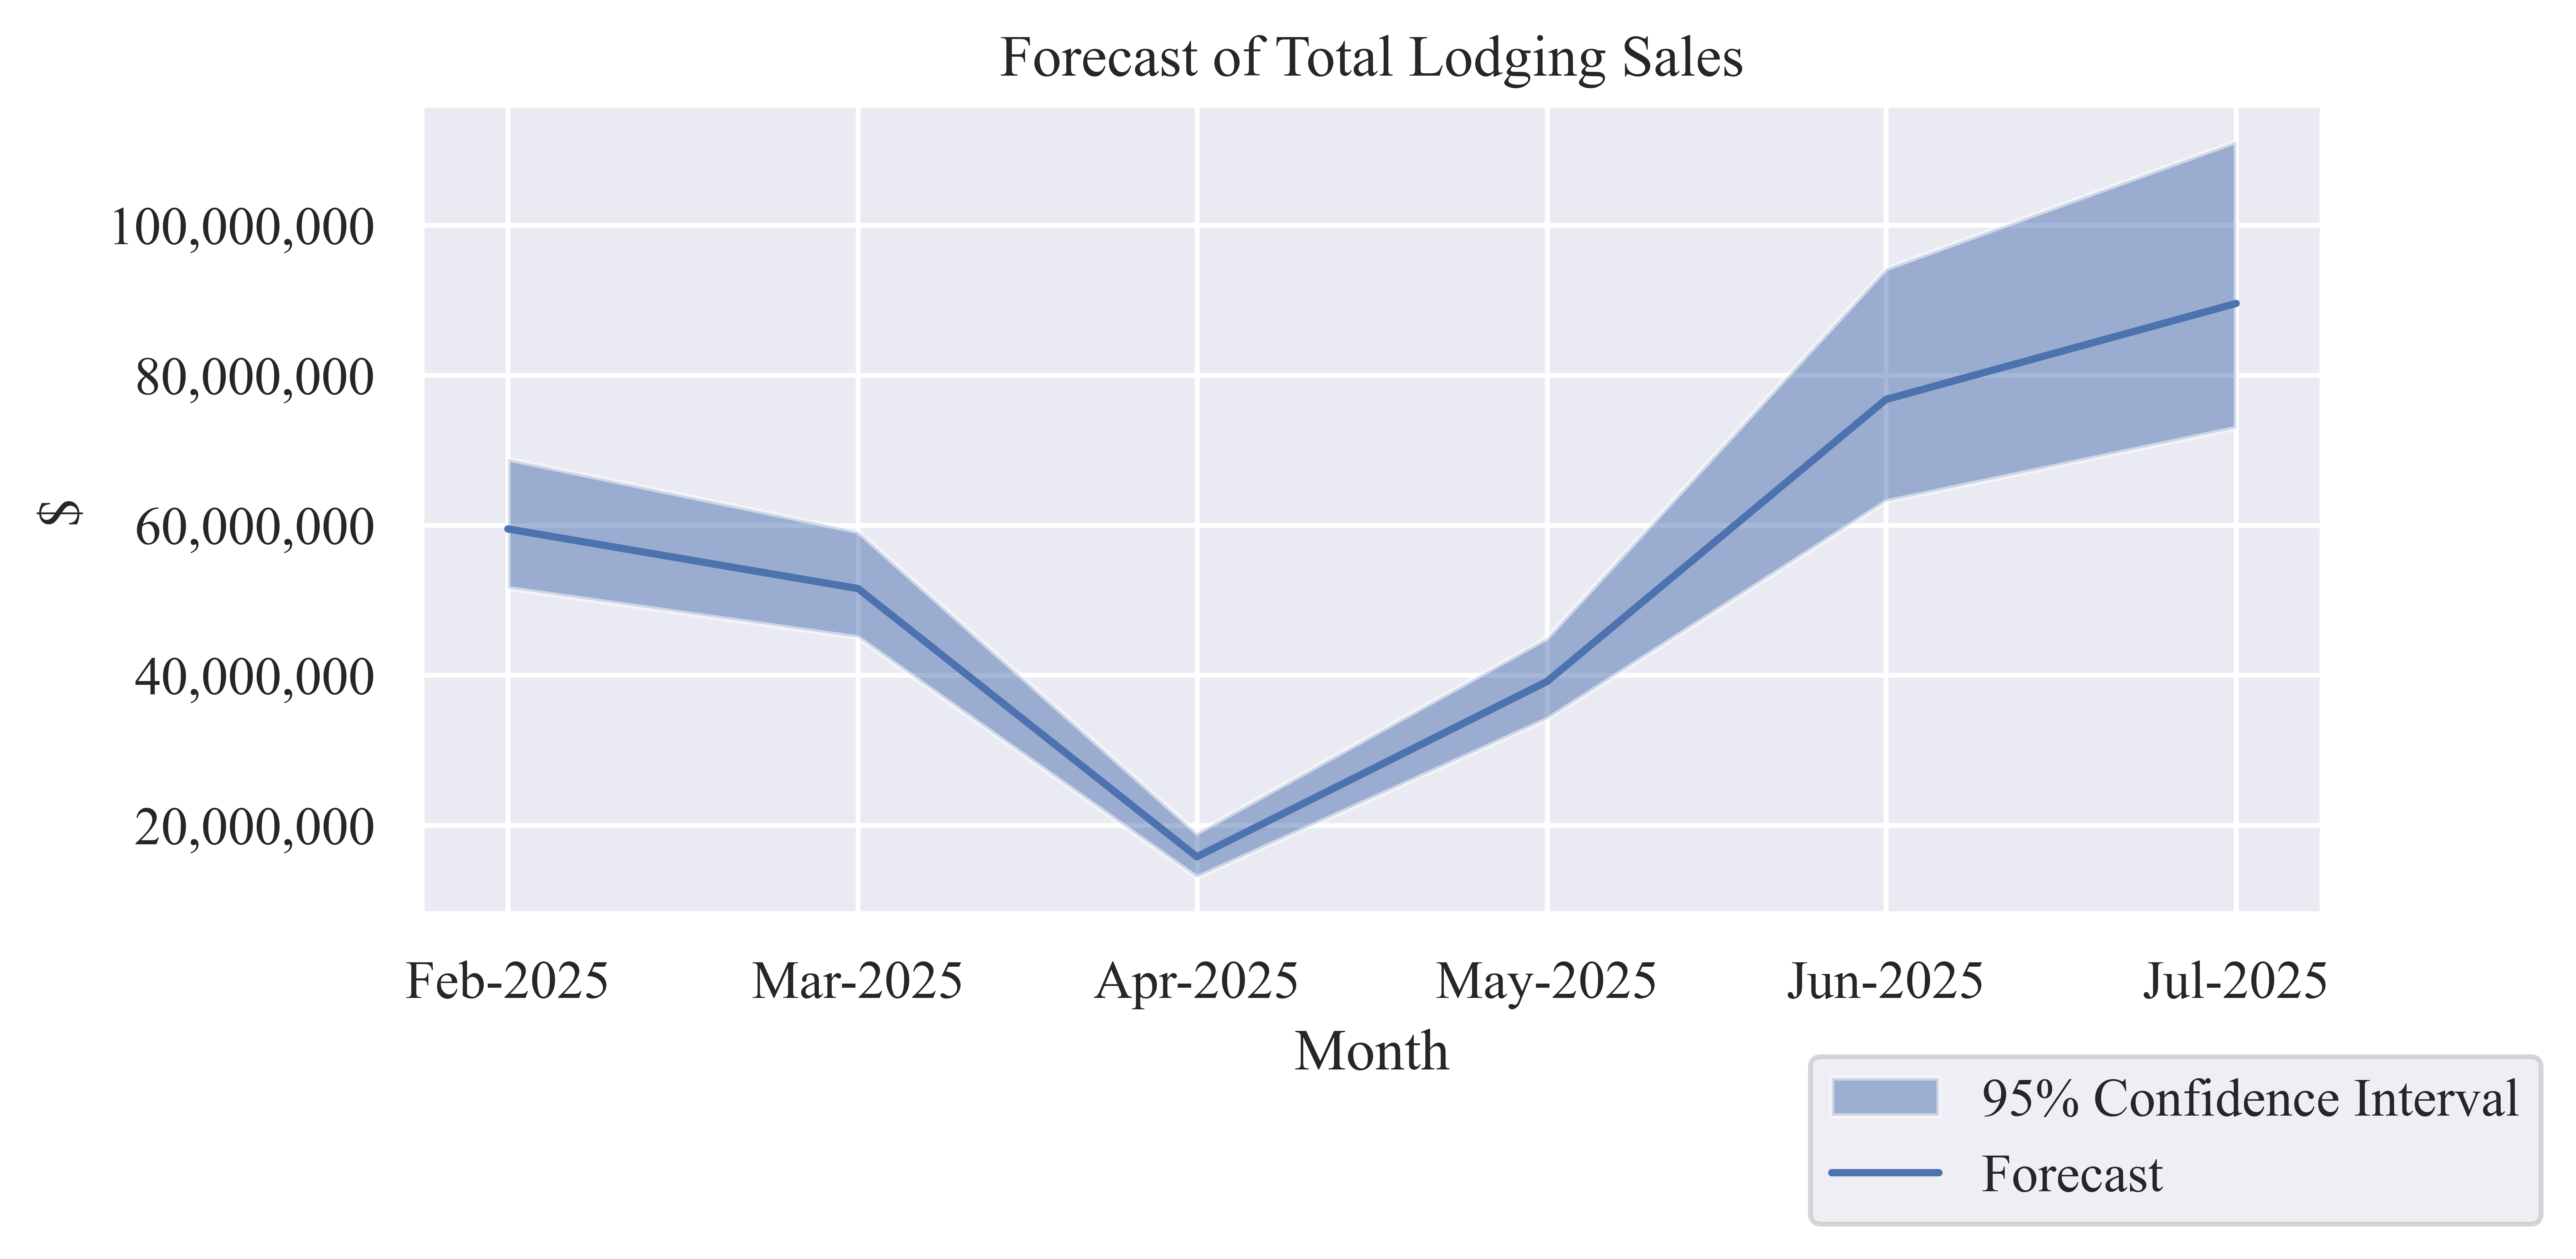
Table 7: Forecast of Monthly Lodging Sales
| Feb-2025 |
$59,506,753 |
$51,606,319 |
$68,835,030 |
| Mar-2025 |
$51,557,468 |
$45,028,365 |
$59,170,415 |
| Apr-2025 |
$15,796,874 |
$13,049,452 |
$18,975,353 |
| May-2025 |
$39,177,237 |
$34,146,474 |
$44,982,253 |
| Jun-2025 |
$76,772,008 |
$63,164,366 |
$94,214,729 |
| Jul-2025 |
$89,576,319 |
$72,951,290 |
$111,171,093 |
Economic Indicators
Table 8: Six-Month Forecast of Economic Output from Lodging Sales
| Low Estimate |
$239,242,270 |
$51,233,082 |
$12,978,443 |
$303,453,795 |
| Median Estimate |
$290,240,105 |
$62,154,130 |
$15,744,980 |
$368,139,214 |
| High Estimate |
$355,993,193 |
$76,234,978 |
$19,311,974 |
$451,540,145 |
Table 9: Six-Month Forecast of Employee Compensation from Lodging Sales
| Low Estimate |
$77,379,385 |
$17,269,238 |
$3,582,192 |
$98,230,815 |
| Median Estimate |
$93,873,883 |
$20,950,417 |
$4,345,787 |
$119,170,087 |
| High Estimate |
$115,140,749 |
$25,696,678 |
$5,330,316 |
$146,167,743 |
Table 10: Six-Month Forecast of Contribution to Gross County Product from Lodging
Sales
| Low Estimate |
$173,078,720 |
$30,122,267 |
$7,824,967 |
$211,025,954 |
| Median Estimate |
$209,972,869 |
$36,543,250 |
$9,492,968 |
$256,009,087 |
| High Estimate |
$257,541,638 |
$44,822,024 |
$11,643,581 |
$314,007,243 |
Table 11: Six-Month Forecast of Employment from Lodging Sales
| Low Estimate |
3,015 |
484 |
134 |
3,634 |
| Median Estimate |
3,658 |
587 |
163 |
4,408 |
| High Estimate |
4,487 |
720 |
200 |
5,407 |
