Jackson Hole Economic Forecasting
June 2024 Forecast
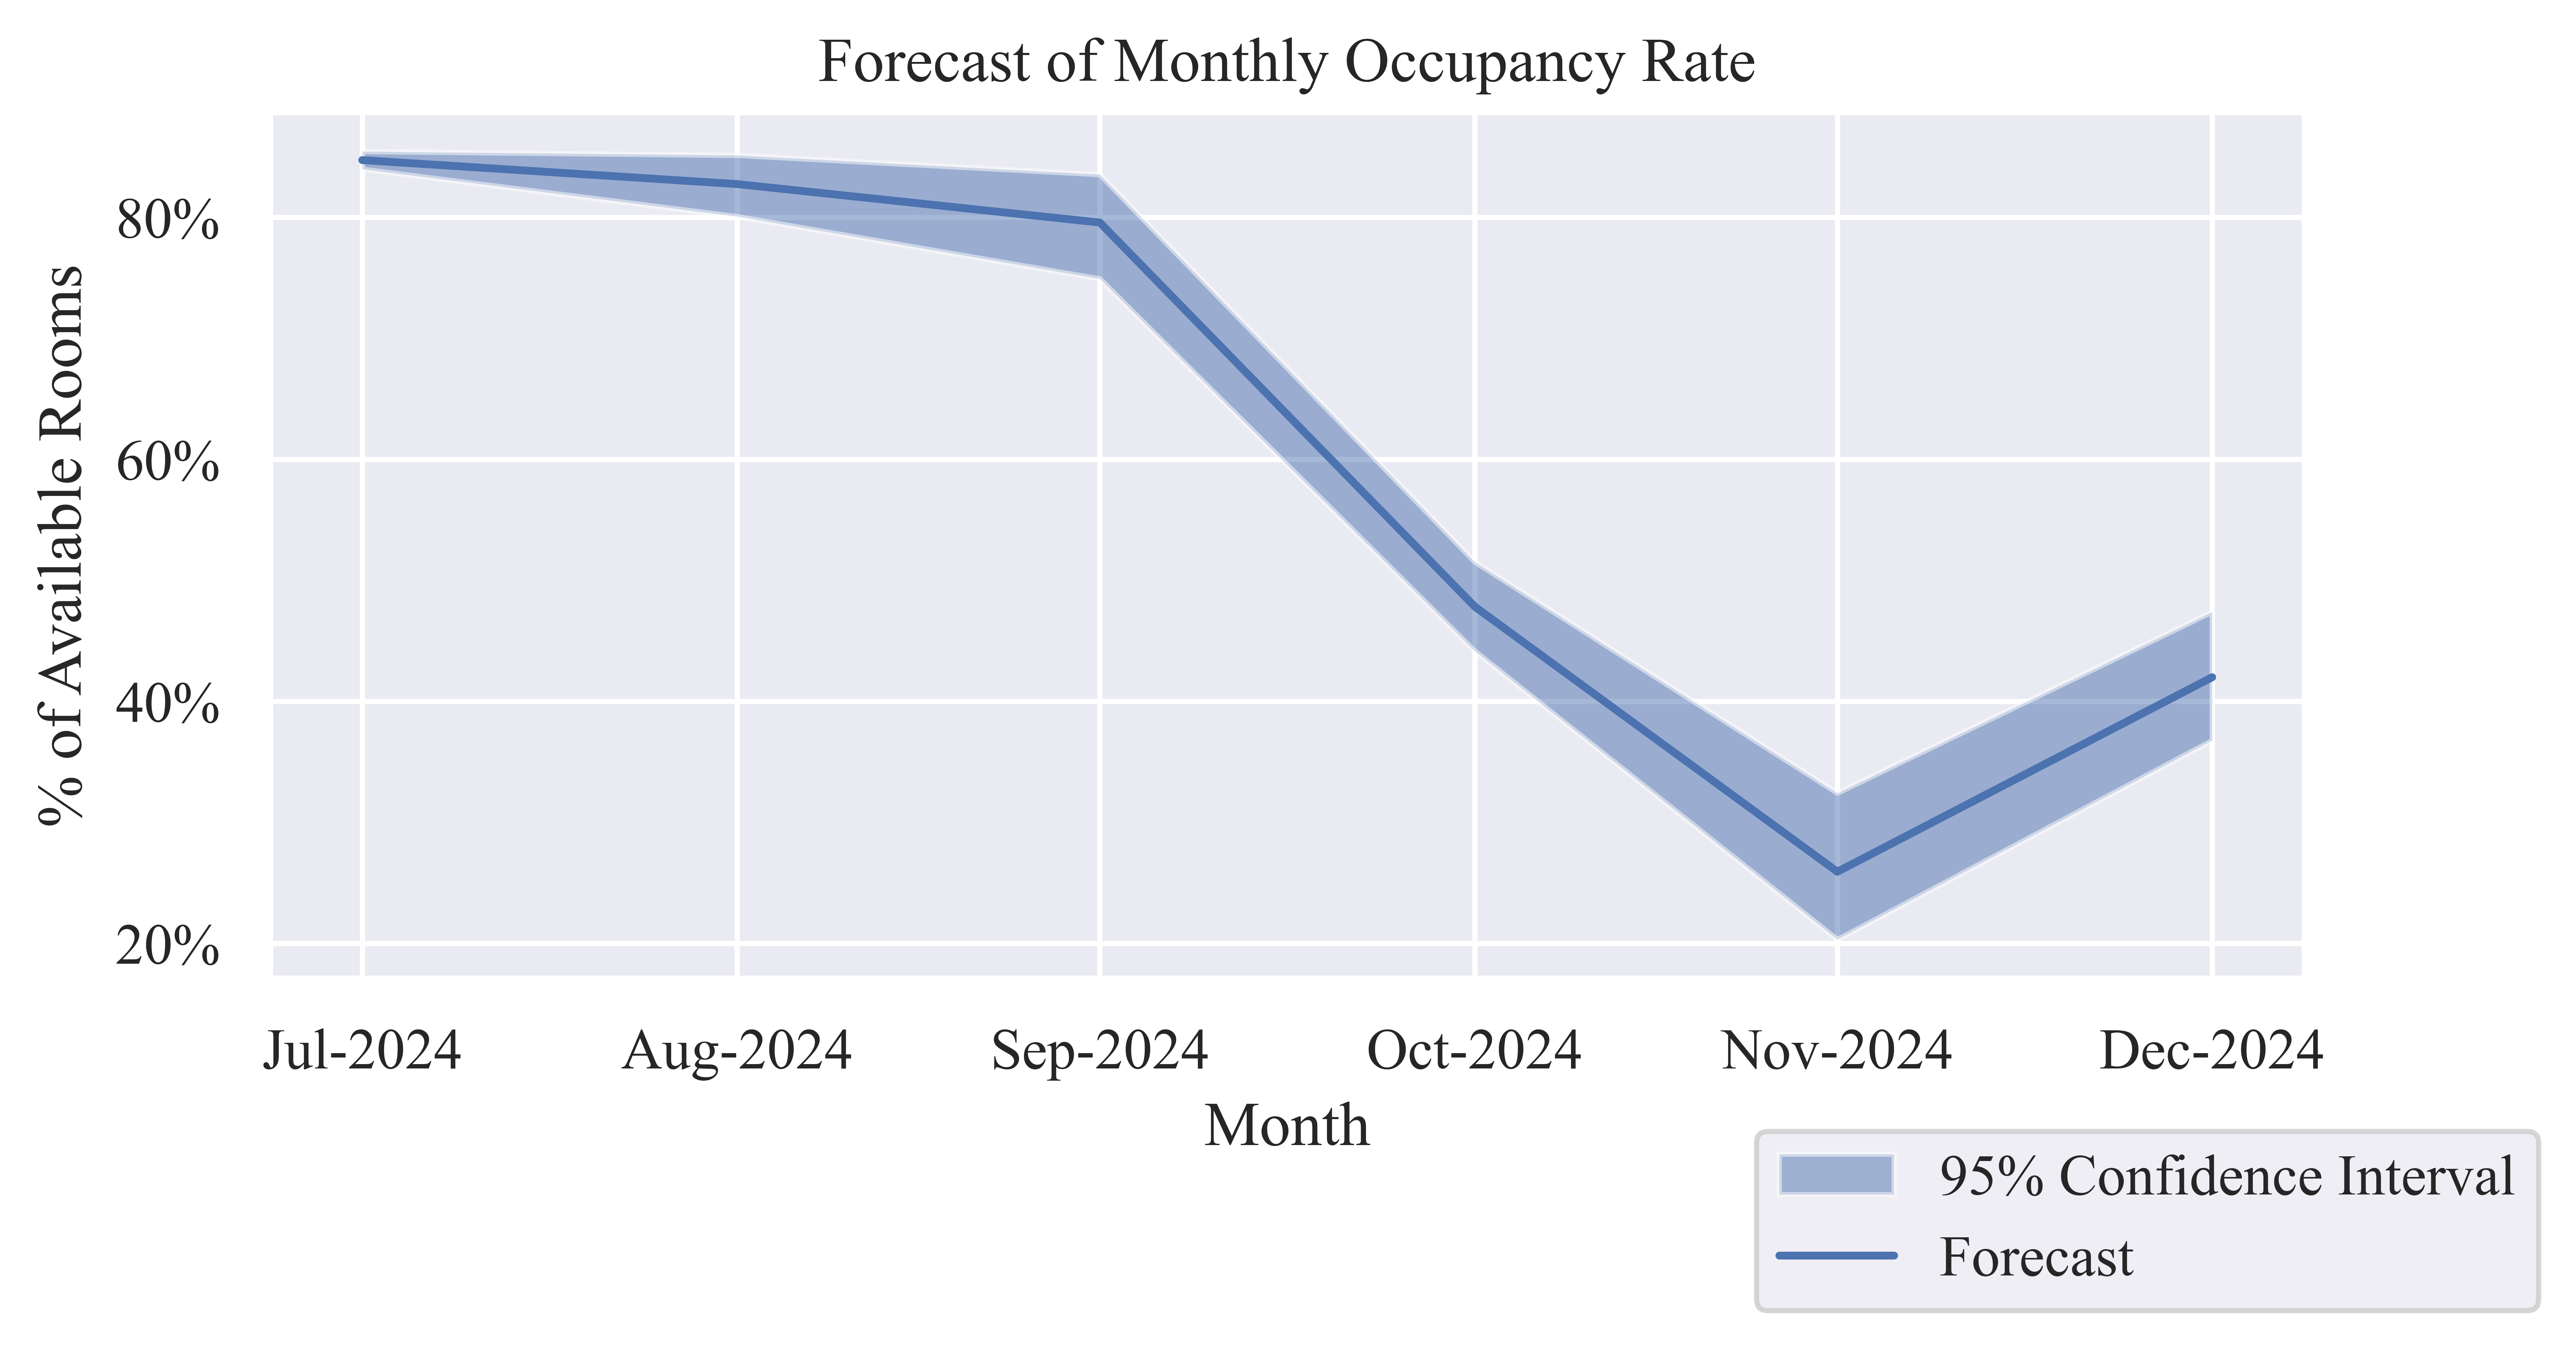
Occupancy Rate (OR)
Table 1: Forecast of Monthly Occupancy Rate
| Jul-2024 |
84.73% |
83.99% |
85.45% |
| Aug-2024 |
82.75% |
80.08% |
85.13% |
| Sep-2024 |
79.57% |
74.93% |
83.54% |
| Oct-2024 |
47.84% |
44.18% |
51.53% |
| Nov-2024 |
25.92% |
20.33% |
32.42% |
| Dec-2024 |
42.00% |
36.78% |
47.39% |
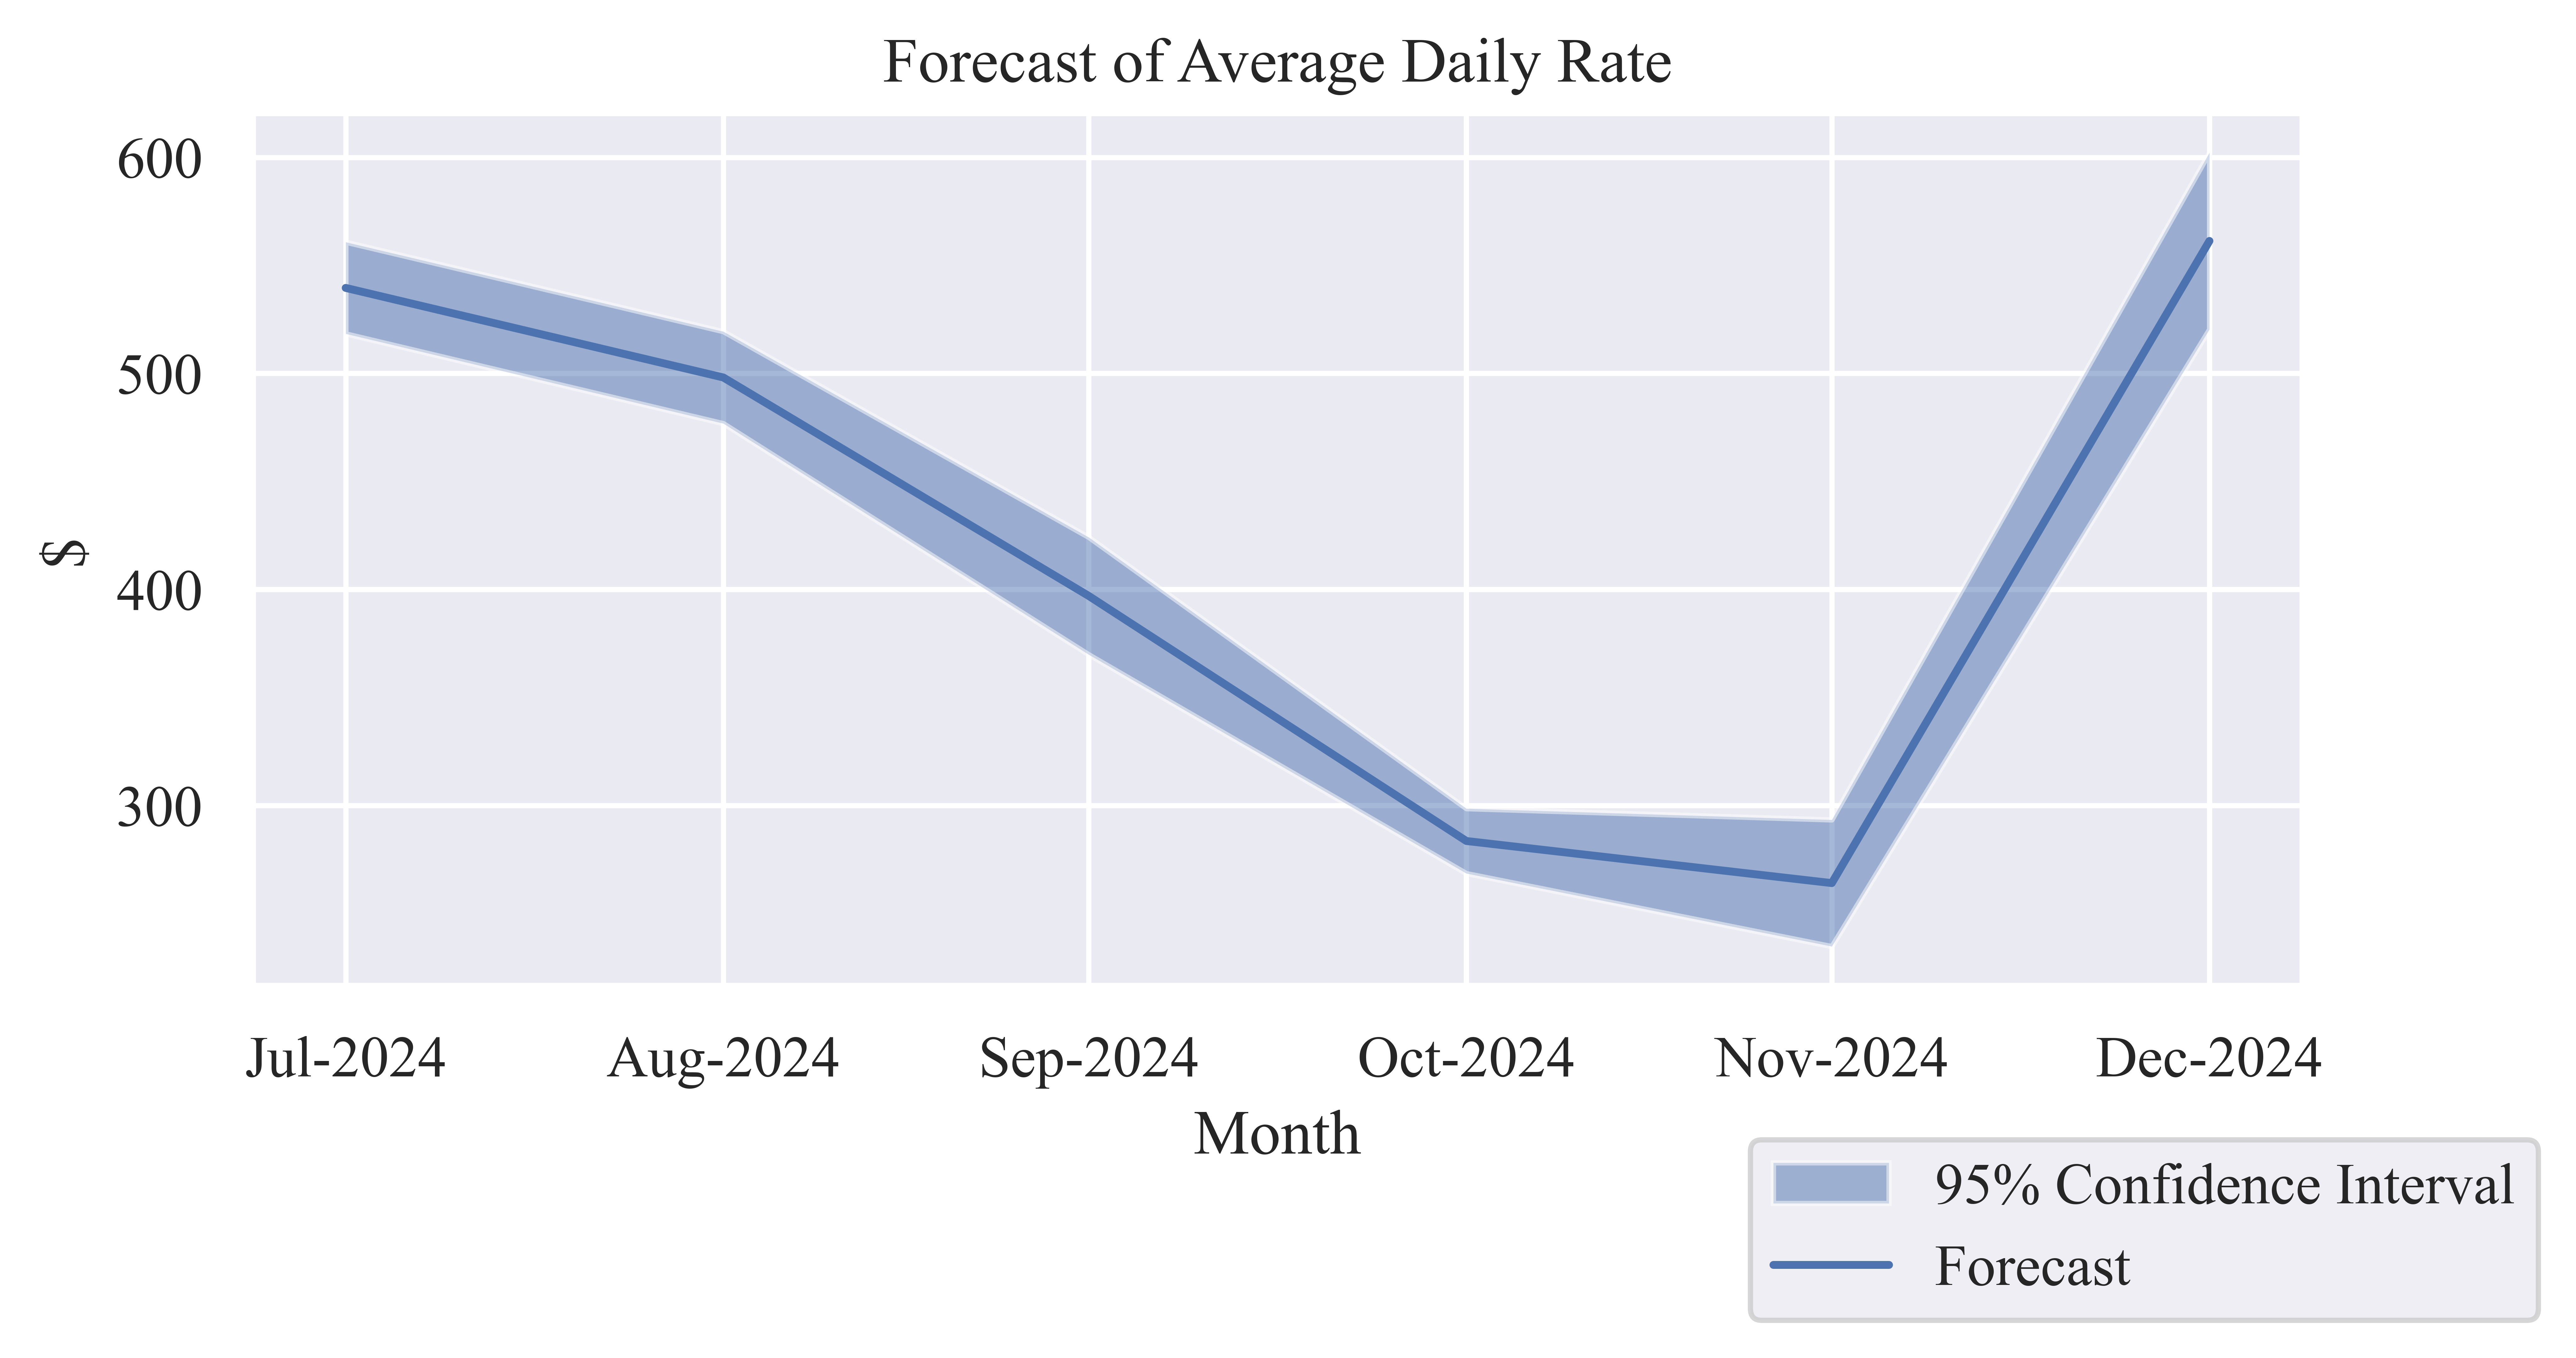
Average Daily Rate (ADR)
Table 2: Forecast of Monthly Average Daily Rate
| Jul-2024 |
$539.57 |
$518.36 |
$560.79 |
| Aug-2024 |
$498.11 |
$476.83 |
$519.40 |
| Sep-2024 |
$396.99 |
$369.83 |
$424.15 |
| Oct-2024 |
$283.56 |
$268.54 |
$298.57 |
| Nov-2024 |
$264.07 |
$234.77 |
$293.38 |
| Dec-2024 |
$561.31 |
$520.40 |
$602.22 |
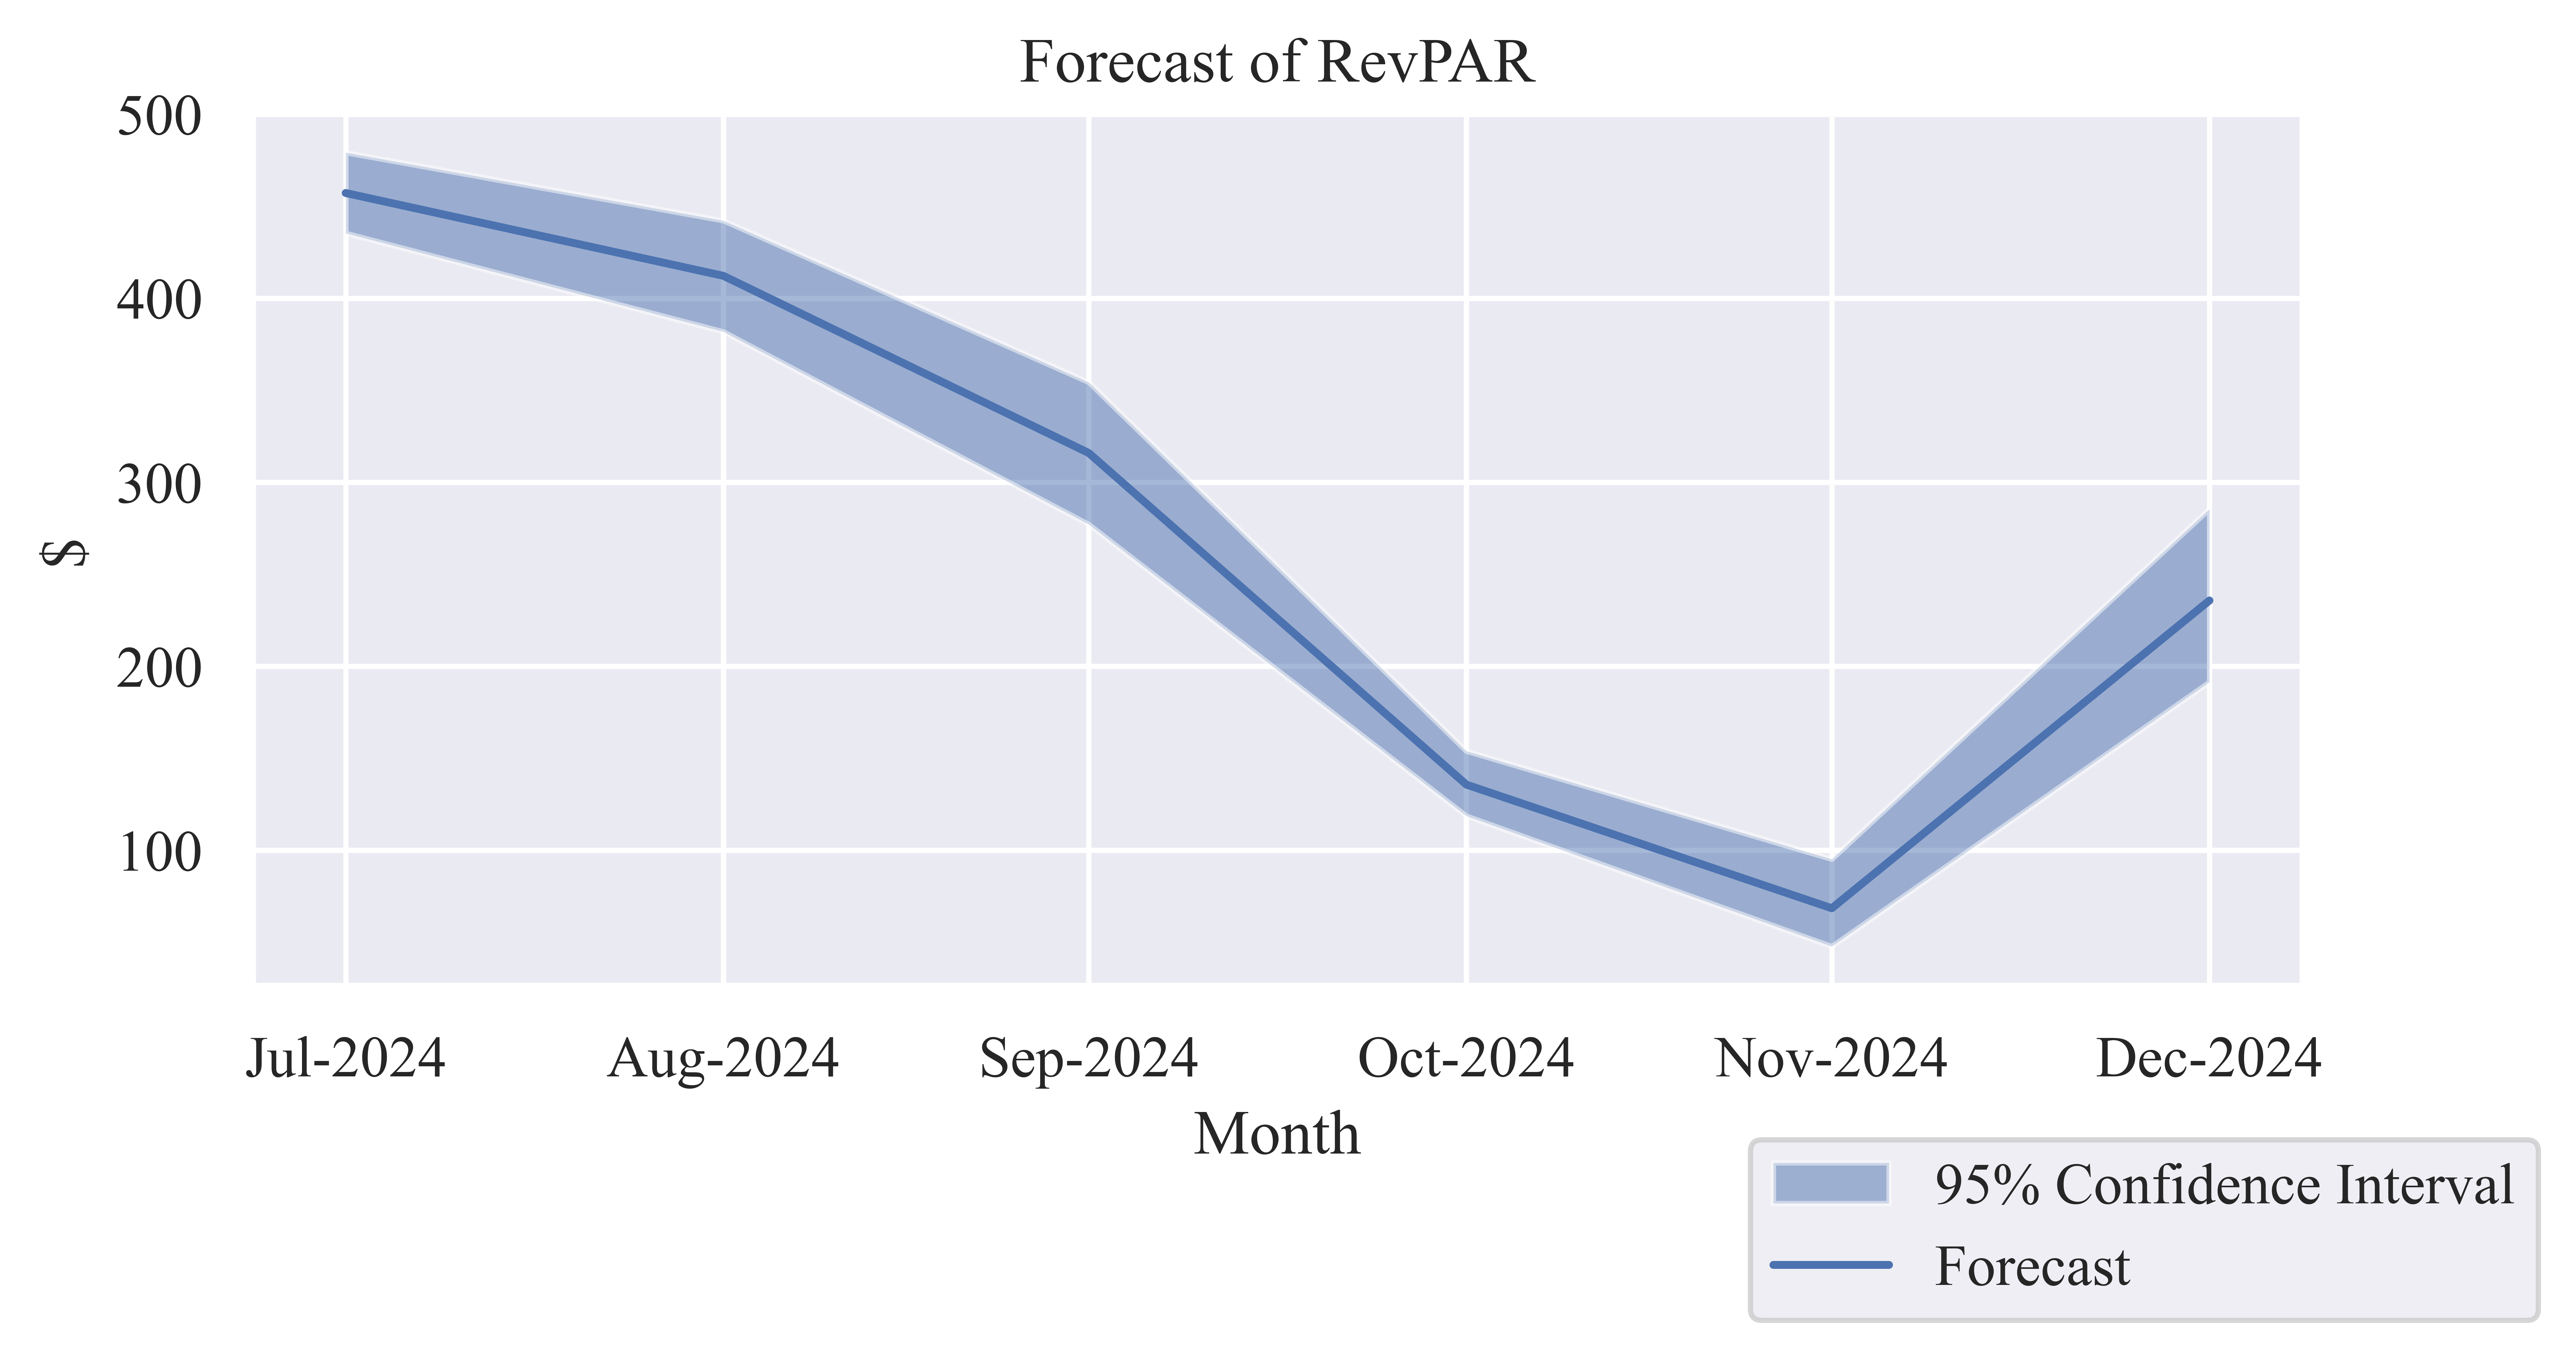
Revenue per Available Room (RevPAR)
Table 3: Forecast of Monthly RevPAR
| Jul-2024 |
$457.19 |
$435.36 |
$479.17 |
| Aug-2024 |
$412.19 |
$381.84 |
$442.17 |
| Sep-2024 |
$315.89 |
$277.10 |
$354.35 |
| Oct-2024 |
$135.66 |
$118.63 |
$153.86 |
| Nov-2024 |
$68.44 |
$47.72 |
$95.12 |
| Dec-2024 |
$235.72 |
$191.41 |
$285.42 |
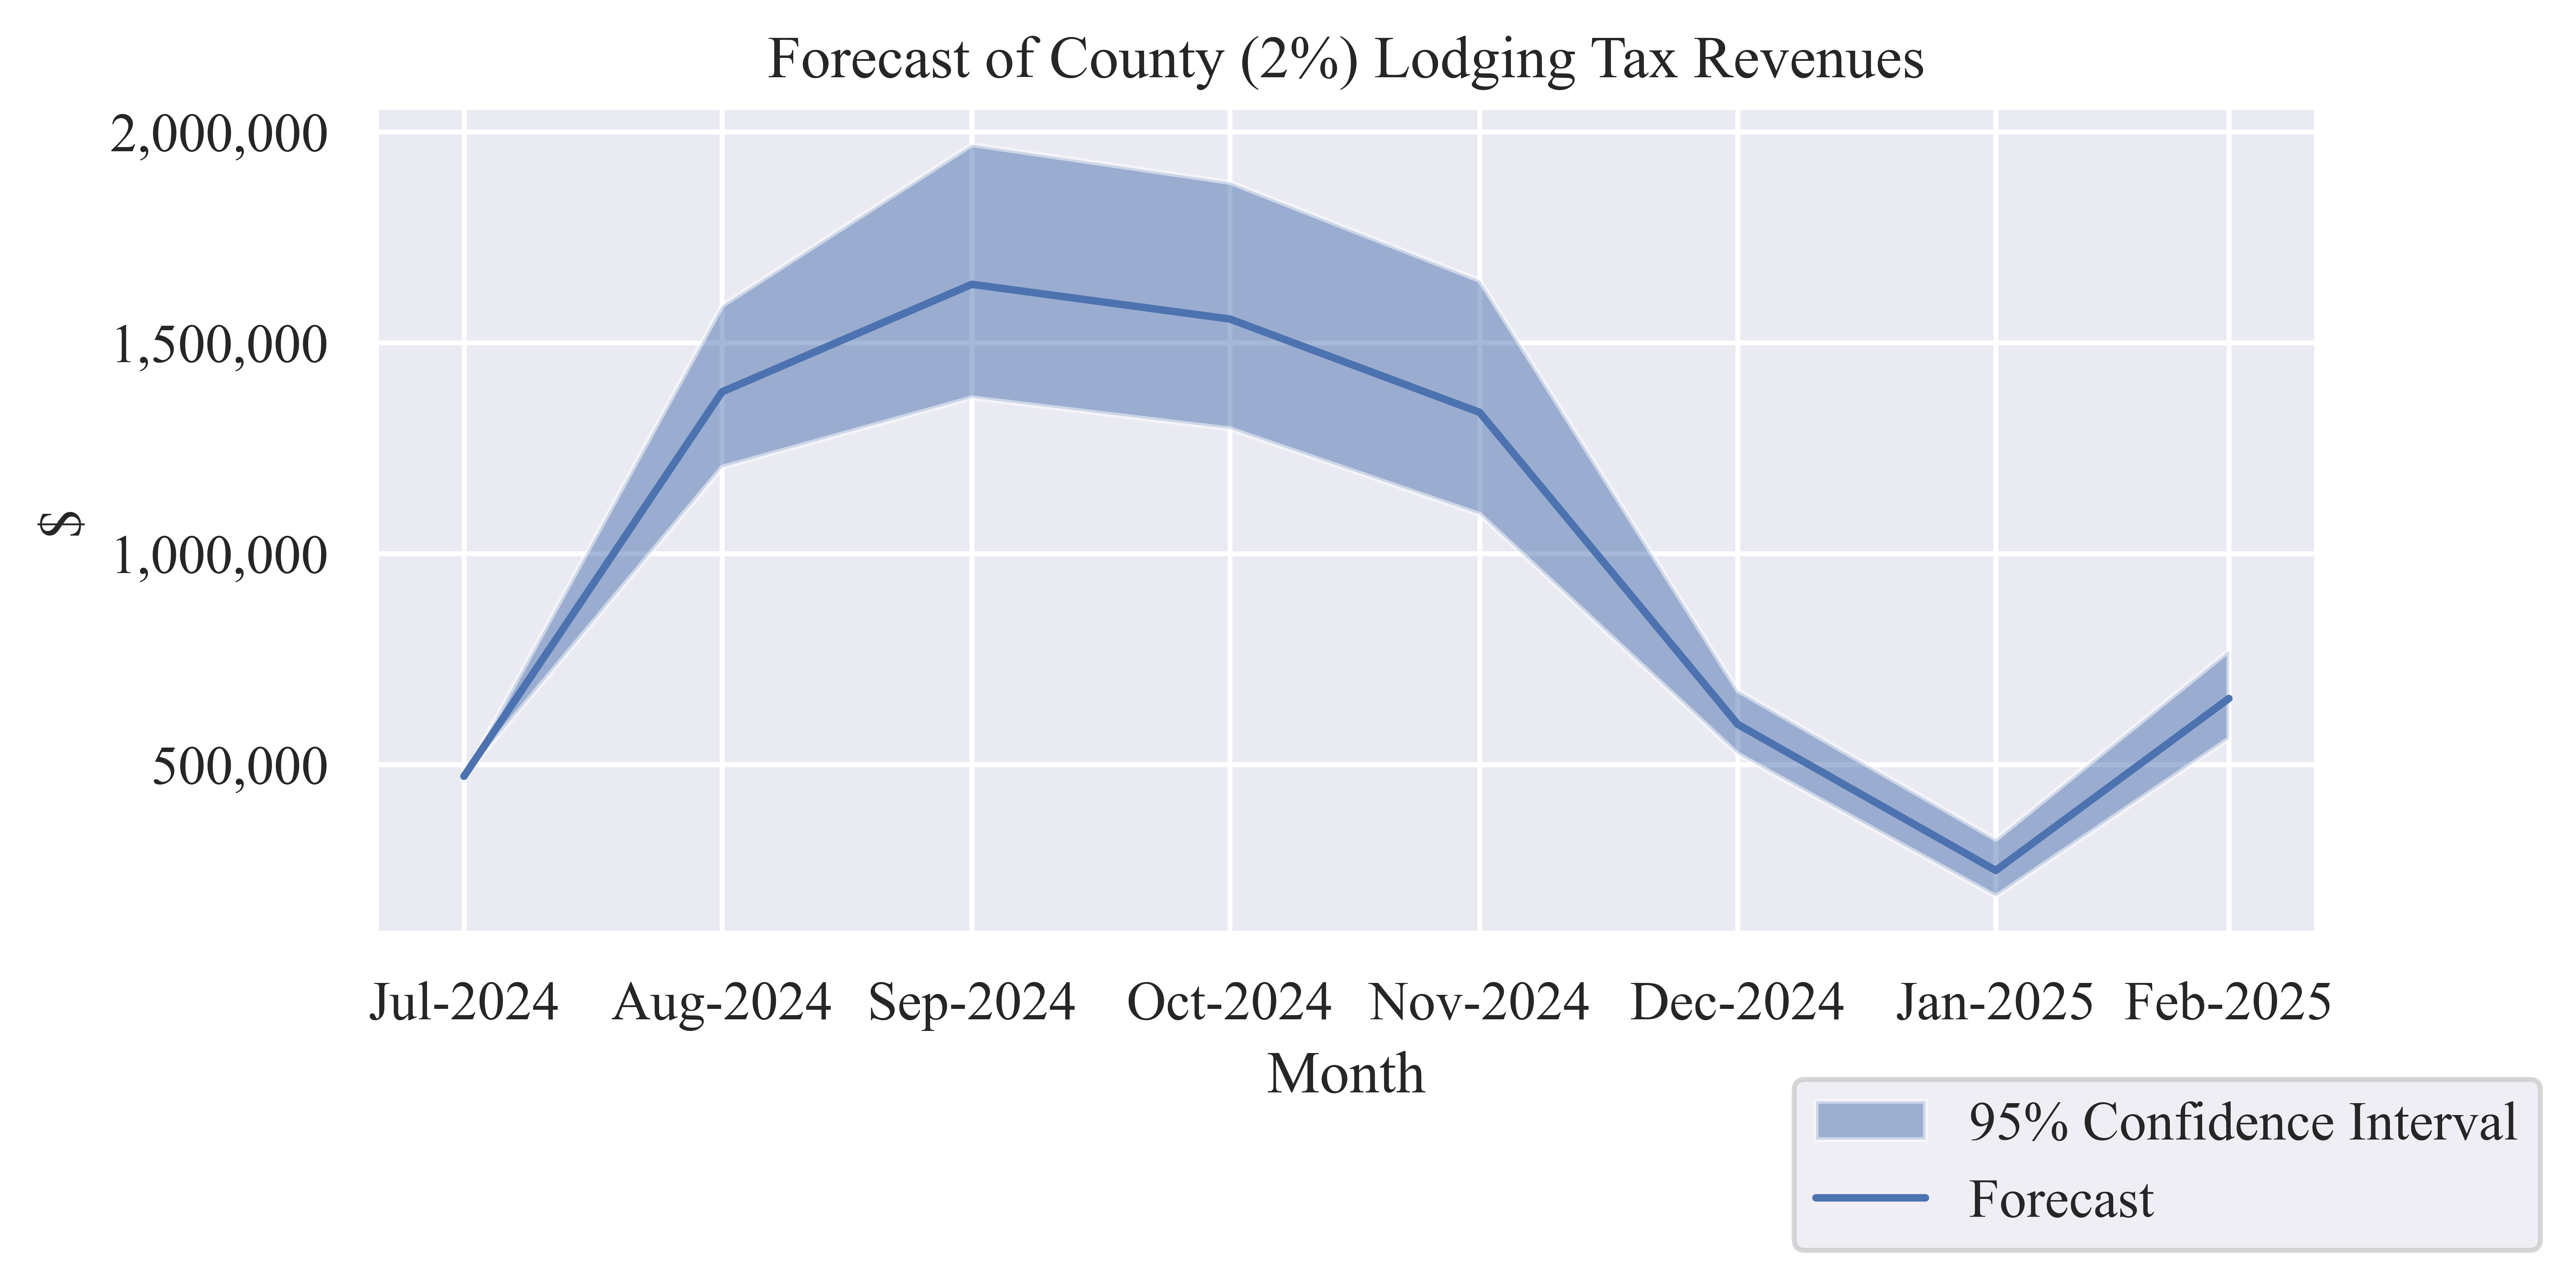
Tax Revenues
Table 4: Forecast County (2%) Lodging Tax Revenue
| Jul-2024 |
$472,152 |
$472,152 |
$472,152 |
| Aug-2024 |
$1,383,612 |
$1,205,142 |
$1,588,512 |
| Sep-2024 |
$1,638,588 |
$1,369,768 |
$1,970,106 |
| Oct-2024 |
$1,556,277 |
$1,296,192 |
$1,880,616 |
| Nov-2024 |
$1,335,067 |
$1,093,474 |
$1,648,034 |
| Dec-2024 |
$595,465 |
$525,131 |
$675,882 |
| Jan-2025 |
$248,935 |
$187,879 |
$323,015 |
| Feb-2025 |
$656,616 |
$561,509 |
$770,377 |
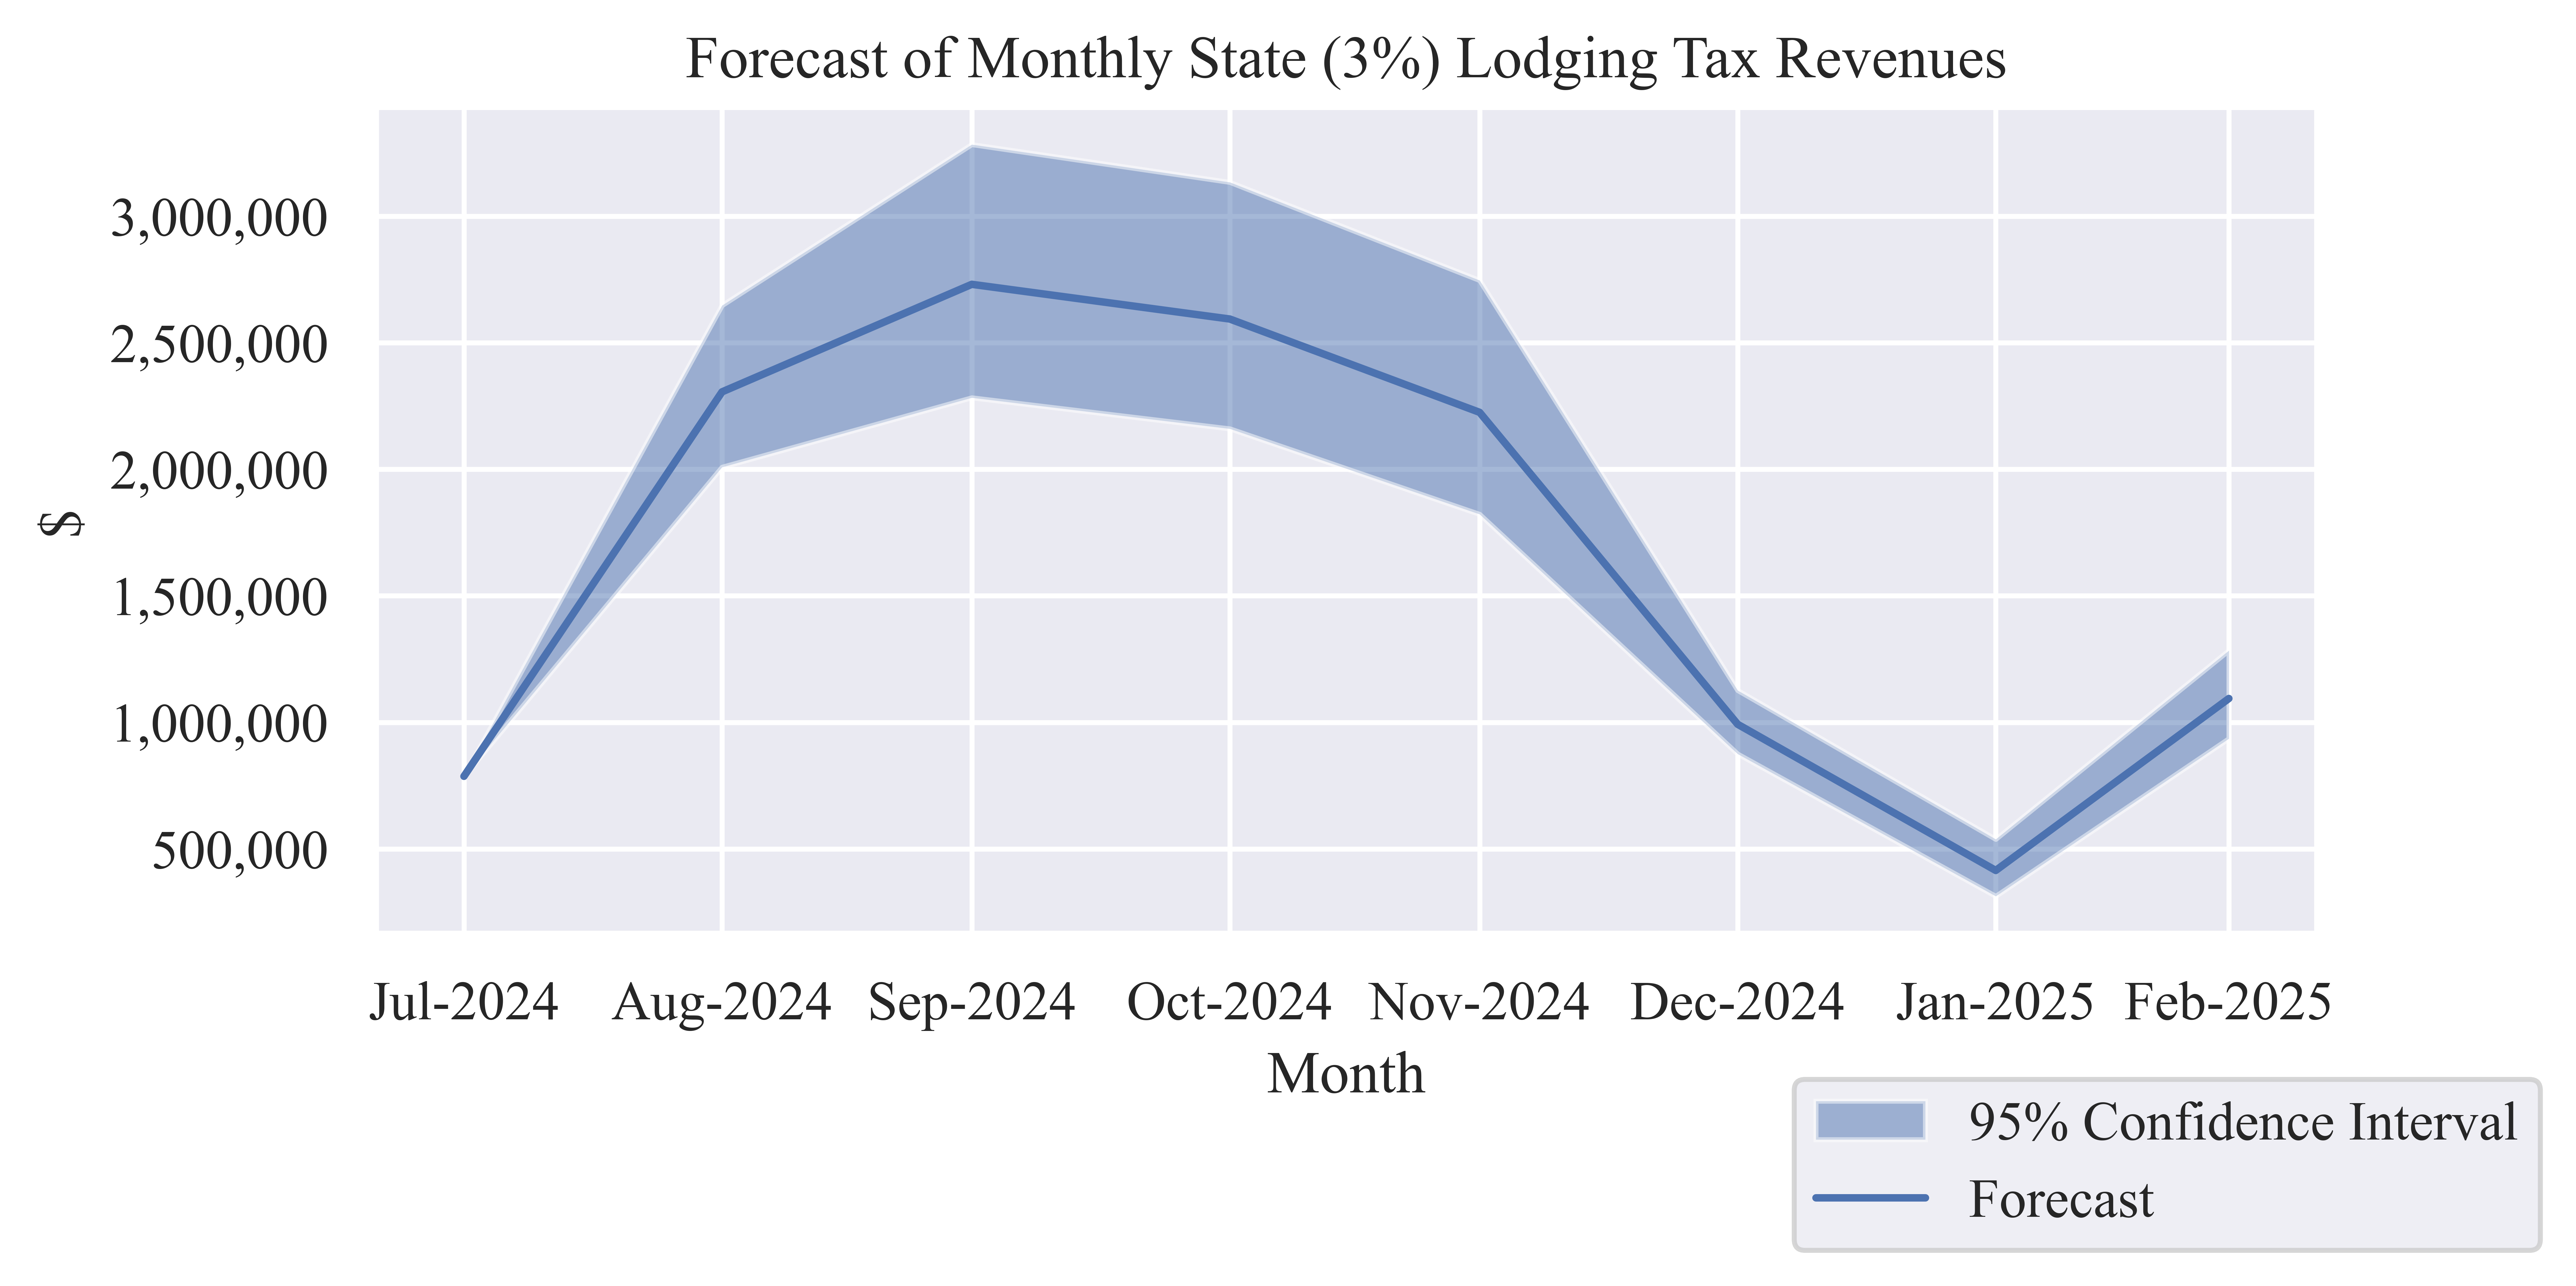
Table 5: Forecast State (3%) Lodging Tax Revenue
| Jul-2024 |
$786,920 |
$786,920 |
$786,920 |
| Aug-2024 |
$2,306,020 |
$2,008,570 |
$2,647,521 |
| Sep-2024 |
$2,730,979 |
$2,282,947 |
$3,283,510 |
| Oct-2024 |
$2,593,795 |
$2,160,320 |
$3,134,359 |
| Nov-2024 |
$2,225,111 |
$1,822,457 |
$2,746,724 |
| Dec-2024 |
$992,442 |
$875,219 |
$1,126,470 |
| Jan-2025 |
$414,892 |
$313,132 |
$538,358 |
| Feb-2025 |
$1,094,359 |
$935,849 |
$1,283,961 |
Table 6: Forecast of Monthly Total (5%) Lodging Tax Revenue
| Jul-2024 |
$1,259,073 |
$1,259,073 |
$1,259,073 |
| Aug-2024 |
$3,689,633 |
$3,213,712 |
$4,236,033 |
| Sep-2024 |
$4,369,567 |
$3,652,716 |
$5,253,615 |
| Oct-2024 |
$4,150,071 |
$3,456,512 |
$5,014,975 |
| Nov-2024 |
$3,560,178 |
$2,915,932 |
$4,394,758 |
| Dec-2024 |
$1,587,907 |
$1,400,350 |
$1,802,351 |
| Jan-2025 |
$663,827 |
$501,010 |
$861,373 |
| Feb-2025 |
$1,750,975 |
$1,497,358 |
$2,054,338 |
Lodging Sector Sales
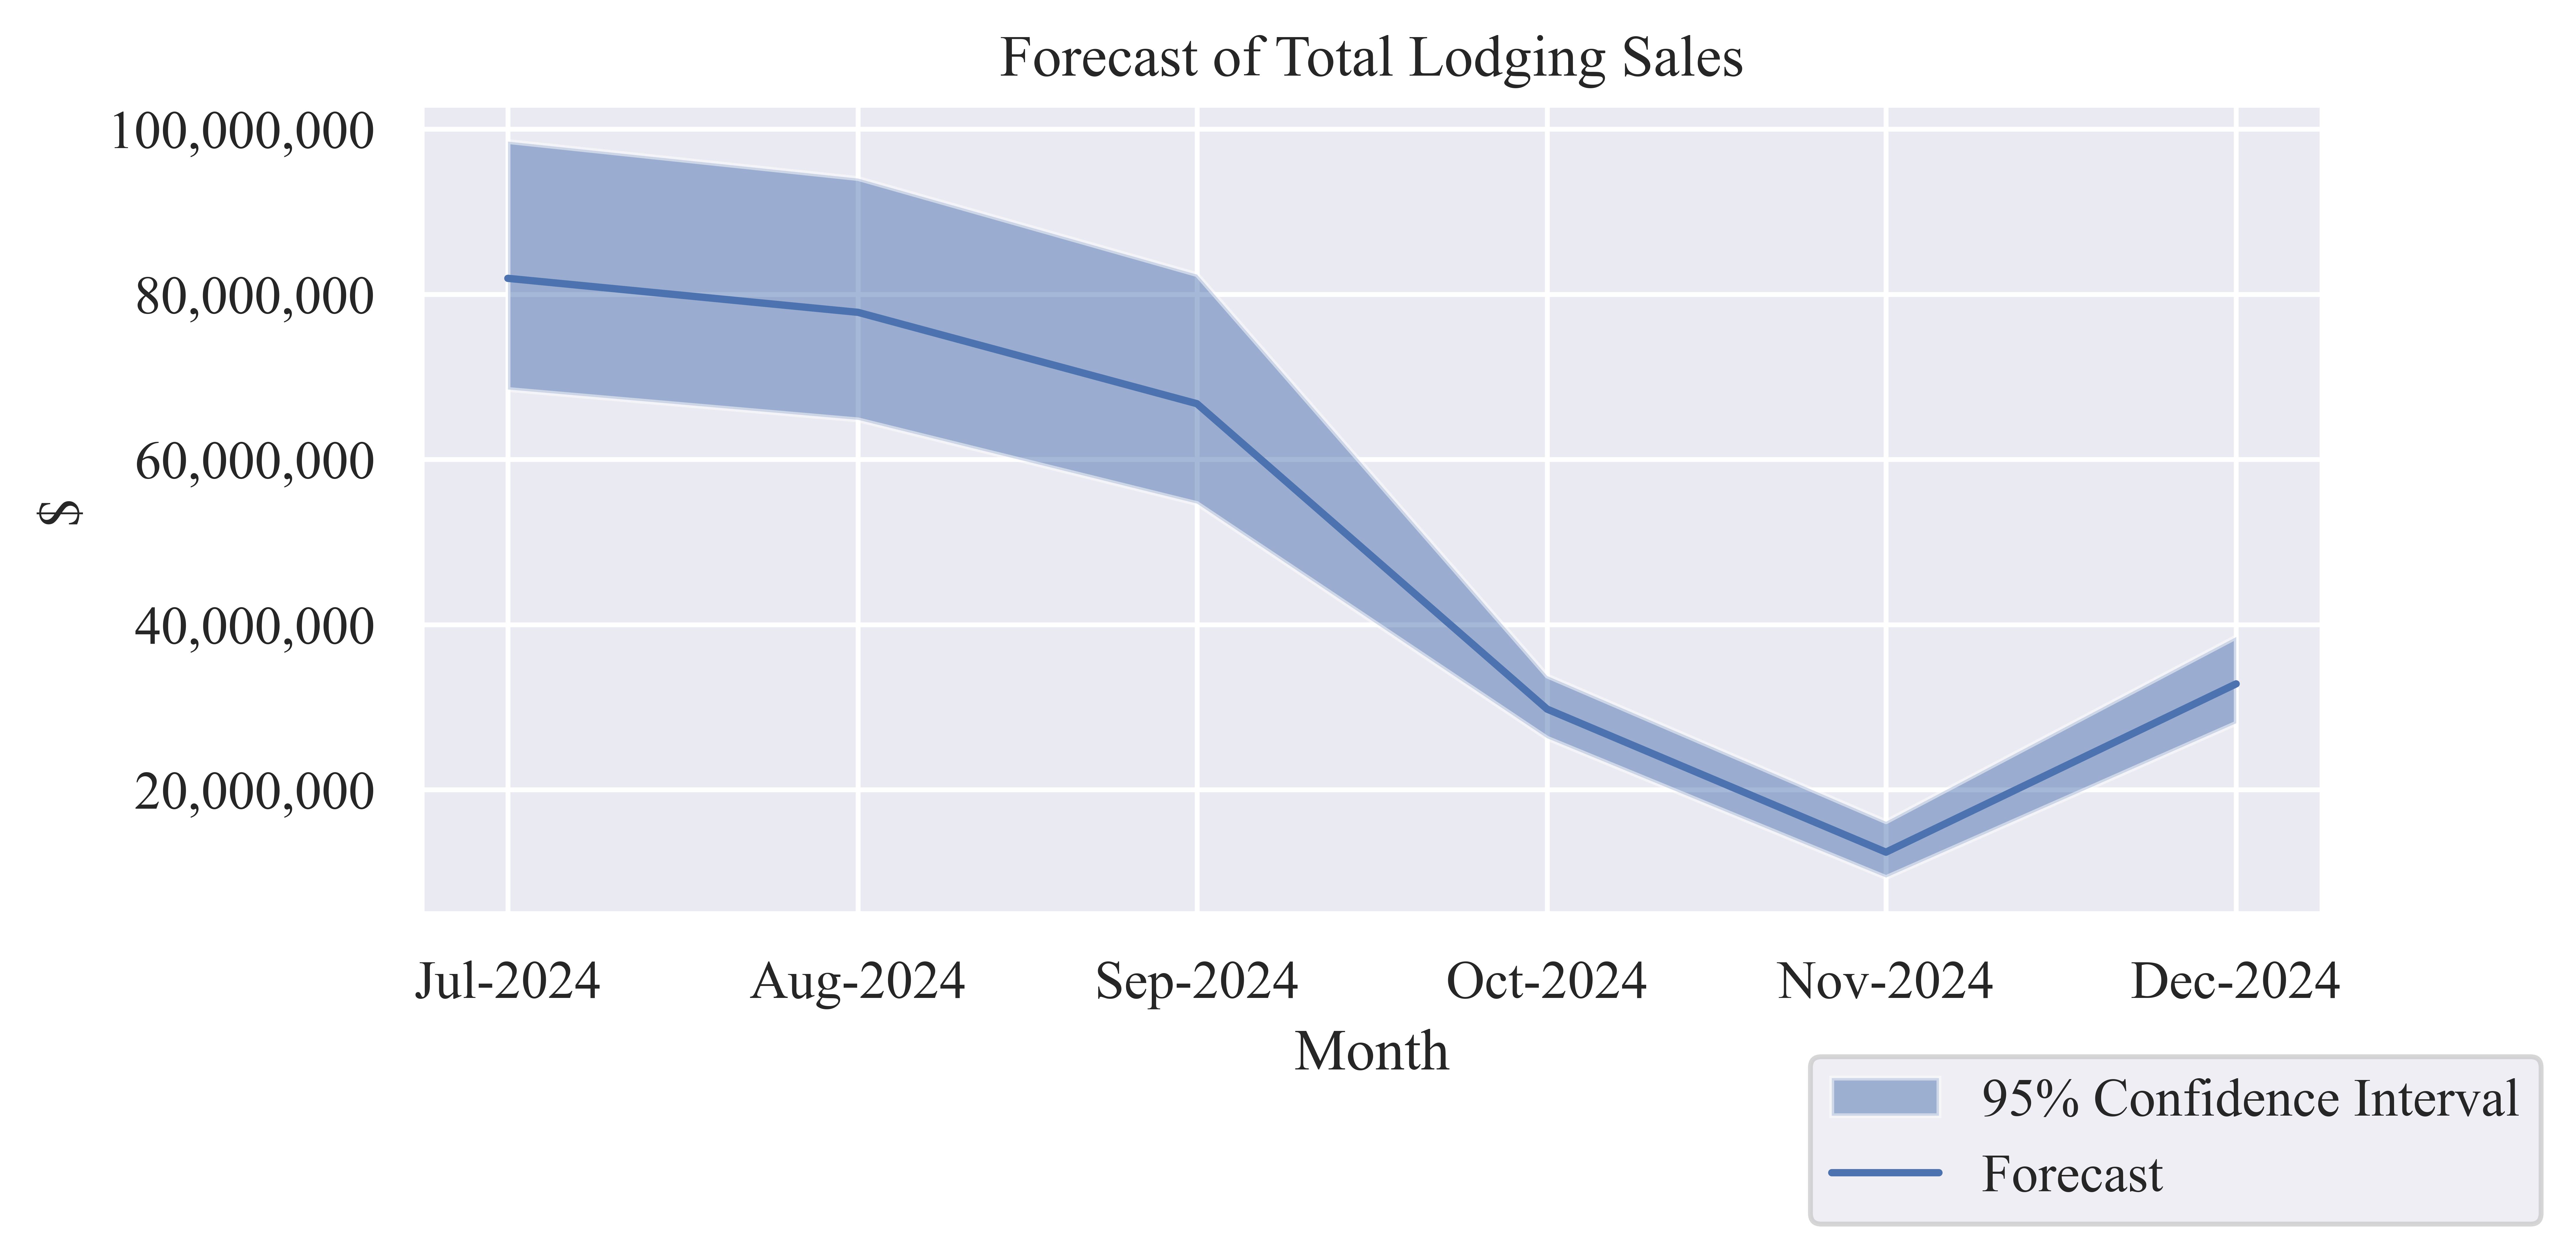
Table 7: Forecast of Monthly Lodging Sales
| Jul-2024 |
$81,929,383 |
$68,488,417 |
$98,505,289 |
| Aug-2024 |
$77,813,838 |
$64,809,591 |
$94,030,780 |
| Sep-2024 |
$66,753,330 |
$54,673,724 |
$82,401,711 |
| Oct-2024 |
$29,773,248 |
$26,256,559 |
$33,794,087 |
| Nov-2024 |
$12,446,755 |
$9,393,946 |
$16,150,747 |
| Dec-2024 |
$32,830,780 |
$28,075,469 |
$38,518,836 |
Economic Indicators
Table 8: Six-Month Forecast of Economic Output from Lodging Sales
| Low Estimate |
$251,697,707 |
$54,315,179 |
$13,668,965 |
$319,681,850 |
| Median Estimate |
$301,547,334 |
$65,072,497 |
$16,376,163 |
$382,995,994 |
| High Estimate |
$363,401,449 |
$78,420,336 |
$19,735,293 |
$461,557,079 |
Table 9: Six-Month Forecast of Employee Compensation from Lodging Sales
| Low Estimate |
$81,407,912 |
$18,300,756 |
$3,770,727 |
$103,479,395 |
| Median Estimate |
$97,531,039 |
$21,925,287 |
$4,517,536 |
$123,973,862 |
| High Estimate |
$117,536,841 |
$26,422,658 |
$5,444,187 |
$149,403,686 |
Table 10: Six-Month Forecast of Contribution to Gross County Product from Lodging
Sales
| Low Estimate |
$182,089,548 |
$31,921,433 |
$8,246,042 |
$222,257,023 |
| Median Estimate |
$218,153,032 |
$38,243,588 |
$9,879,207 |
$266,275,827 |
| High Estimate |
$262,901,107 |
$46,088,212 |
$11,905,660 |
$320,894,980 |
Table 11: Six-Month Forecast of Employment from Lodging Sales
| Low Estimate |
3,198 |
514 |
142 |
3,854 |
| Median Estimate |
3,831 |
615 |
171 |
4,617 |
| High Estimate |
4,617 |
741 |
206 |
5,564 |
