Jackson Hole Economic Forecasting
September 2024 Forecast
Occupancy Rate (OR)
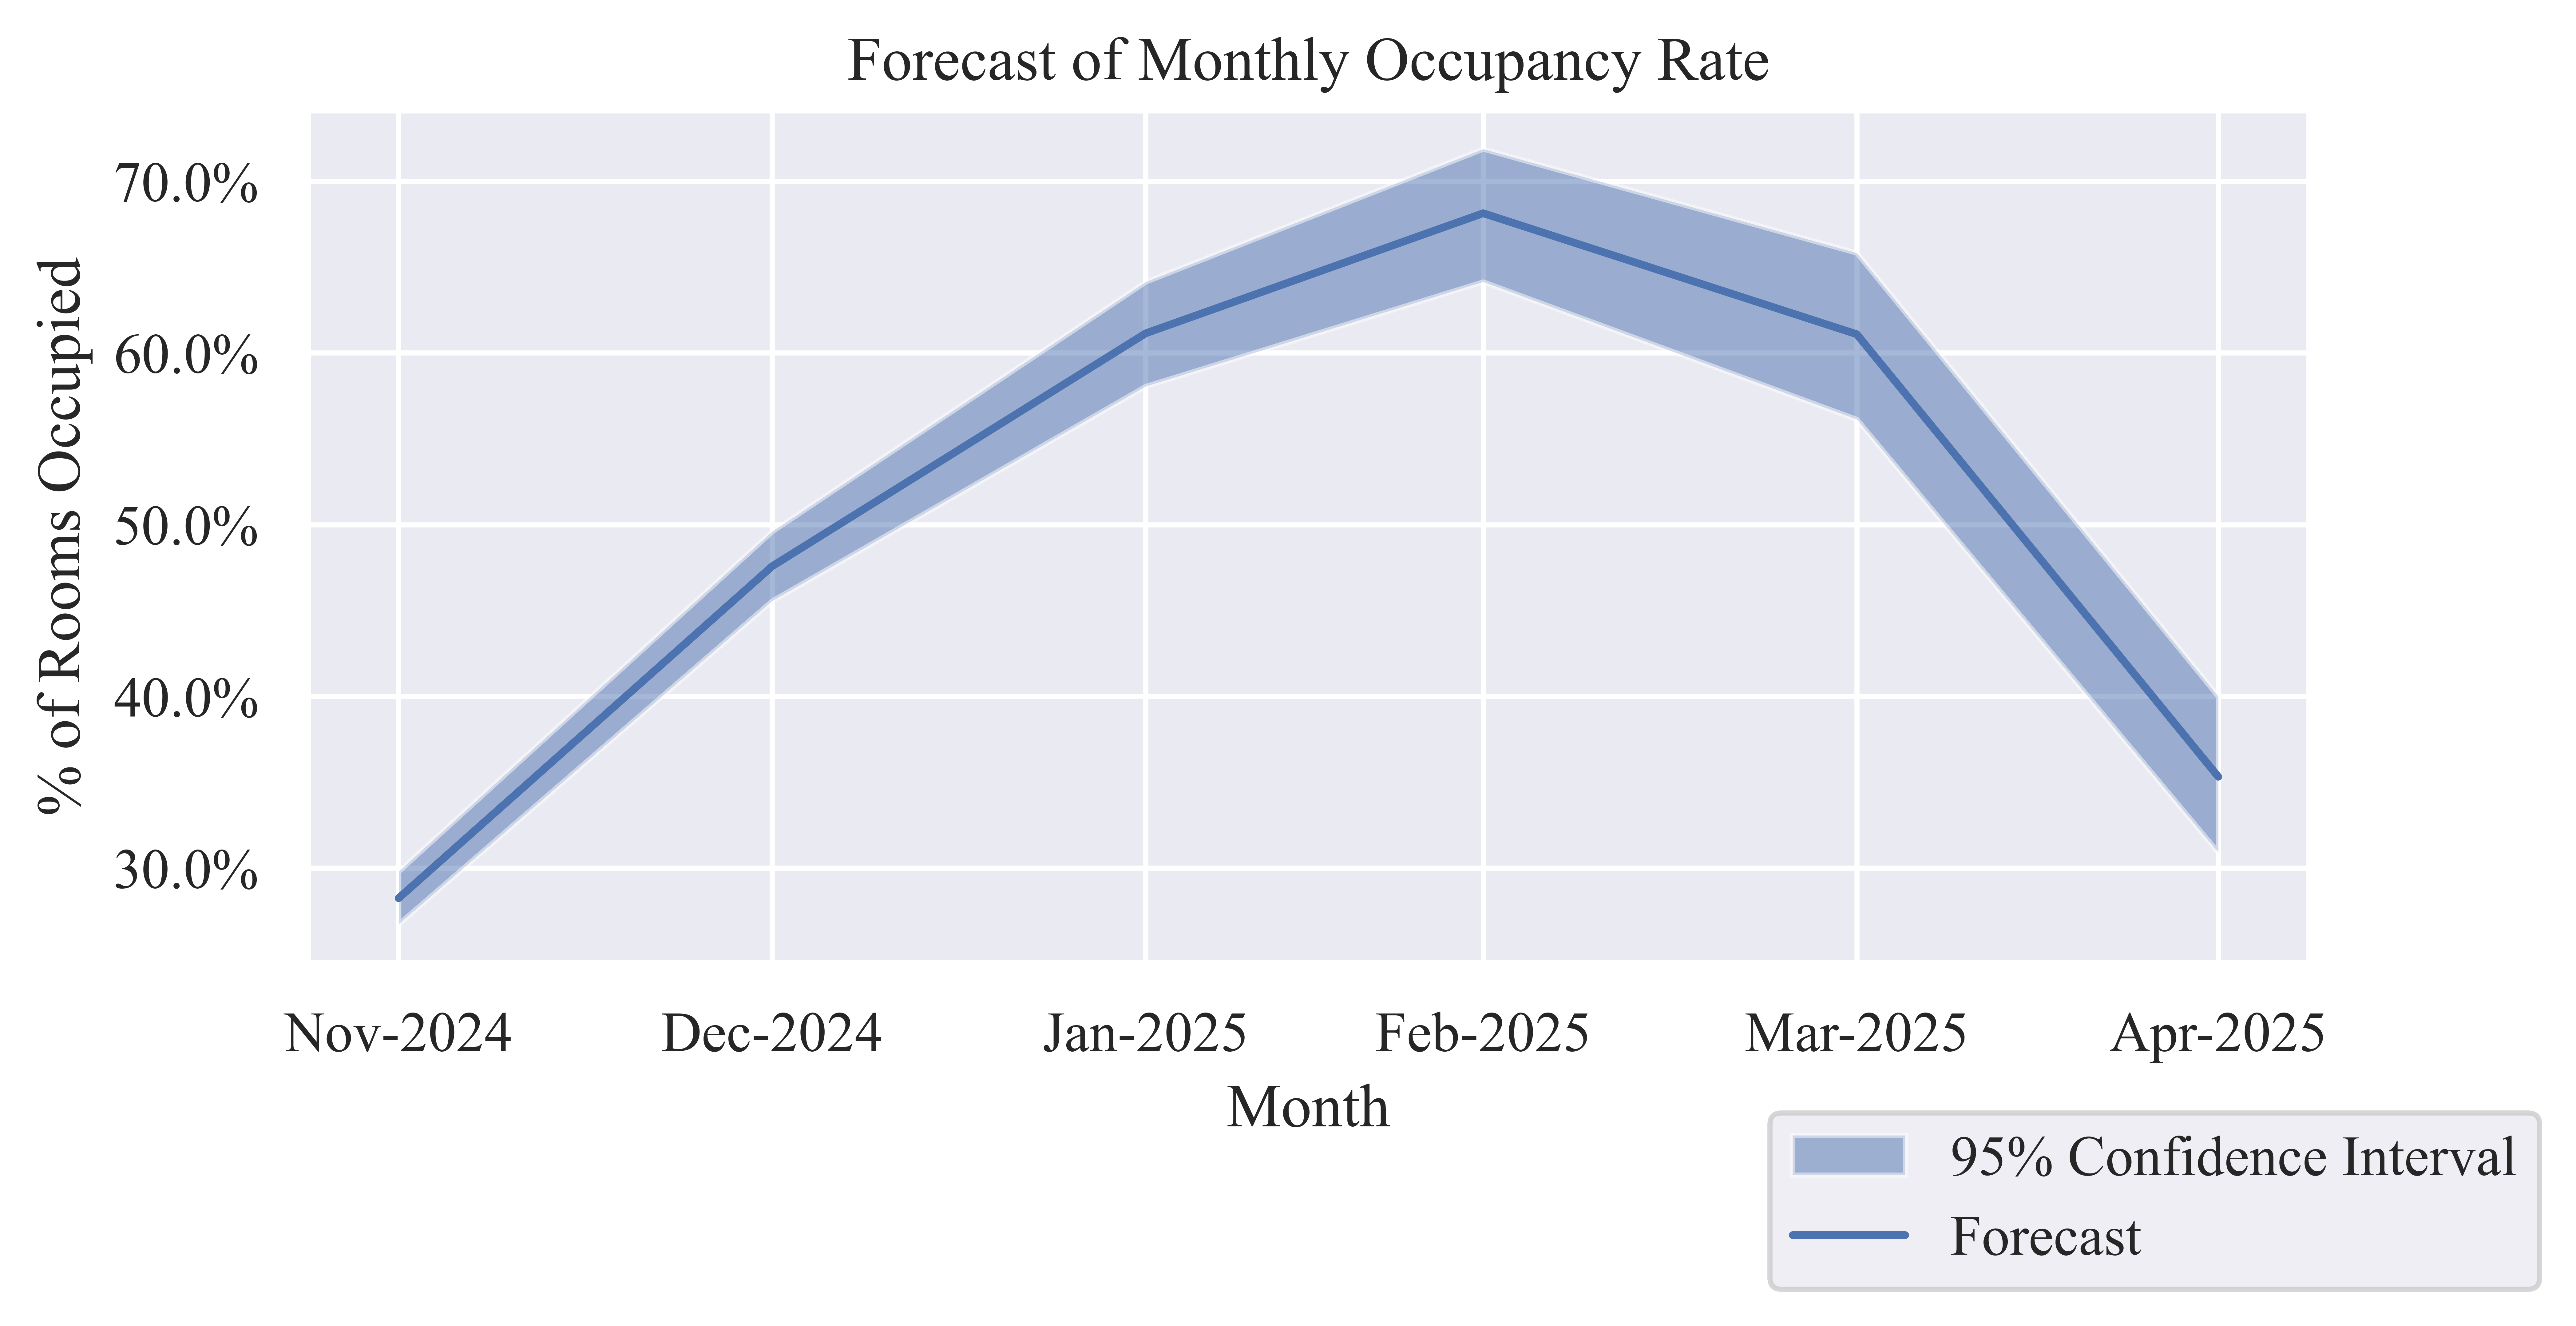
Table 1: Forecast of Monthly Occupancy Rate
| Nov-2024 |
28.24% |
26.74% |
29.80% |
| Dec-2024 |
47.58% |
45.56% |
49.60% |
| Jan-2025 |
61.14% |
58.06% |
64.14% |
| Feb-2025 |
68.14% |
64.14% |
71.88% |
| Mar-2025 |
61.09% |
56.14% |
65.83% |
| Apr-2025 |
35.32% |
30.91% |
39.99% |
Average Daily Rate (ADR)
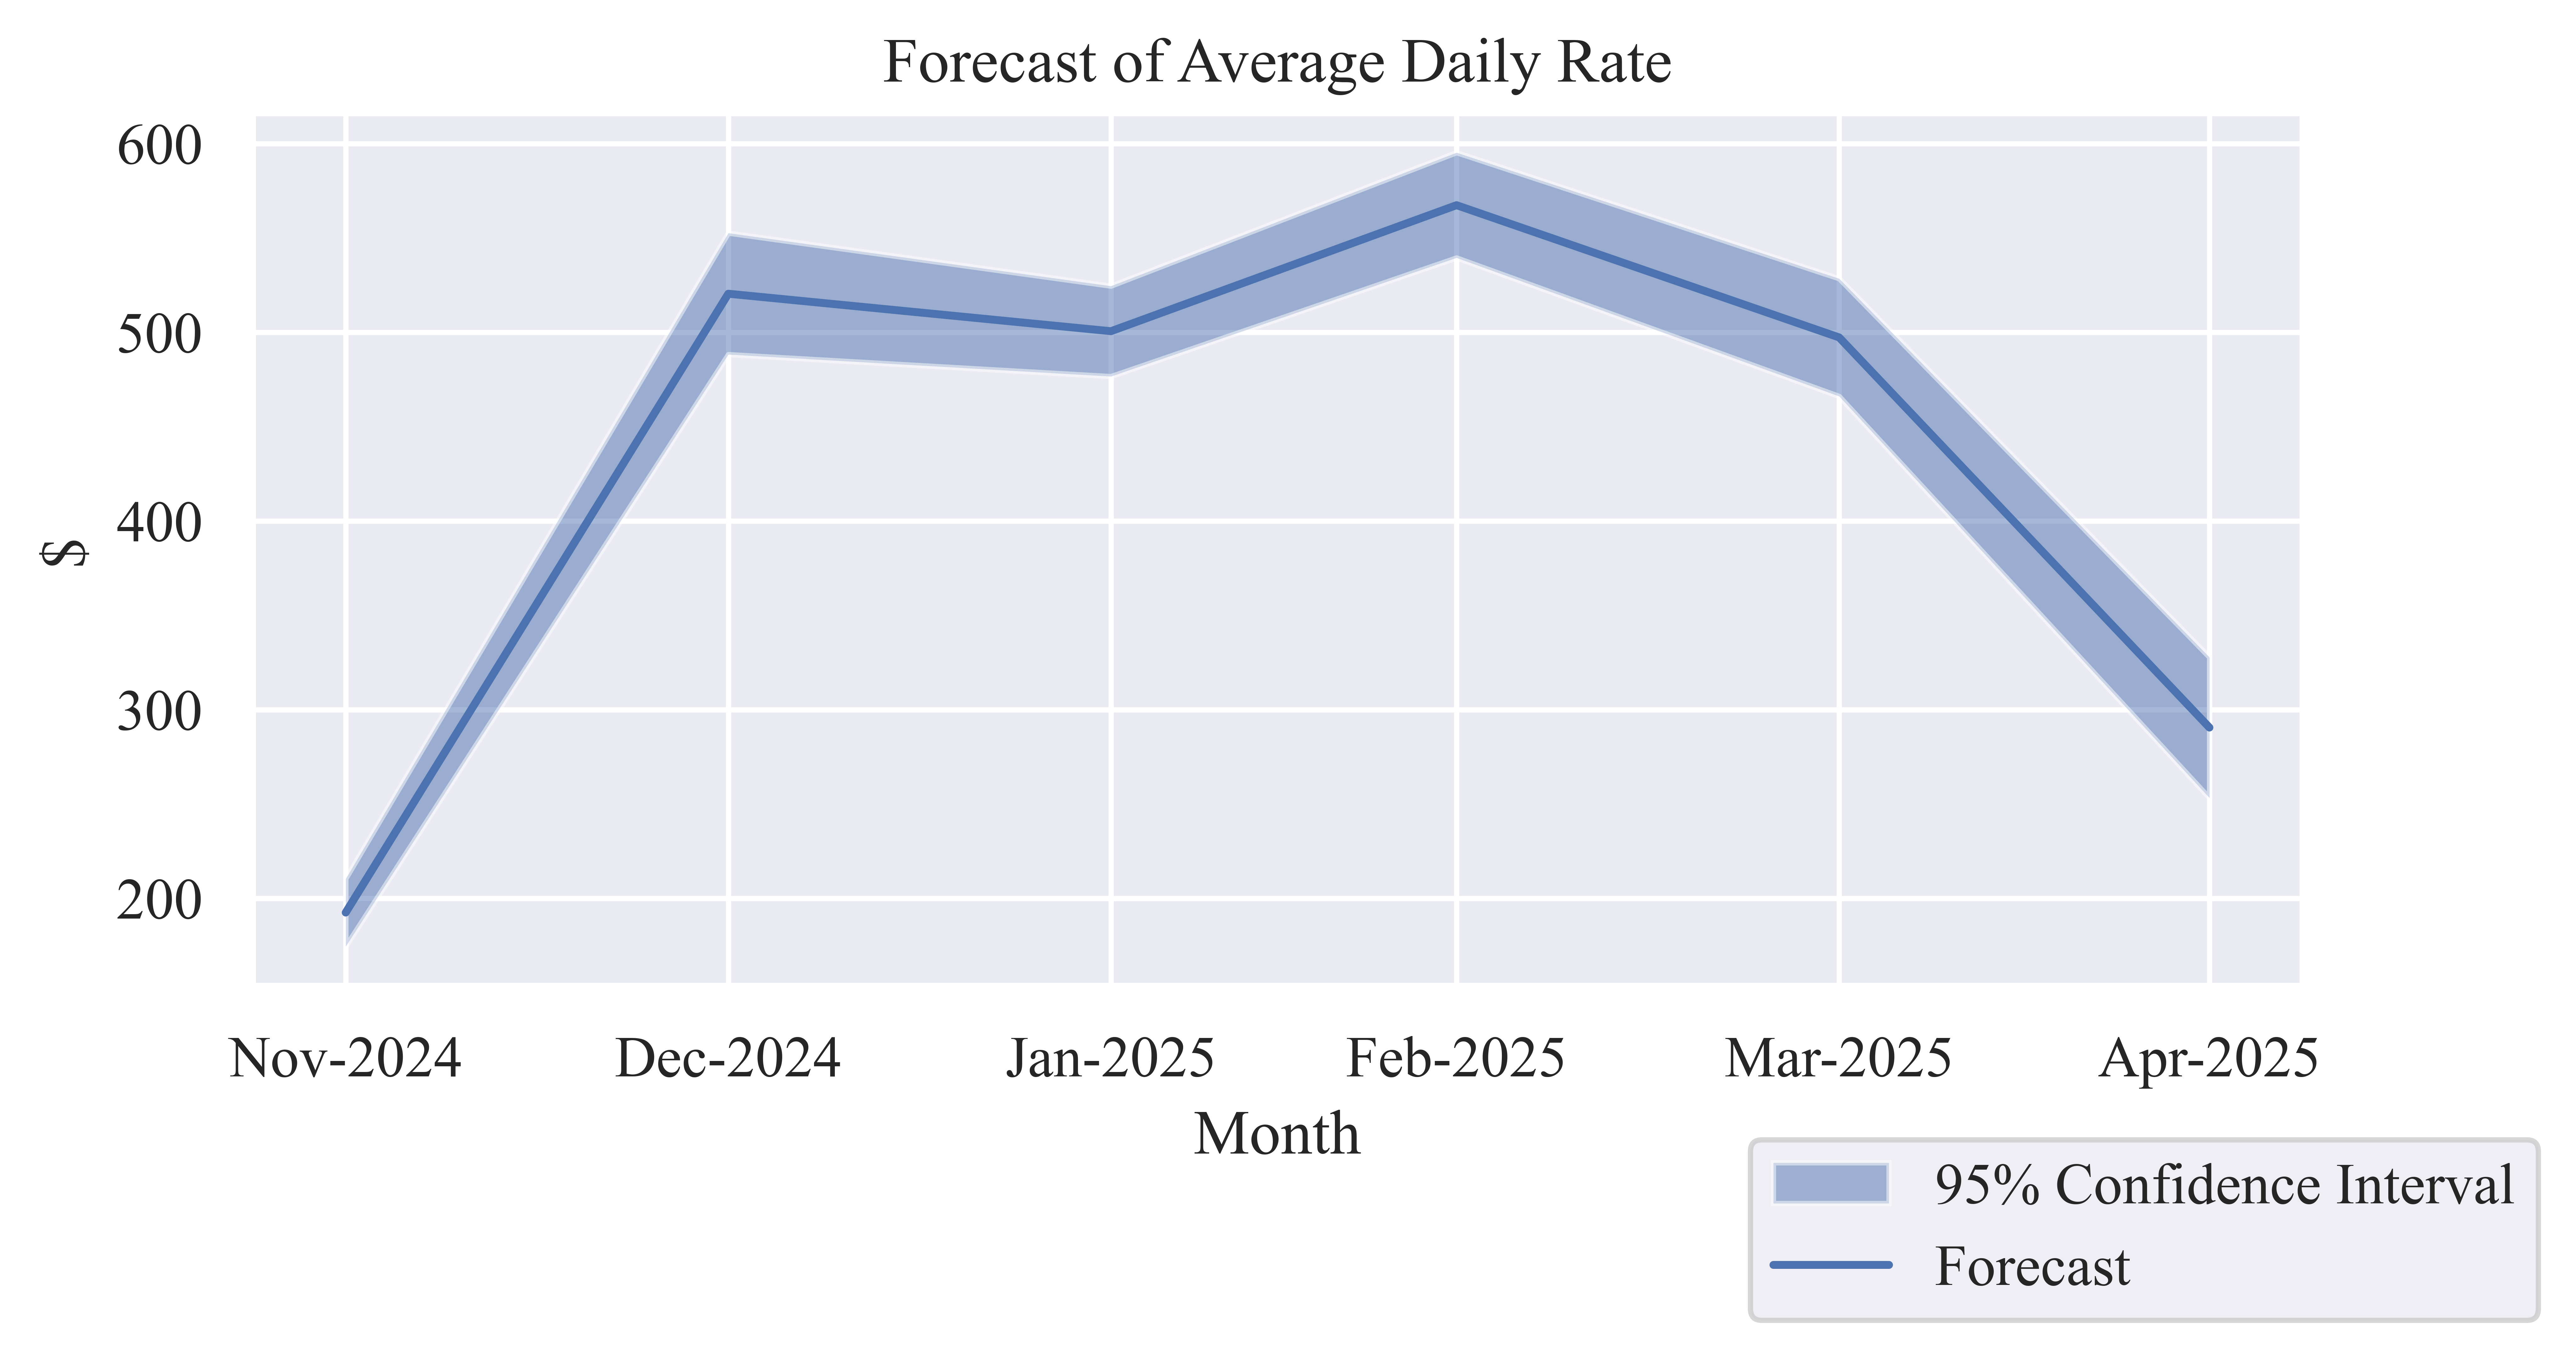
Table 2: Forecast of Monthly Average Daily Rate
| Nov-2024 |
$192.42 |
$174.50 |
$210.35 |
| Dec-2024 |
$520.39 |
$488.22 |
$552.56 |
| Jan-2025 |
$500.53 |
$476.58 |
$524.48 |
| Feb-2025 |
$567.32 |
$539.44 |
$595.20 |
| Mar-2025 |
$497.23 |
$466.05 |
$528.41 |
| Apr-2025 |
$290.47 |
$253.19 |
$327.74 |
Revenue per Available Room (RevPAR)
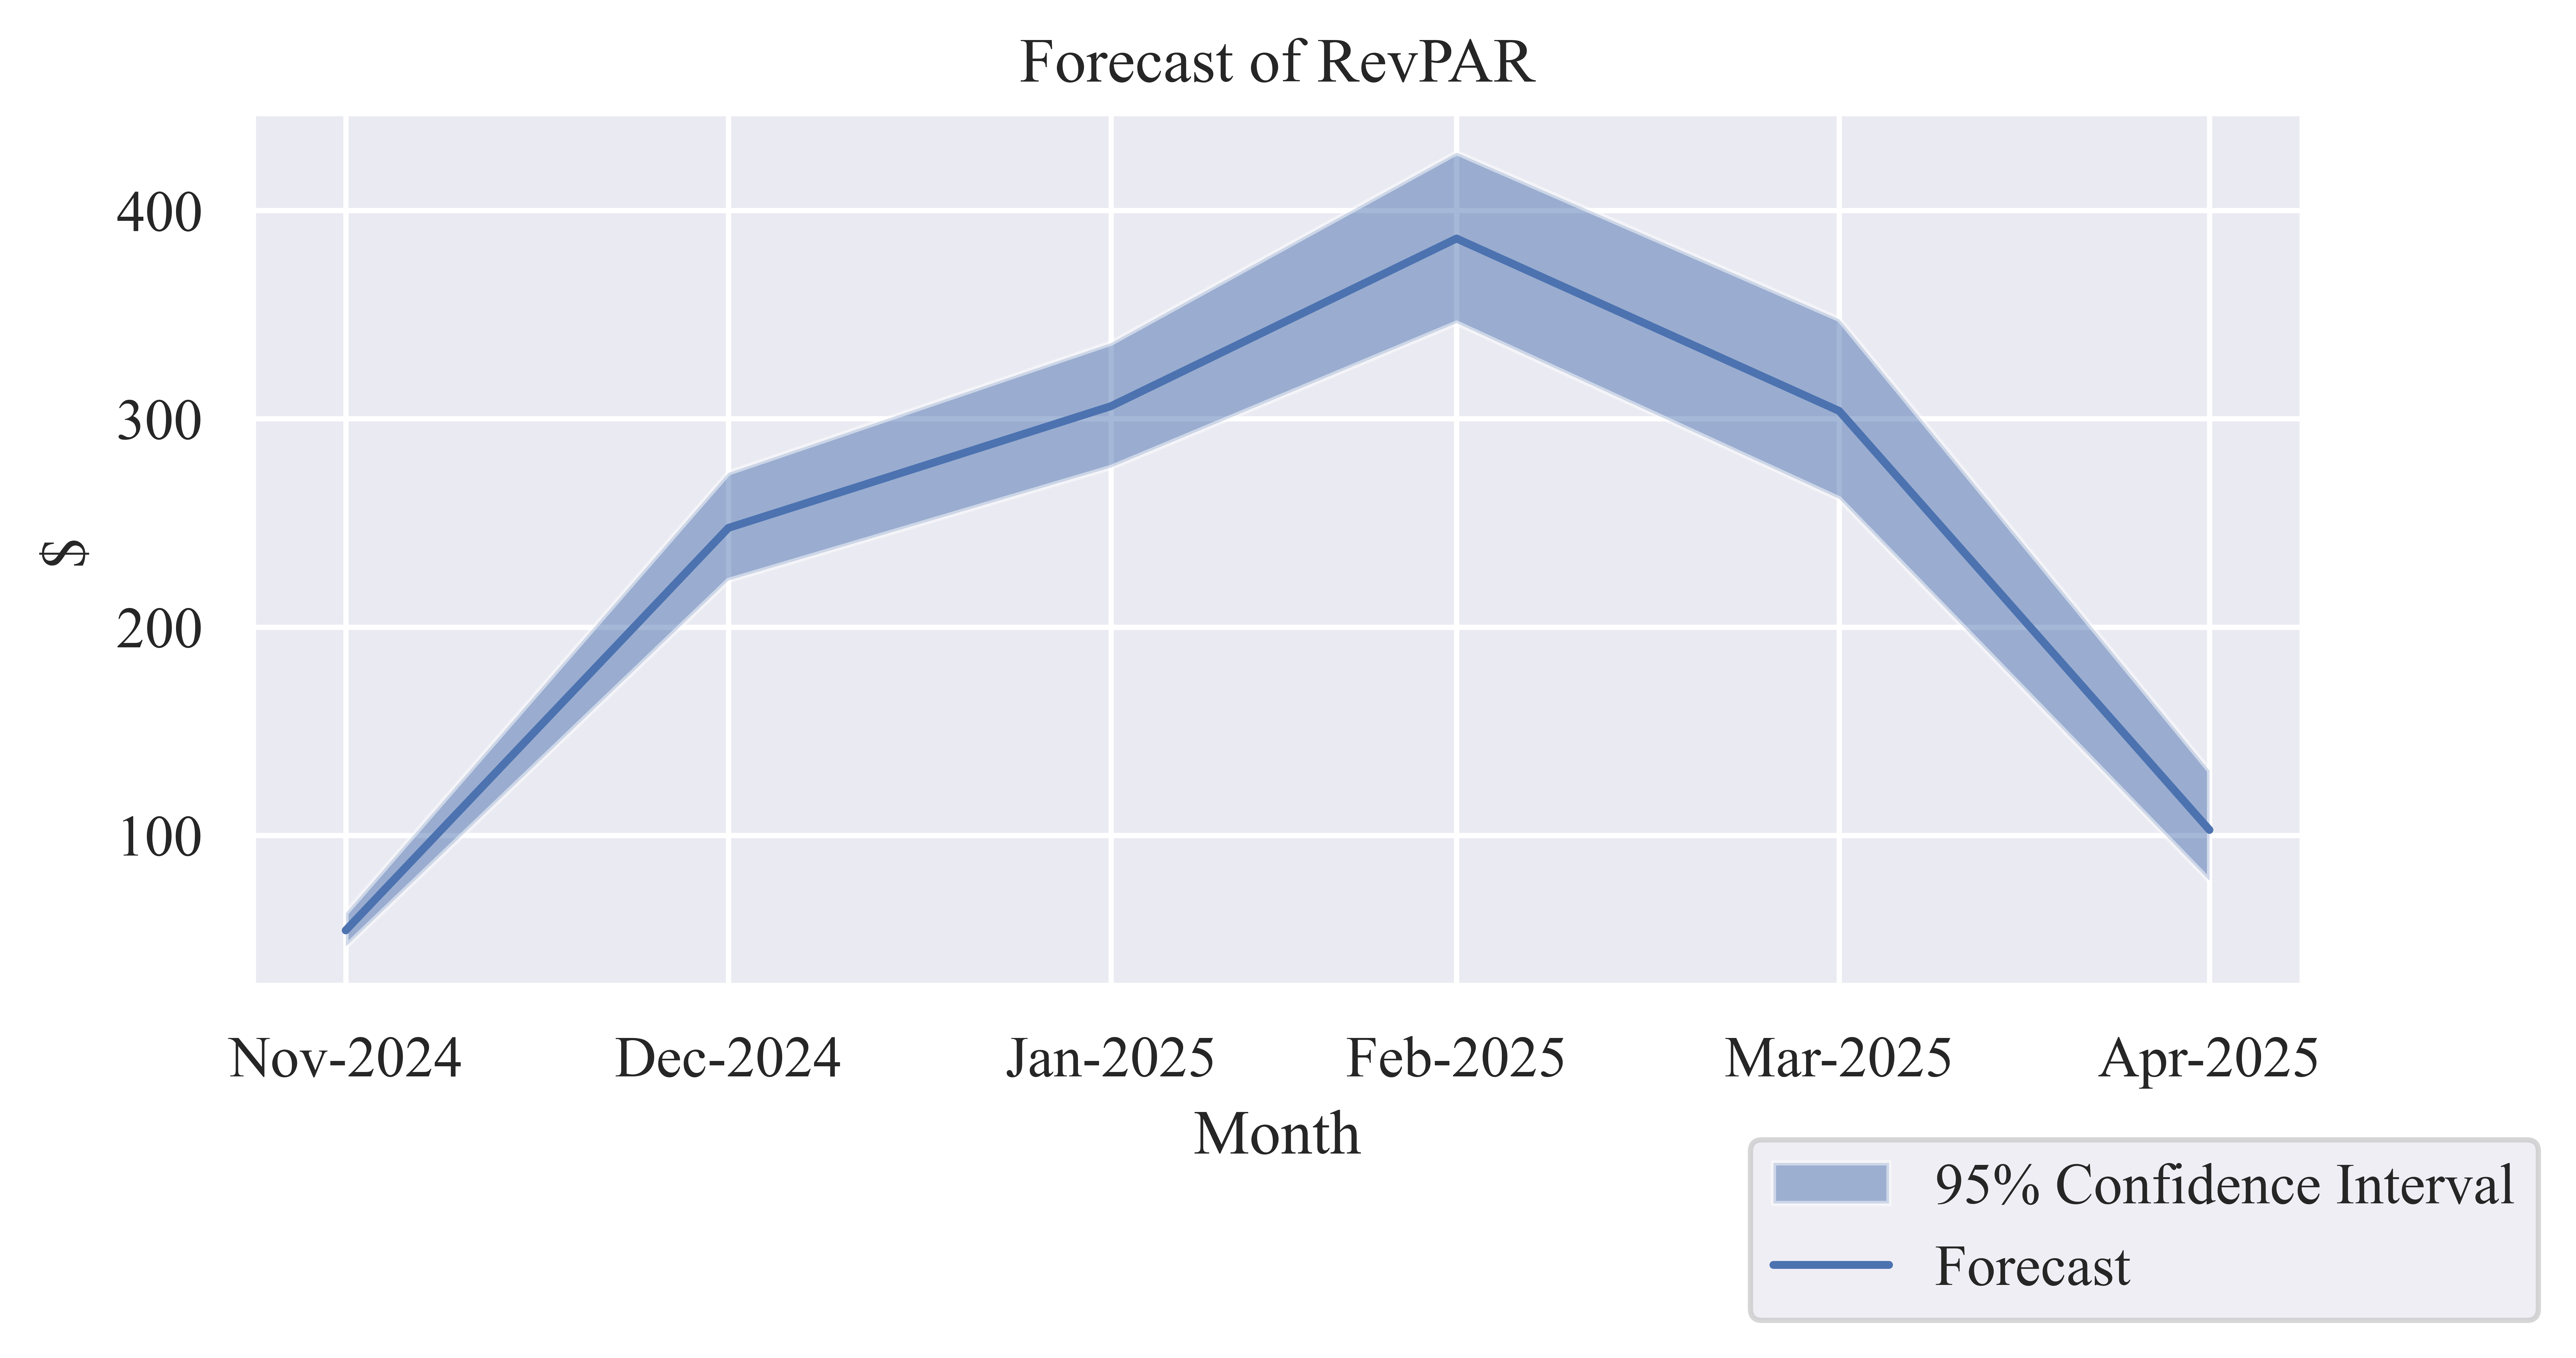
Table 3: Forecast of Monthly RevPAR
| Nov-2024 |
$54.35 |
$46.65 |
$62.68 |
| Dec-2024 |
$247.59 |
$222.45 |
$274.08 |
| Jan-2025 |
$306.04 |
$276.70 |
$336.41 |
| Feb-2025 |
$386.55 |
$346.02 |
$427.82 |
| Mar-2025 |
$303.77 |
$261.63 |
$347.84 |
| Apr-2025 |
$102.58 |
$78.25 |
$131.07 |
Tax Revenues
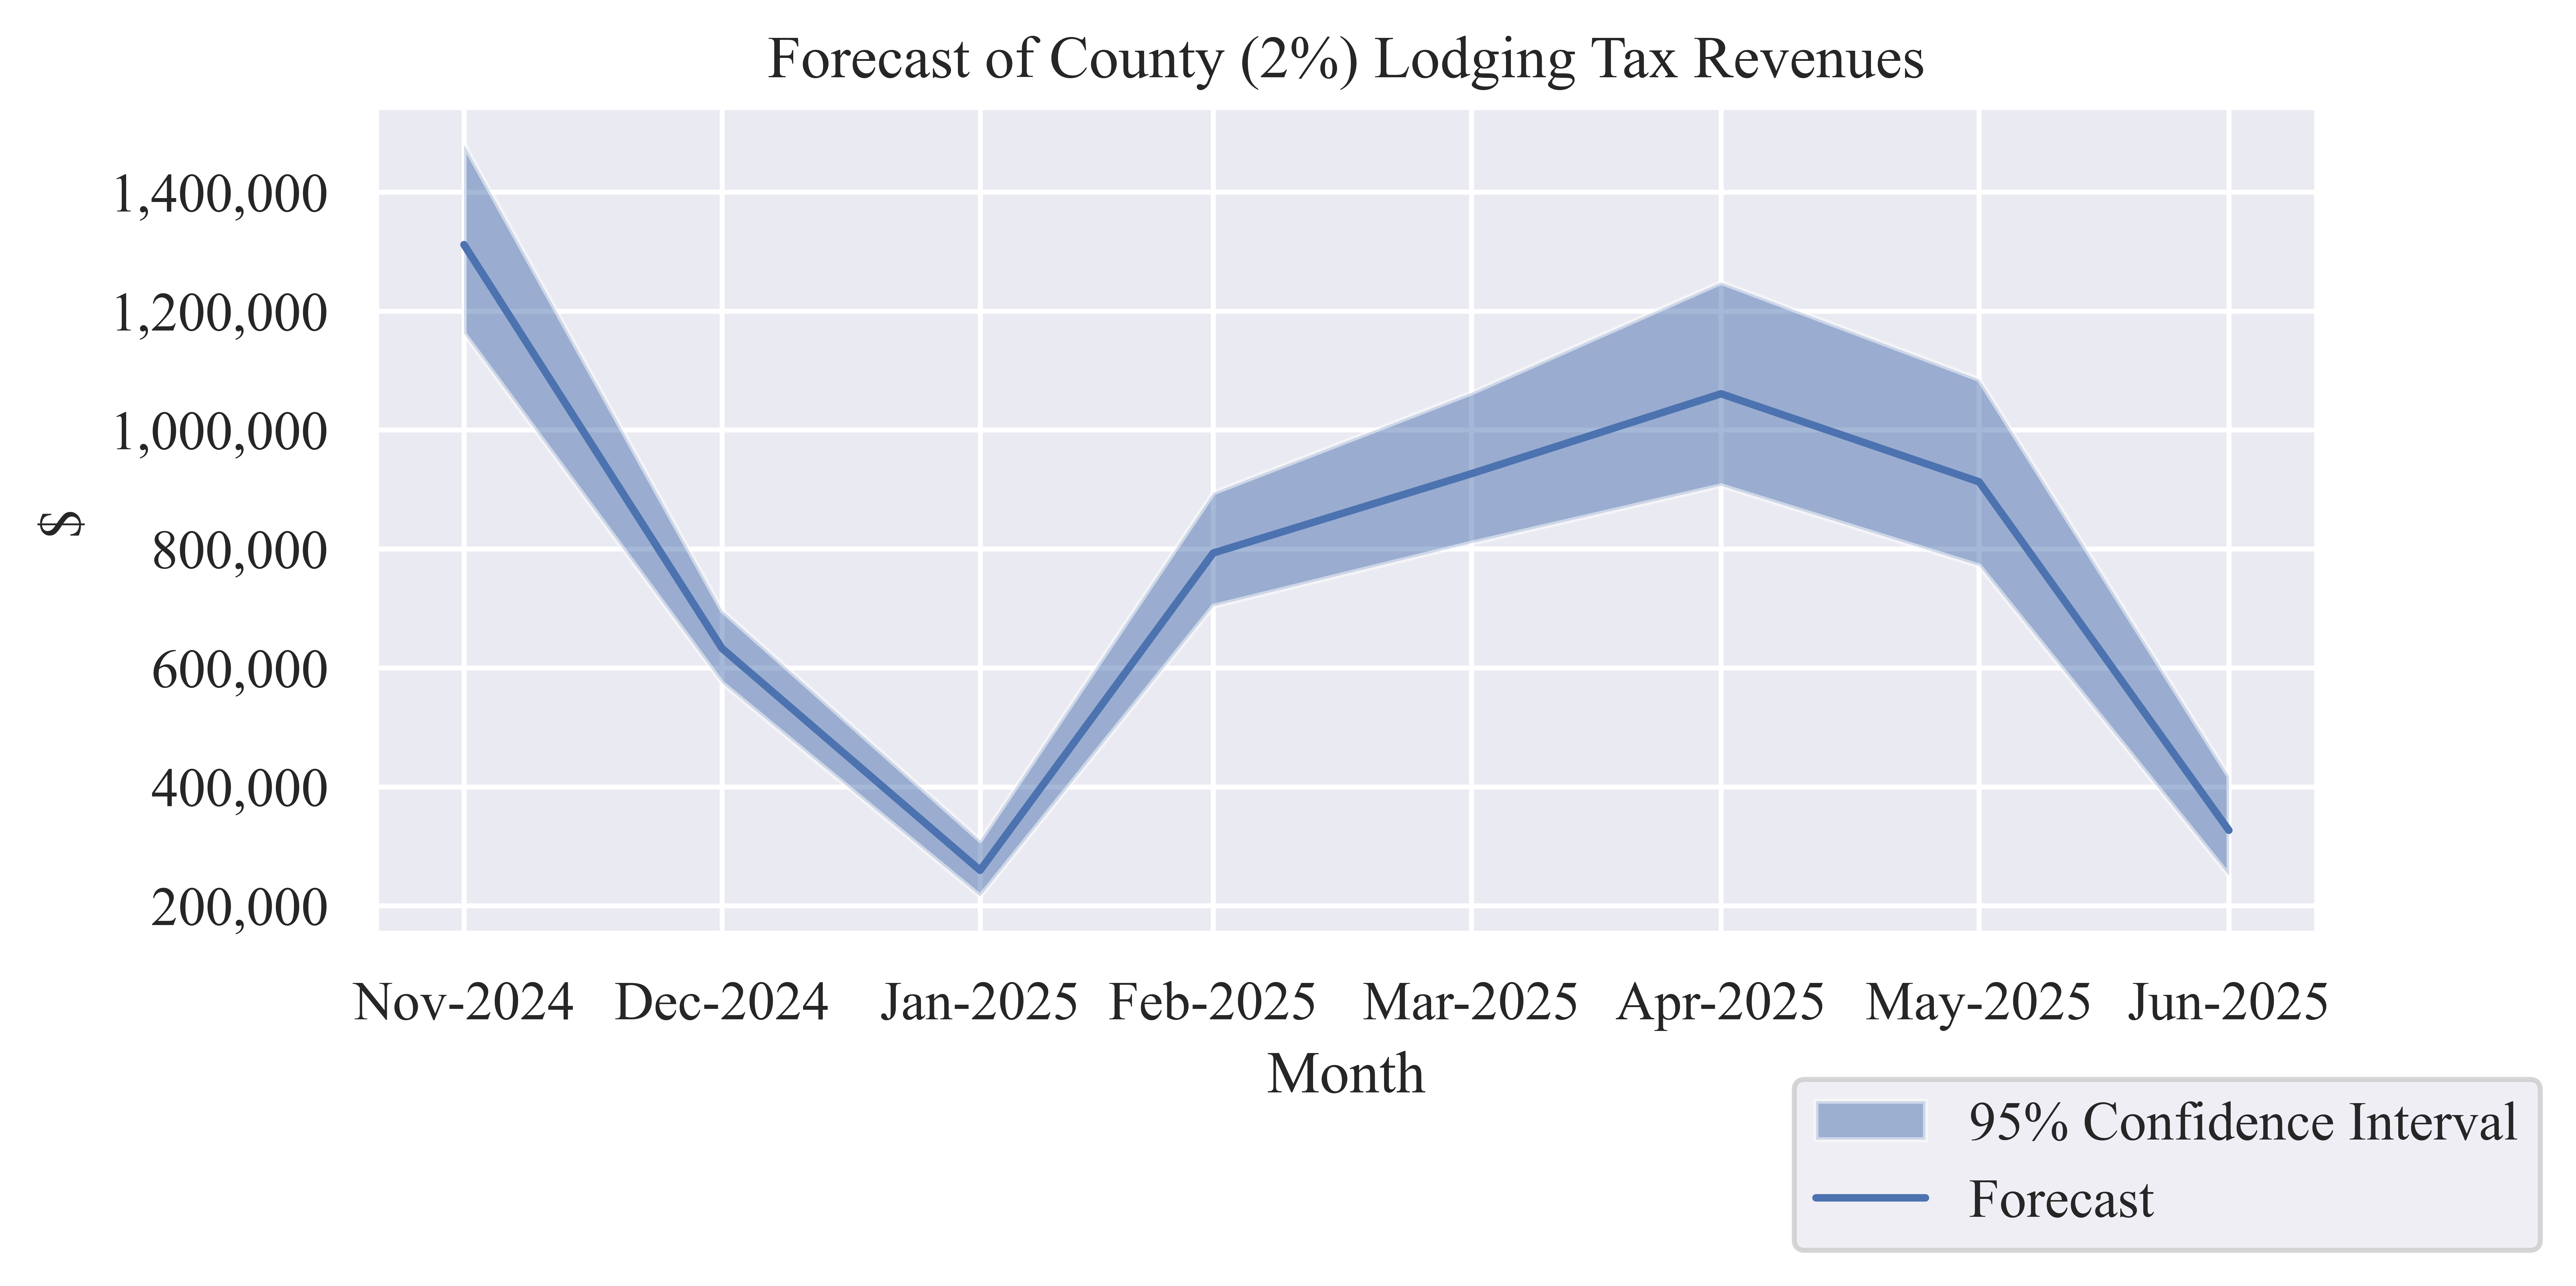
Table 4: Forecast County (2%) Lodging Tax Revenue
| Nov-2024 |
$1,311,704 |
$1,162,475 |
$1,480,090 |
| Dec-2024 |
$632,738 |
$574,642 |
$696,707 |
| Jan-2025 |
$259,586 |
$216,051 |
$310,062 |
| Feb-2025 |
$793,100 |
$703,810 |
$894,487 |
| Mar-2025 |
$926,459 |
$809,916 |
$1,062,505 |
| Apr-2025 |
$1,060,916 |
$906,519 |
$1,248,339 |
| May-2025 |
$912,819 |
$771,664 |
$1,085,202 |
| Jun-2025 |
$326,878 |
$251,029 |
$417,673 |
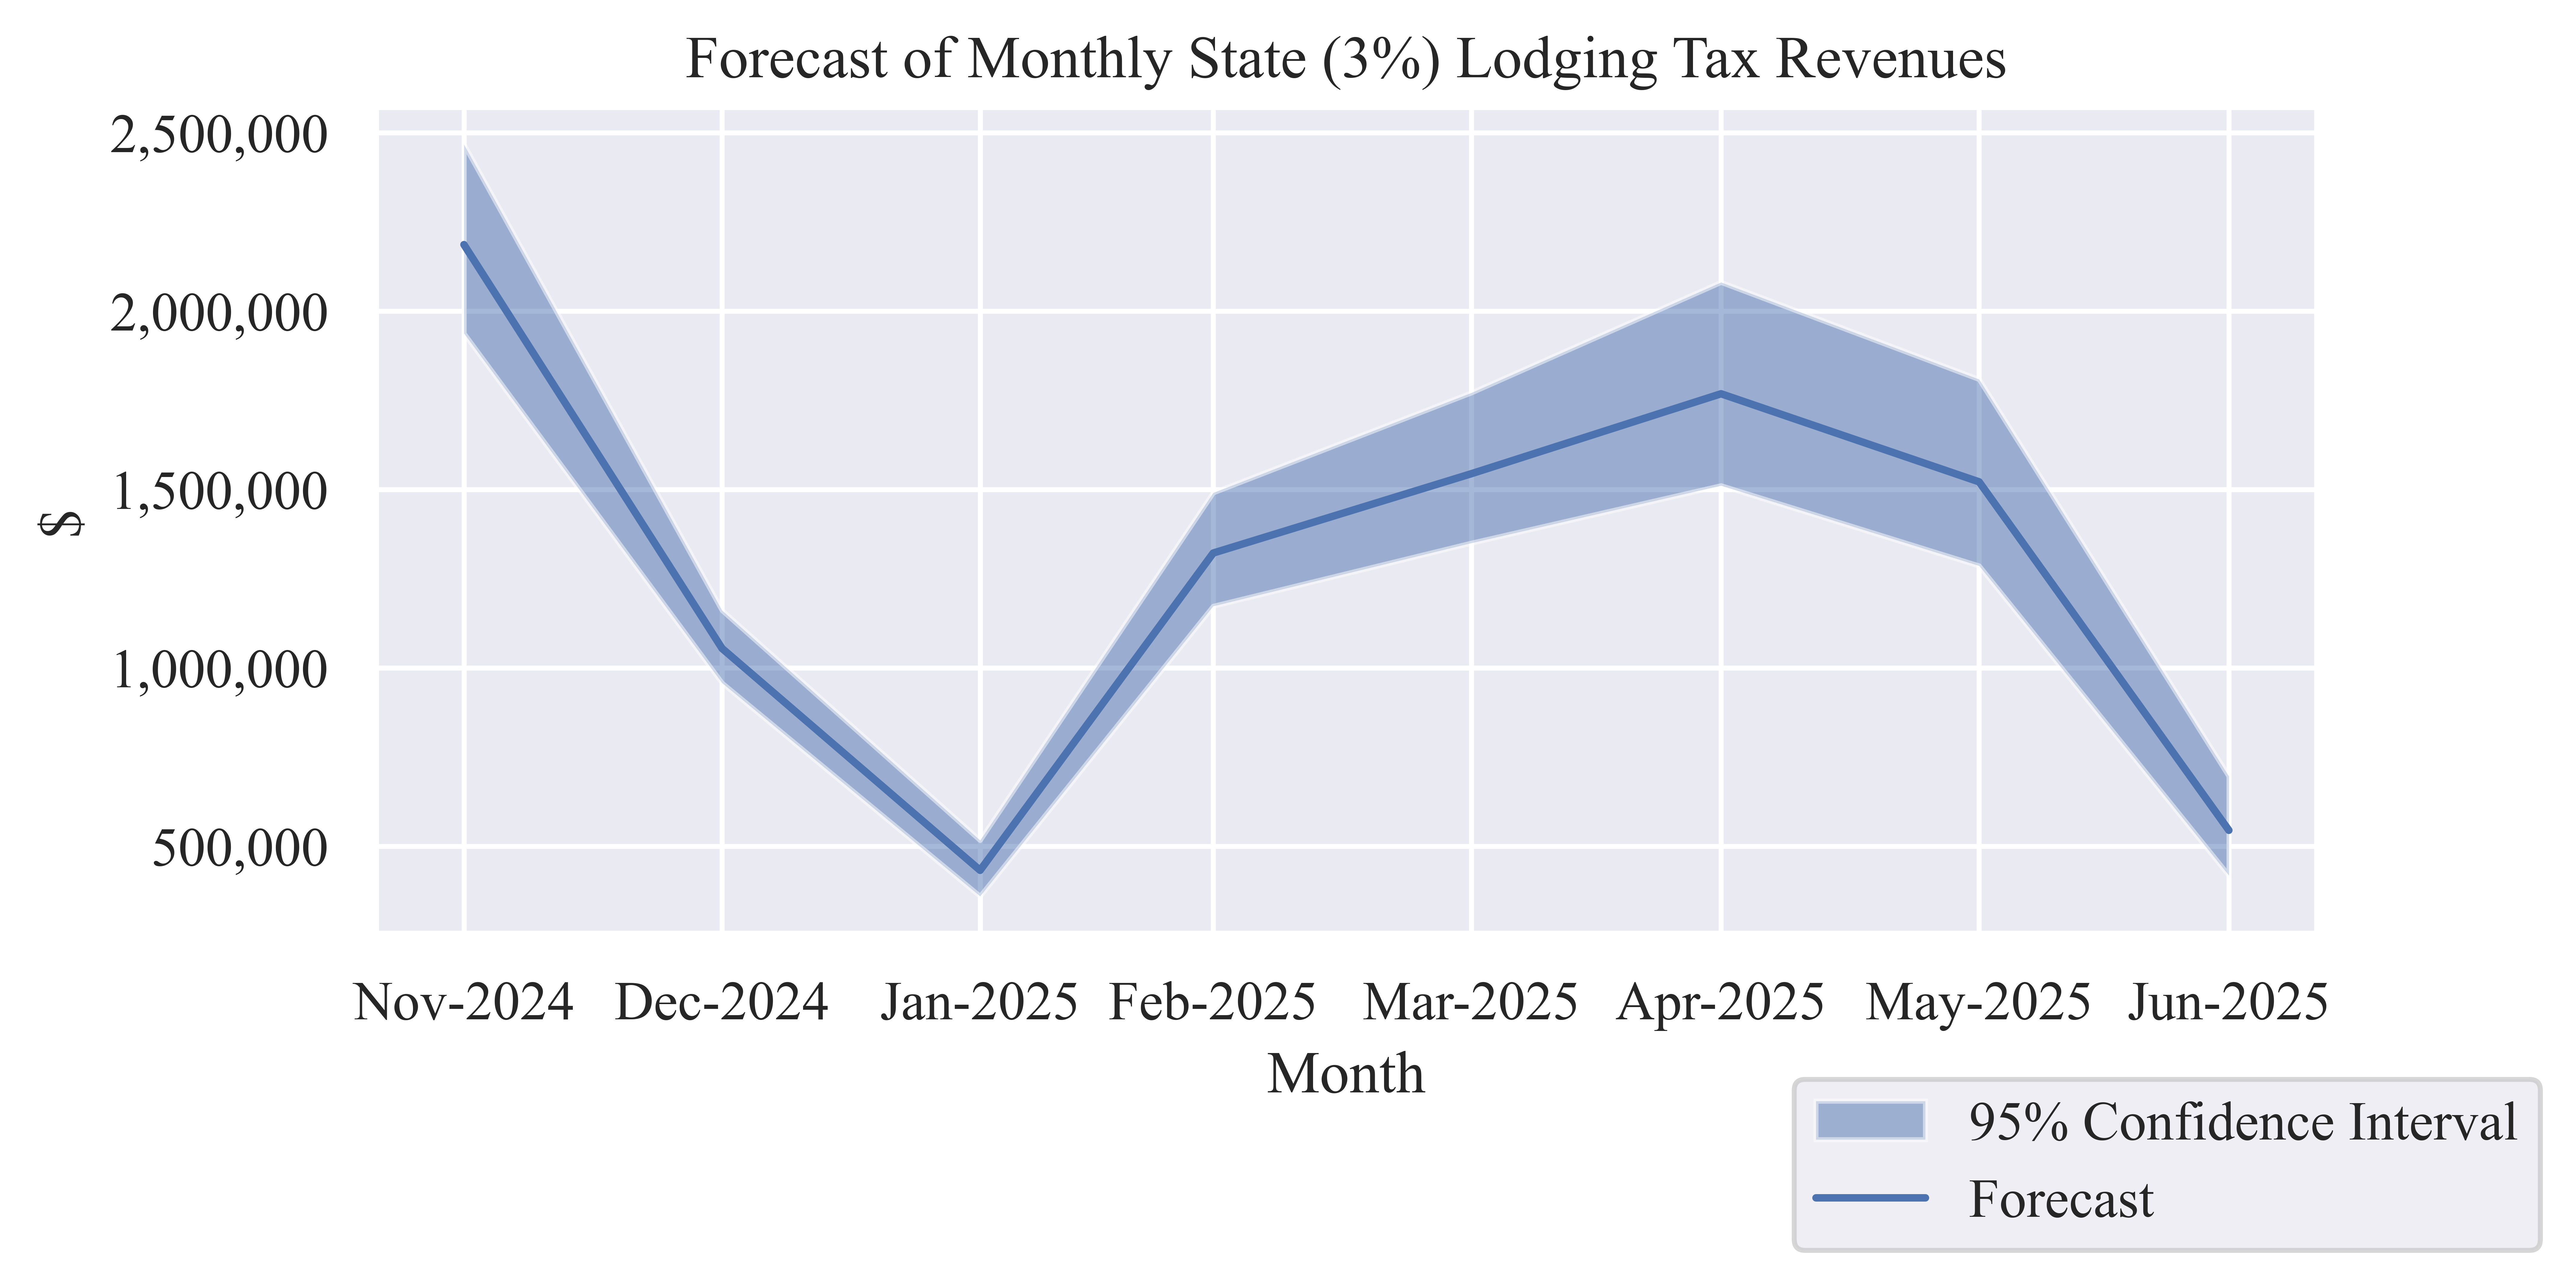
Table 5: Forecast State (3%) Lodging Tax Revenue
| Nov-2024 |
$2,186,173 |
$1,937,458 |
$2,466,817 |
| Dec-2024 |
$1,054,563 |
$957,737 |
$1,161,179 |
| Jan-2025 |
$432,643 |
$360,086 |
$516,770 |
| Feb-2025 |
$1,321,833 |
$1,173,017 |
$1,490,812 |
| Mar-2025 |
$1,544,098 |
$1,349,860 |
$1,770,842 |
| Apr-2025 |
$1,768,193 |
$1,510,865 |
$2,080,565 |
| May-2025 |
$1,521,365 |
$1,286,106 |
$1,808,670 |
| Jun-2025 |
$544,797 |
$418,382 |
$696,121 |
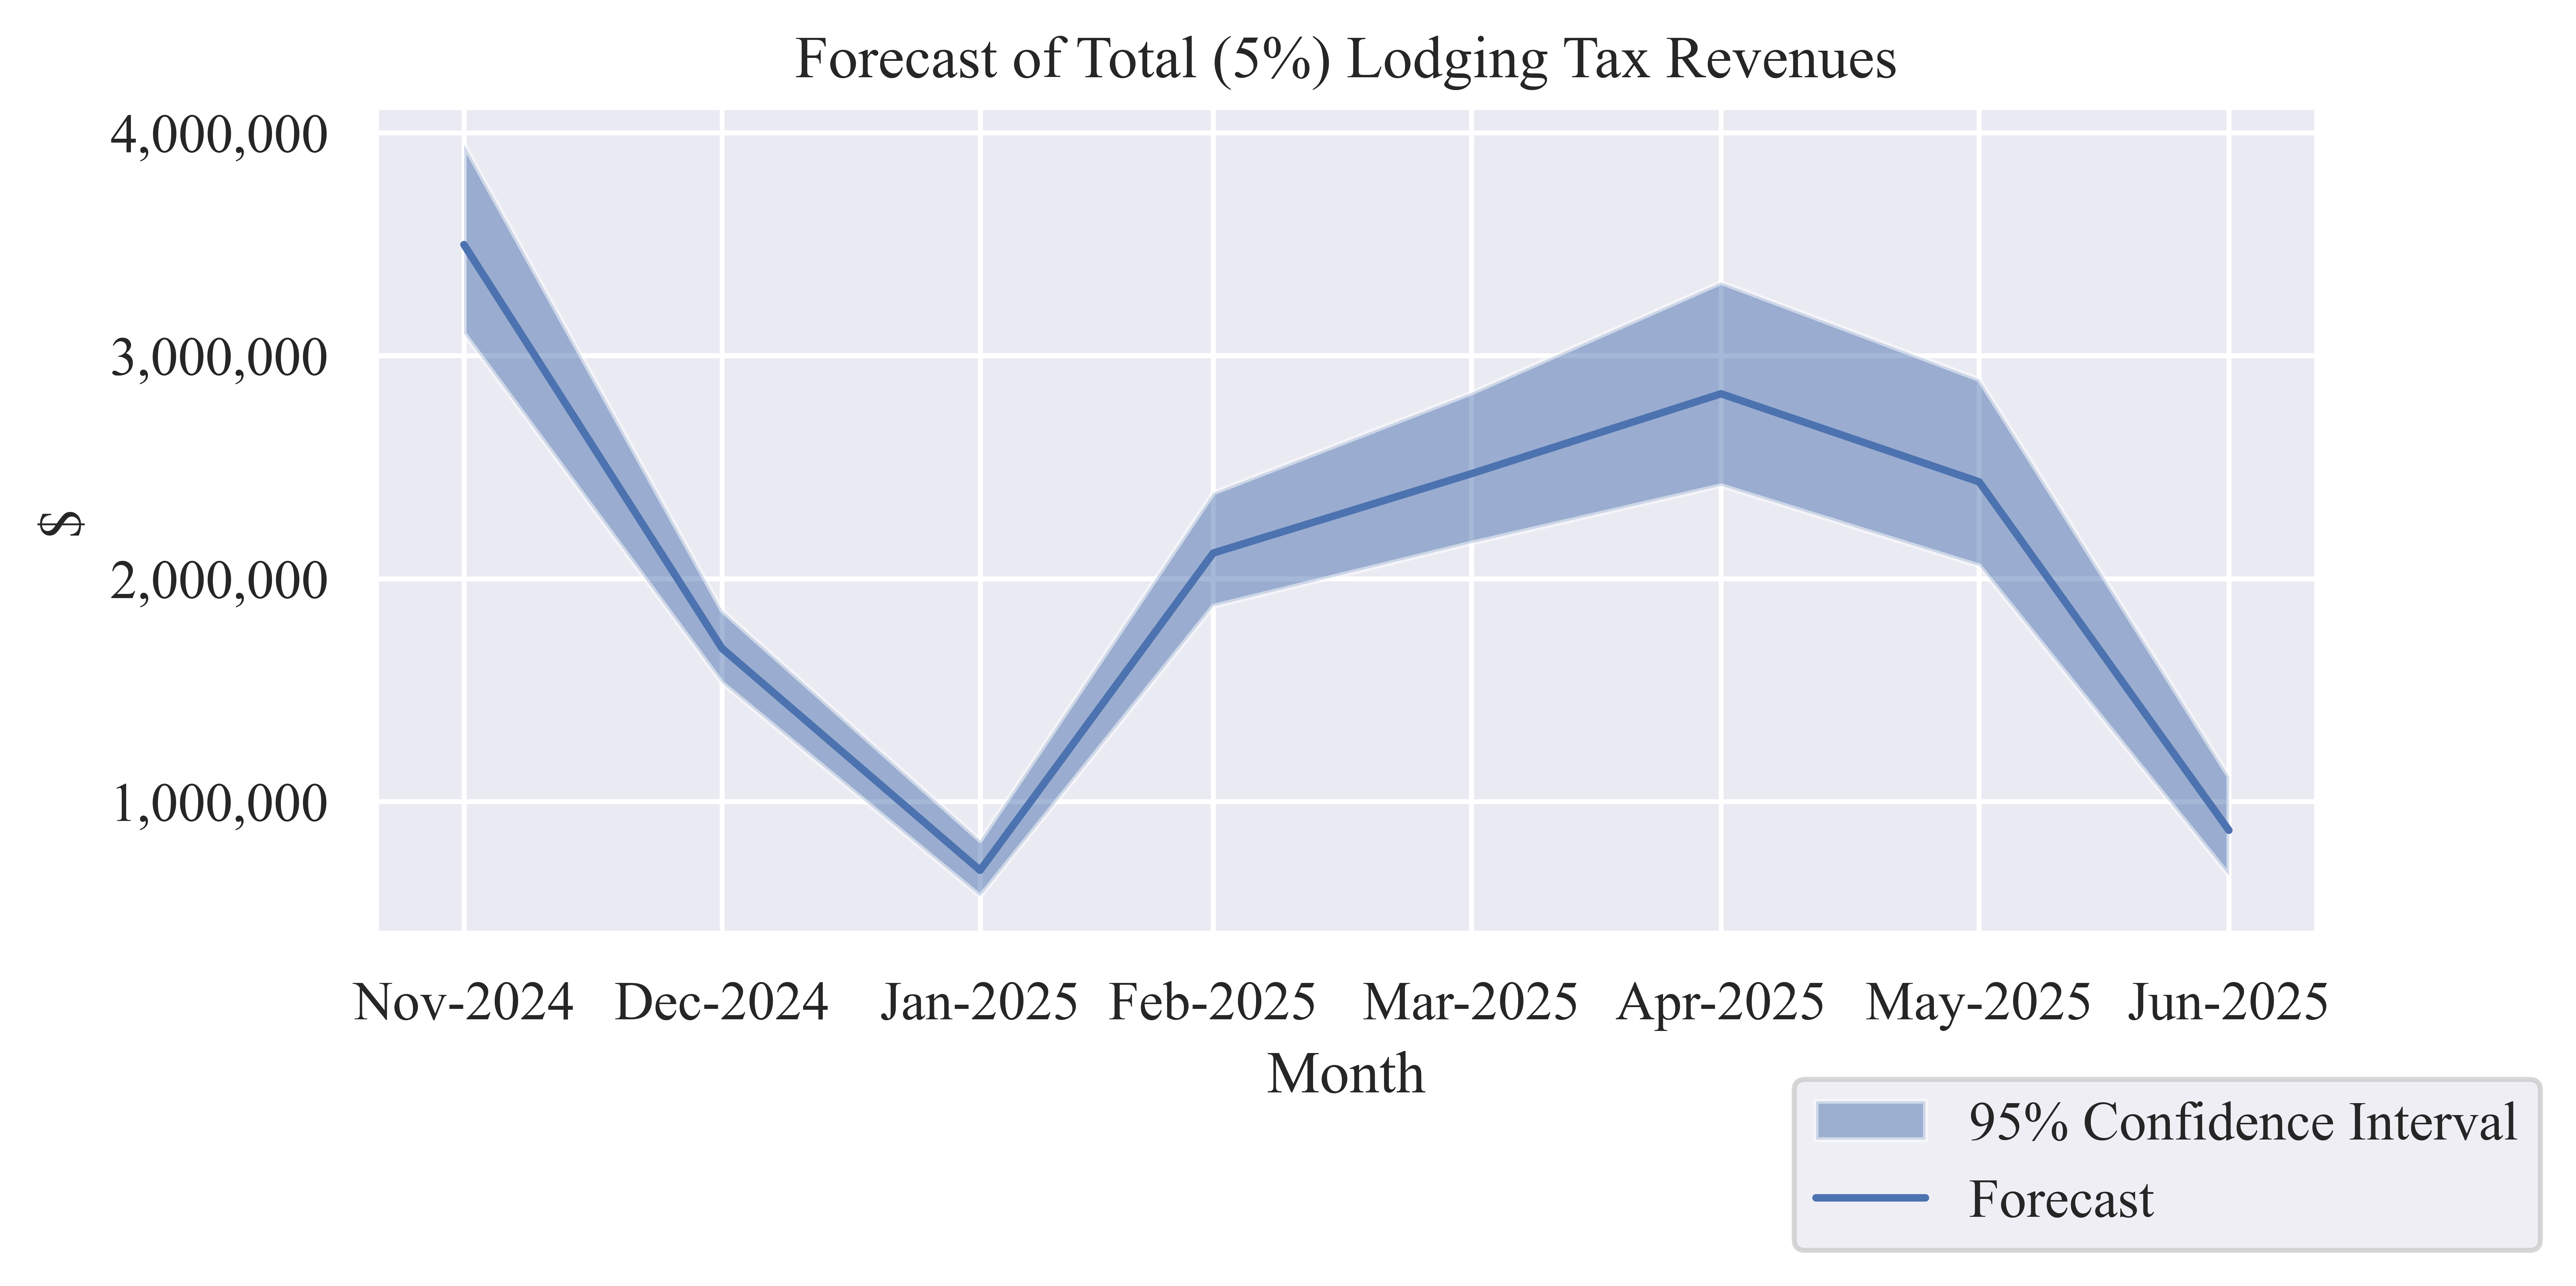
Table 6: Forecast of Monthly Total (5%) Lodging Tax Revenue
| Nov-2024 |
$3,497,877 |
$3,099,933 |
$3,946,906 |
| Dec-2024 |
$1,687,301 |
$1,532,379 |
$1,857,886 |
| Jan-2025 |
$692,228 |
$576,137 |
$826,833 |
| Feb-2025 |
$2,114,932 |
$1,876,827 |
$2,385,299 |
| Mar-2025 |
$2,470,557 |
$2,159,776 |
$2,833,348 |
| Apr-2025 |
$2,829,108 |
$2,417,384 |
$3,328,904 |
| May-2025 |
$2,434,183 |
$2,057,770 |
$2,893,872 |
| Jun-2025 |
$871,675 |
$669,411 |
$1,113,793 |
Lodging Sector Sales
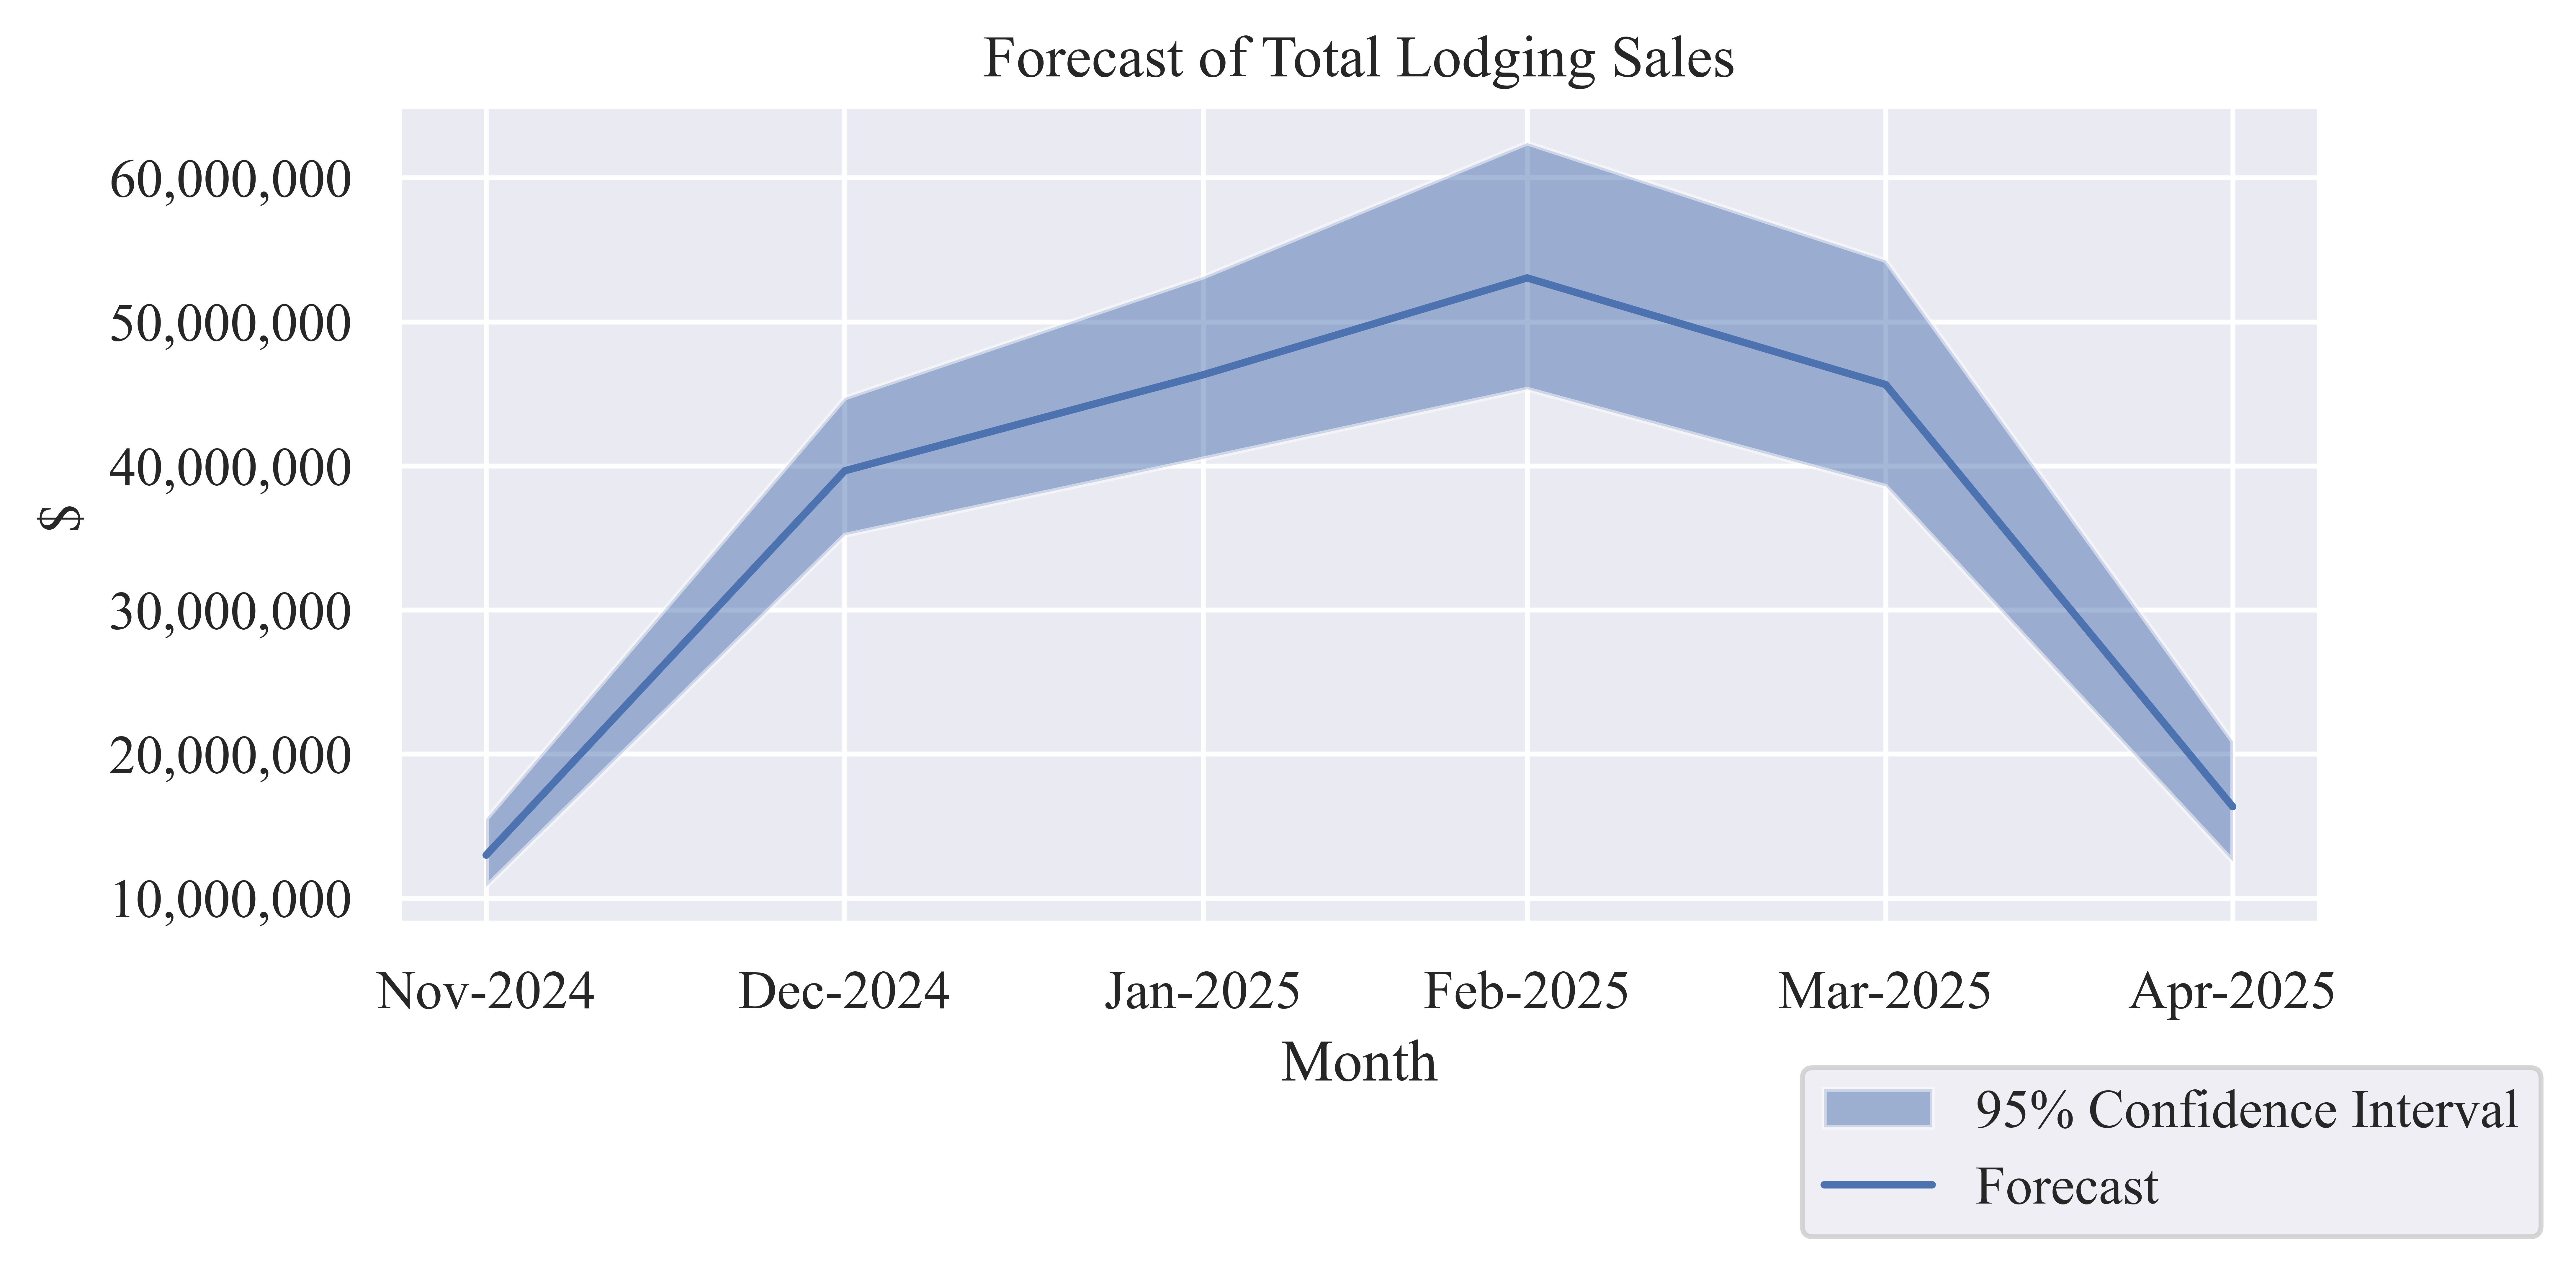
Table 7: Forecast of Monthly Lodging Sales
| Nov-2024 |
$12,979,281 |
$10,802,565 |
$15,503,113 |
| Dec-2024 |
$39,654,976 |
$35,190,510 |
$44,724,348 |
| Jan-2025 |
$46,322,936 |
$40,495,791 |
$53,125,270 |
| Feb-2025 |
$53,045,777 |
$45,325,946 |
$62,416,958 |
| Mar-2025 |
$45,640,936 |
$38,583,195 |
$54,260,099 |
| Apr-2025 |
$16,343,906 |
$12,551,459 |
$20,883,627 |
Economic Indicators
Table 8: Six-Month Forecast of Economic Output from Lodging Sales
| Low Estimate |
$182,949,466 |
$39,479,622 |
$9,935,439 |
$232,364,527 |
| Median Estimate |
$213,987,813 |
$46,177,561 |
$11,621,051 |
$271,786,425 |
| High Estimate |
$250,913,414 |
$54,145,932 |
$13,626,372 |
$318,685,719 |
Table 9: Six-Month Forecast of Employee Compensation from Lodging Sales
| Low Estimate |
$59,172,307 |
$13,302,118 |
$2,740,795 |
$75,215,221 |
| Median Estimate |
$69,211,203 |
$15,558,897 |
$3,205,788 |
$87,975,888 |
| High Estimate |
$81,154,244 |
$18,243,730 |
$3,758,977 |
$103,156,952 |
Table 10: Six-Month Forecast of Contribution to Gross County Product from Lodging
Sales
| Low Estimate |
$132,353,950 |
$23,202,466 |
$5,993,727 |
$161,550,143 |
| Median Estimate |
$154,808,499 |
$27,138,895 |
$7,010,602 |
$188,957,996 |
| High Estimate |
$181,522,156 |
$31,821,965 |
$8,220,347 |
$221,564,468 |
Table 11: Six-Month Forecast of Employment from Lodging Sales
| Low Estimate |
2,325 |
373 |
103 |
2,801 |
| Median Estimate |
2,719 |
437 |
121 |
3,277 |
| High Estimate |
3,188 |
512 |
142 |
3,842 |
