Jackson Hole Economic Forecasting
September 2024 Forecast
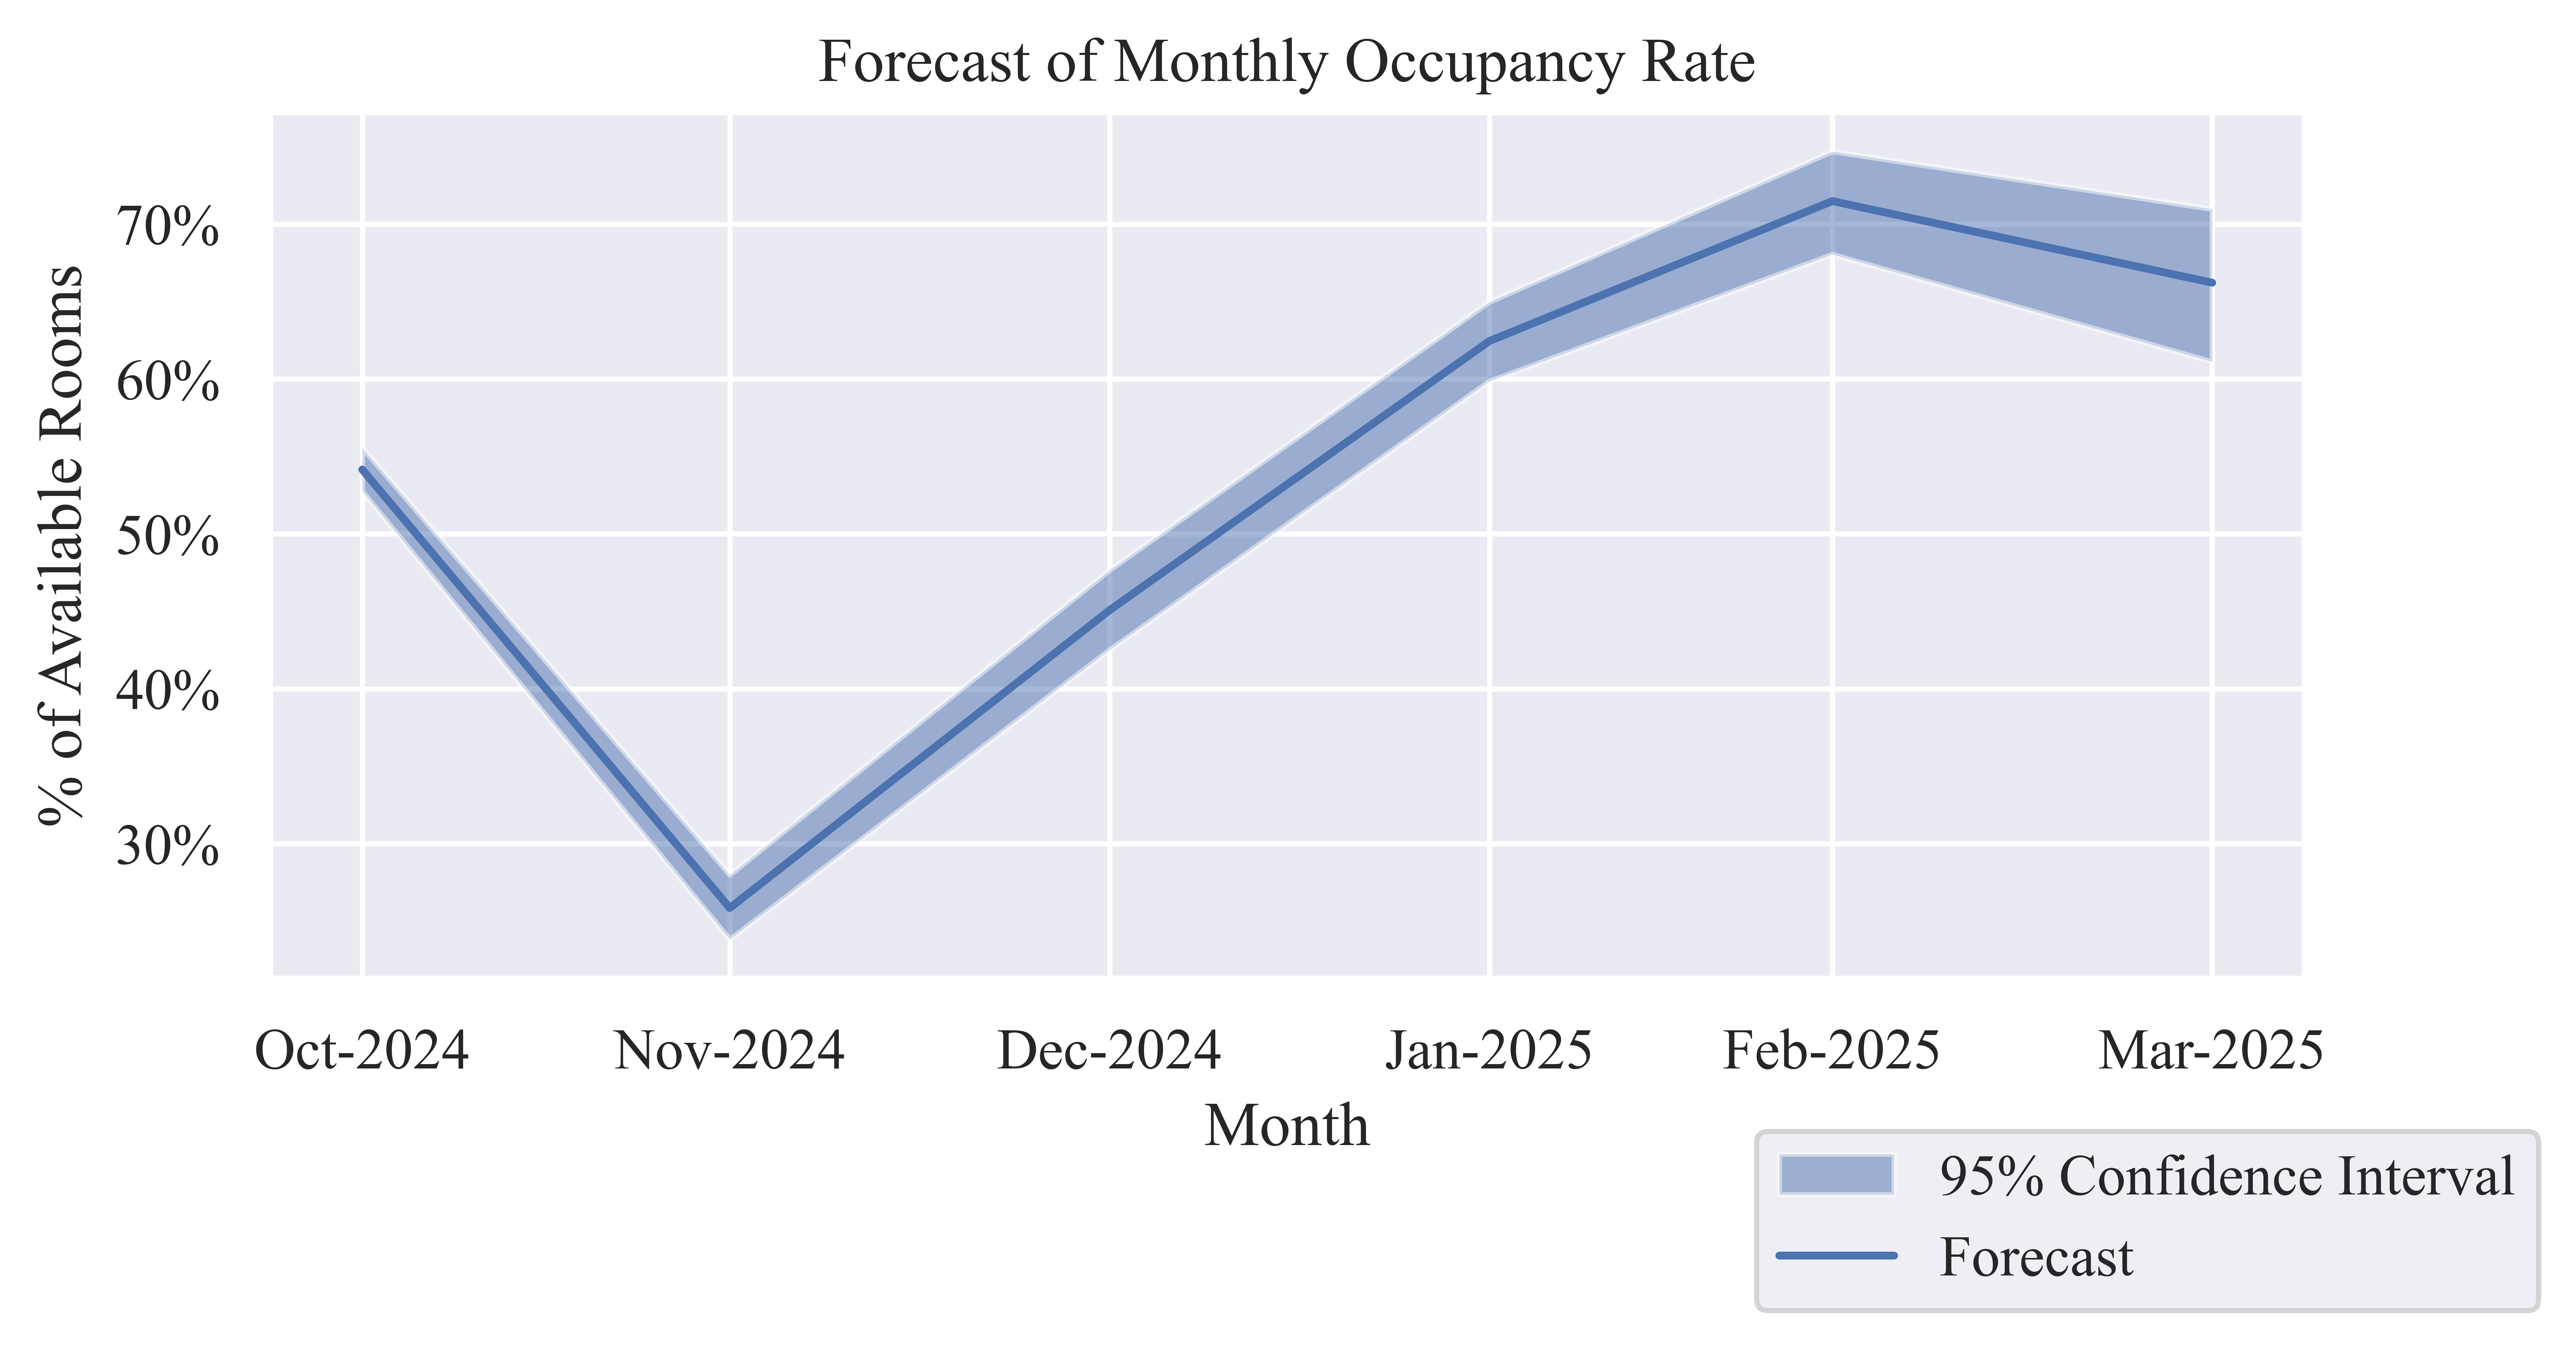
Occupancy Rate (OR)
Table 1: Forecast of Monthly Occupancy Rate
| Oct-2024 |
54.16% |
52.75% |
55.55% |
| Nov-2024 |
25.85% |
23.82% |
27.98% |
| Dec-2024 |
45.07% |
42.52% |
47.66% |
| Jan-2025 |
62.45% |
59.86% |
64.97% |
| Feb-2025 |
71.49% |
68.05% |
74.69% |
| Mar-2025 |
66.22% |
61.12% |
70.97% |
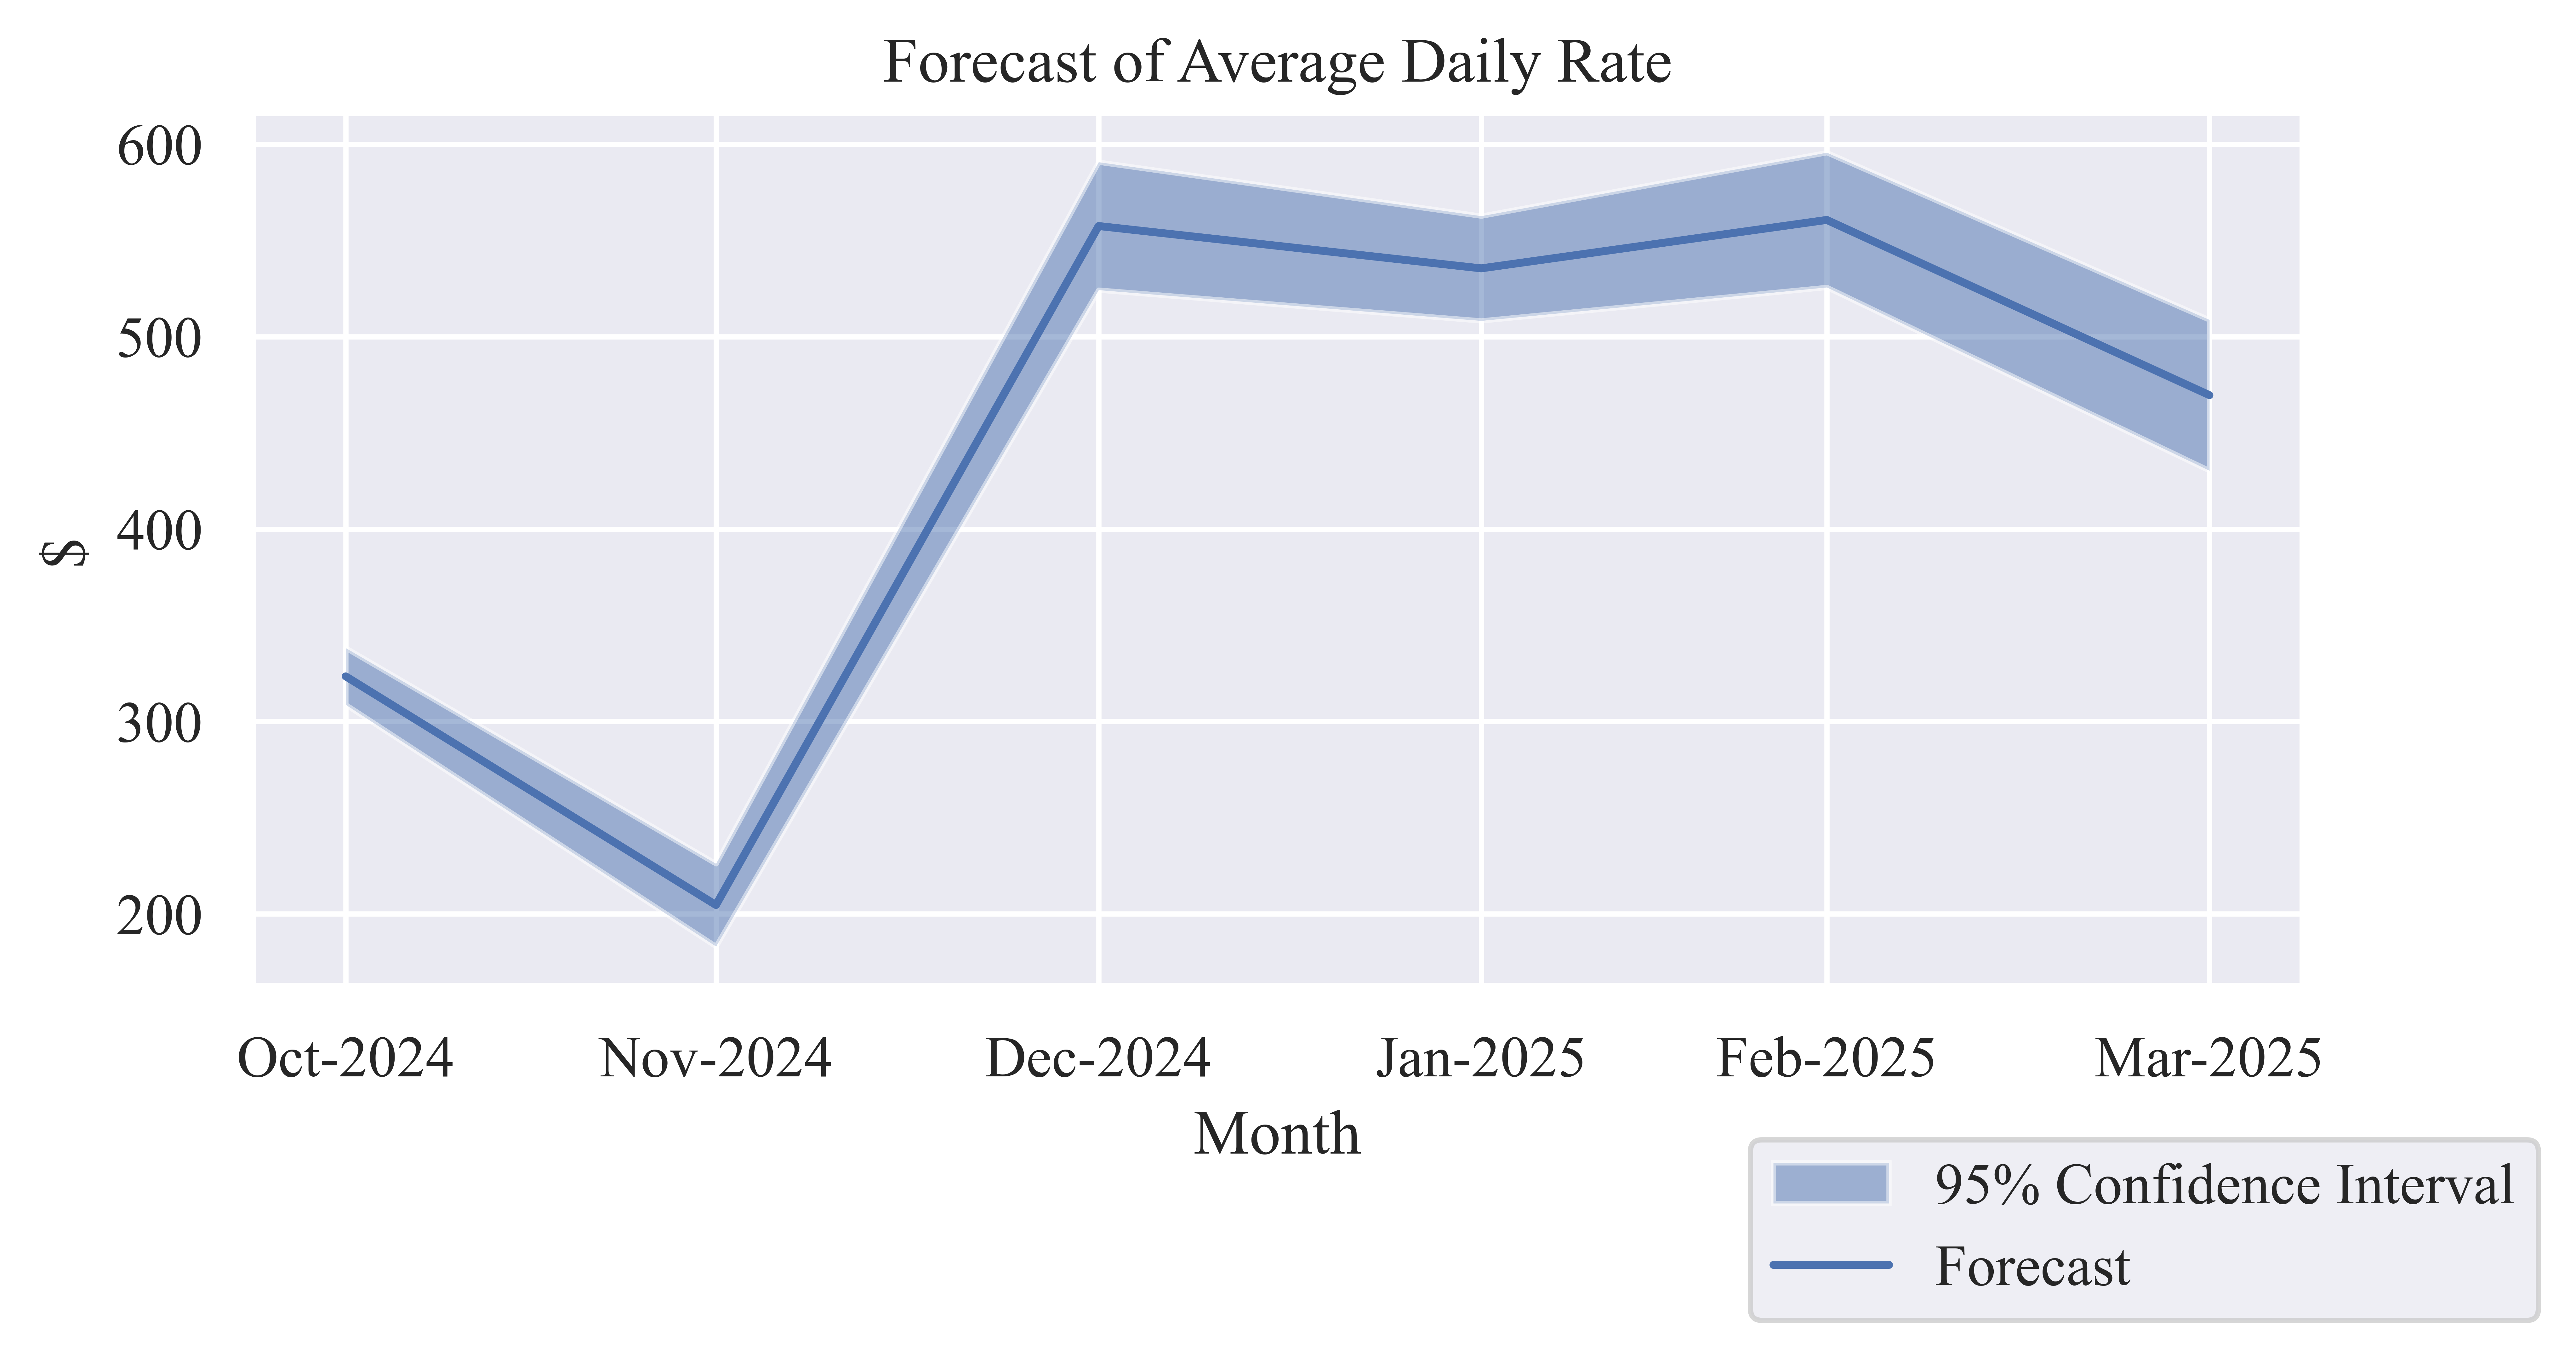
Average Daily Rate (ADR)
Table 2: Forecast of Monthly Average Daily Rate
| Oct-2024 |
$323.48 |
$308.74 |
$338.21 |
| Nov-2024 |
$204.64 |
$183.15 |
$226.14 |
| Dec-2024 |
$557.46 |
$524.23 |
$590.70 |
| Jan-2025 |
$535.46 |
$508.25 |
$562.68 |
| Feb-2025 |
$560.63 |
$525.62 |
$595.63 |
| Mar-2025 |
$469.57 |
$430.40 |
$508.75 |
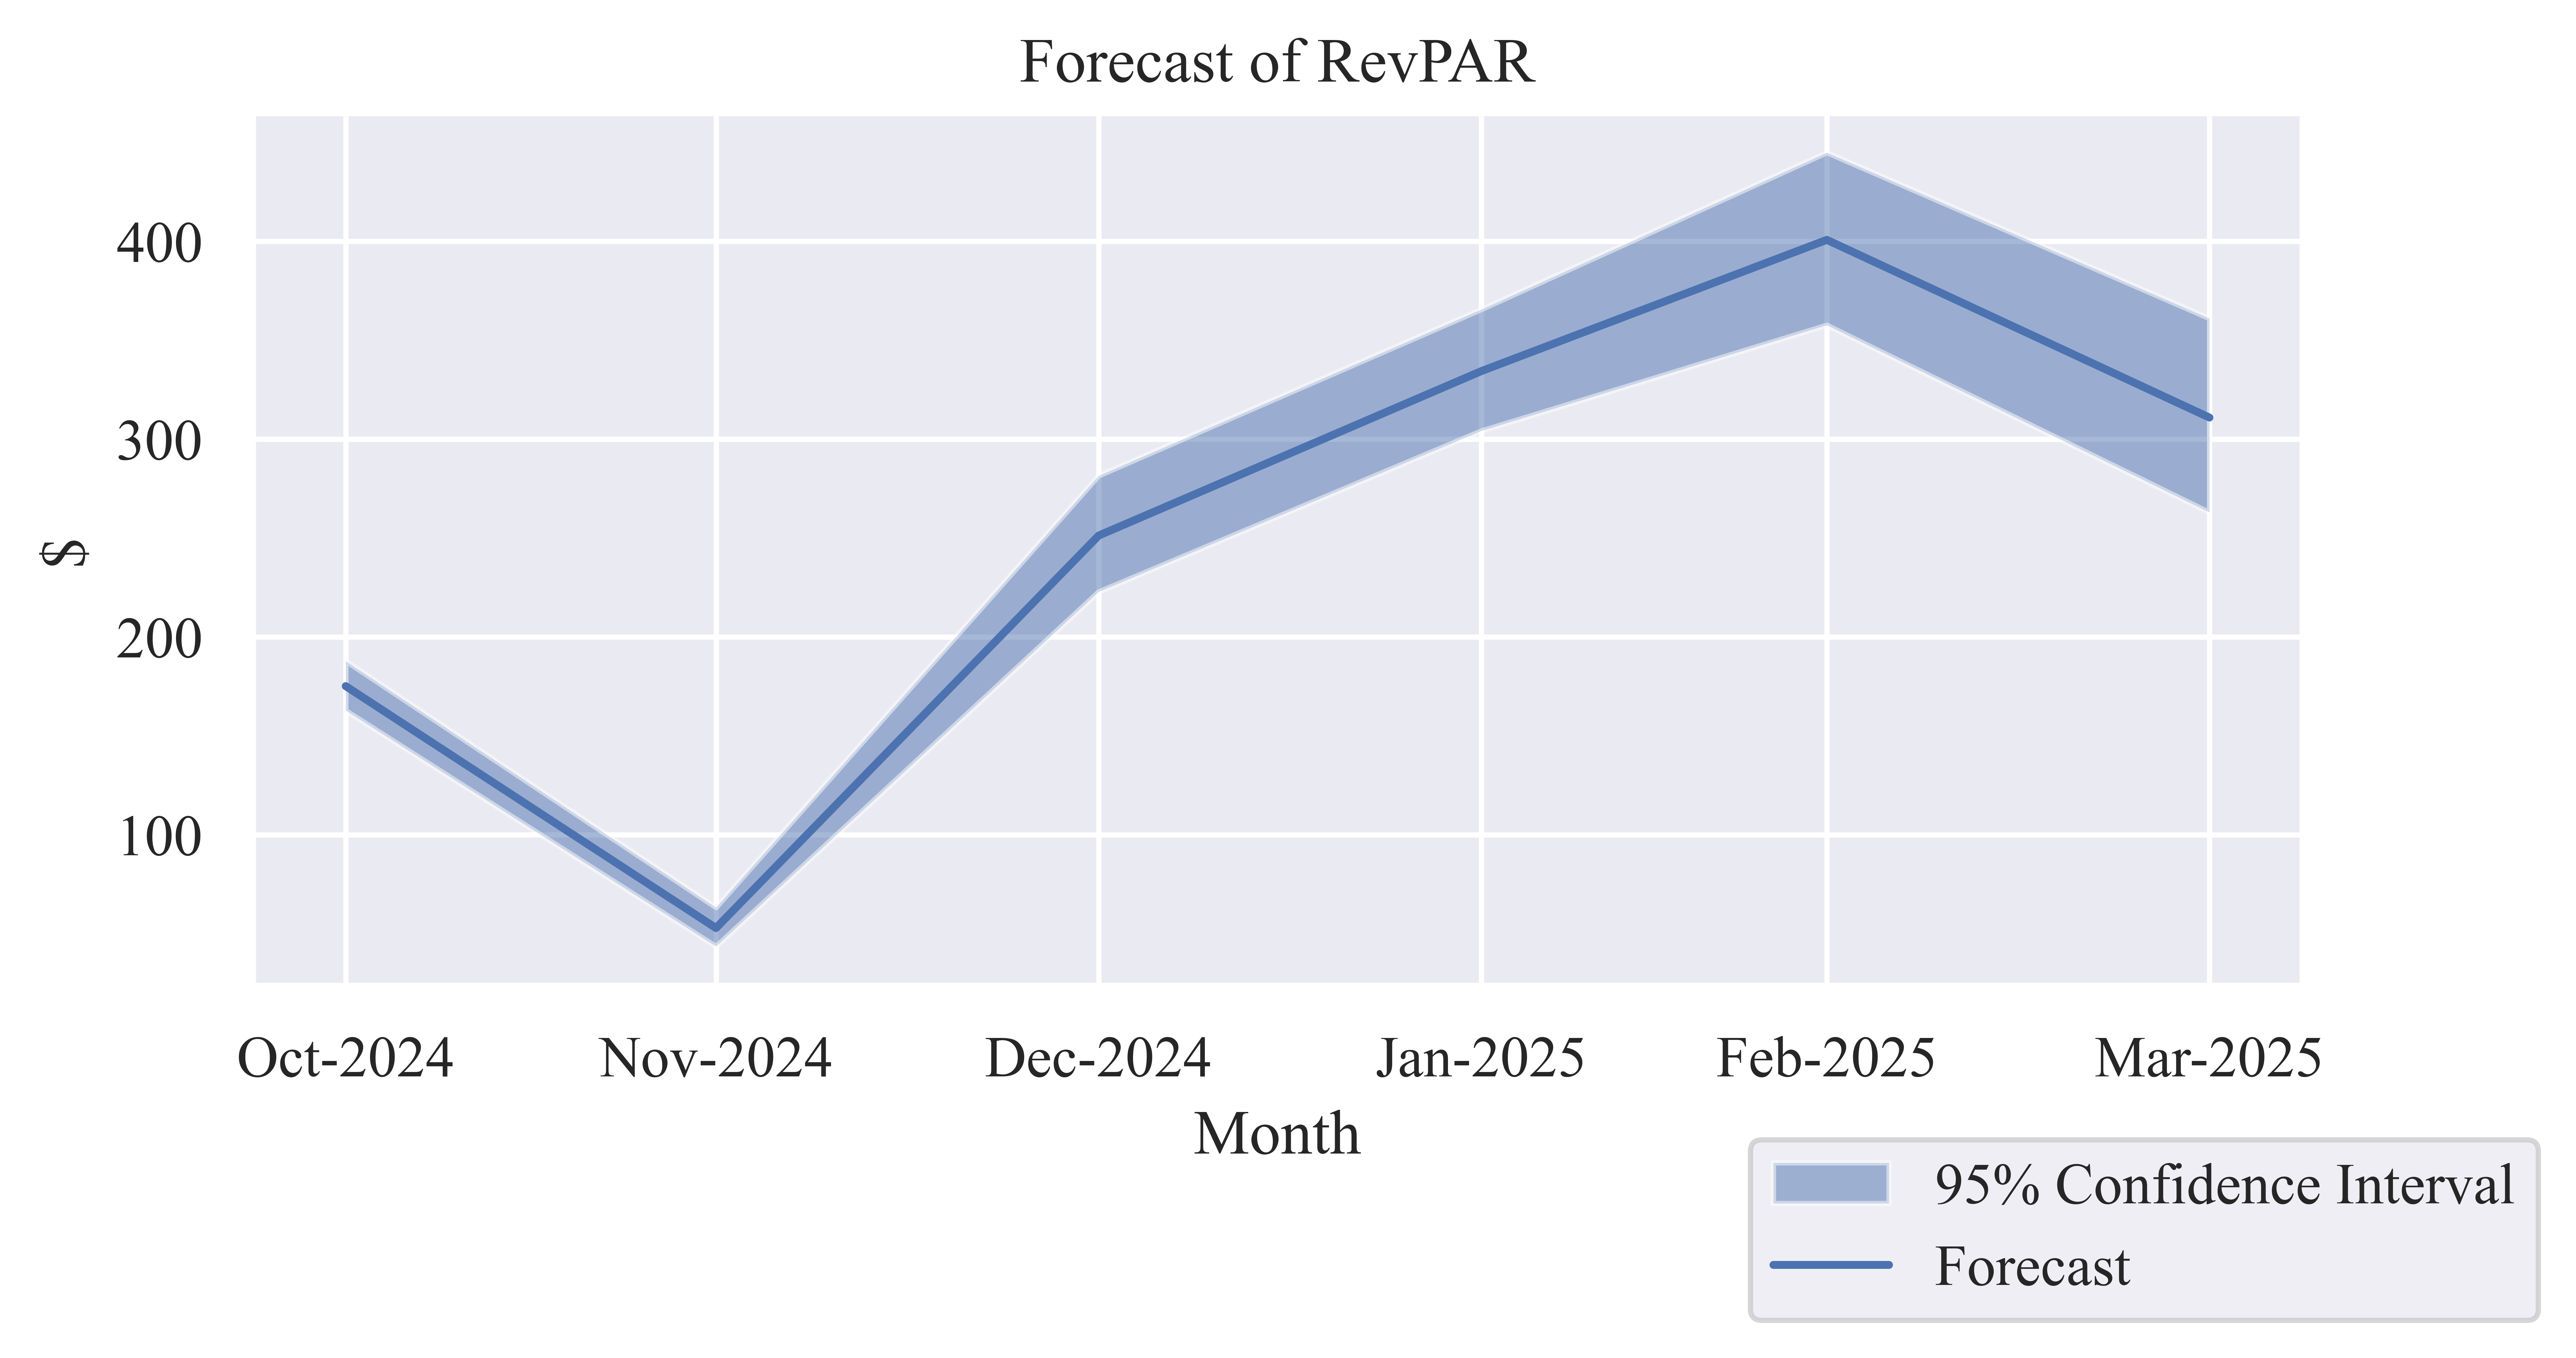
Revenue per Available Room (RevPAR)
Table 3: Forecast of Monthly RevPAR
| Oct-2024 |
$175.19 |
$162.87 |
$187.89 |
| Nov-2024 |
$52.89 |
$43.62 |
$63.28 |
| Dec-2024 |
$251.28 |
$222.89 |
$281.52 |
| Jan-2025 |
$334.40 |
$304.24 |
$365.58 |
| Feb-2025 |
$400.78 |
$357.69 |
$444.89 |
| Mar-2025 |
$310.94 |
$263.04 |
$361.06 |
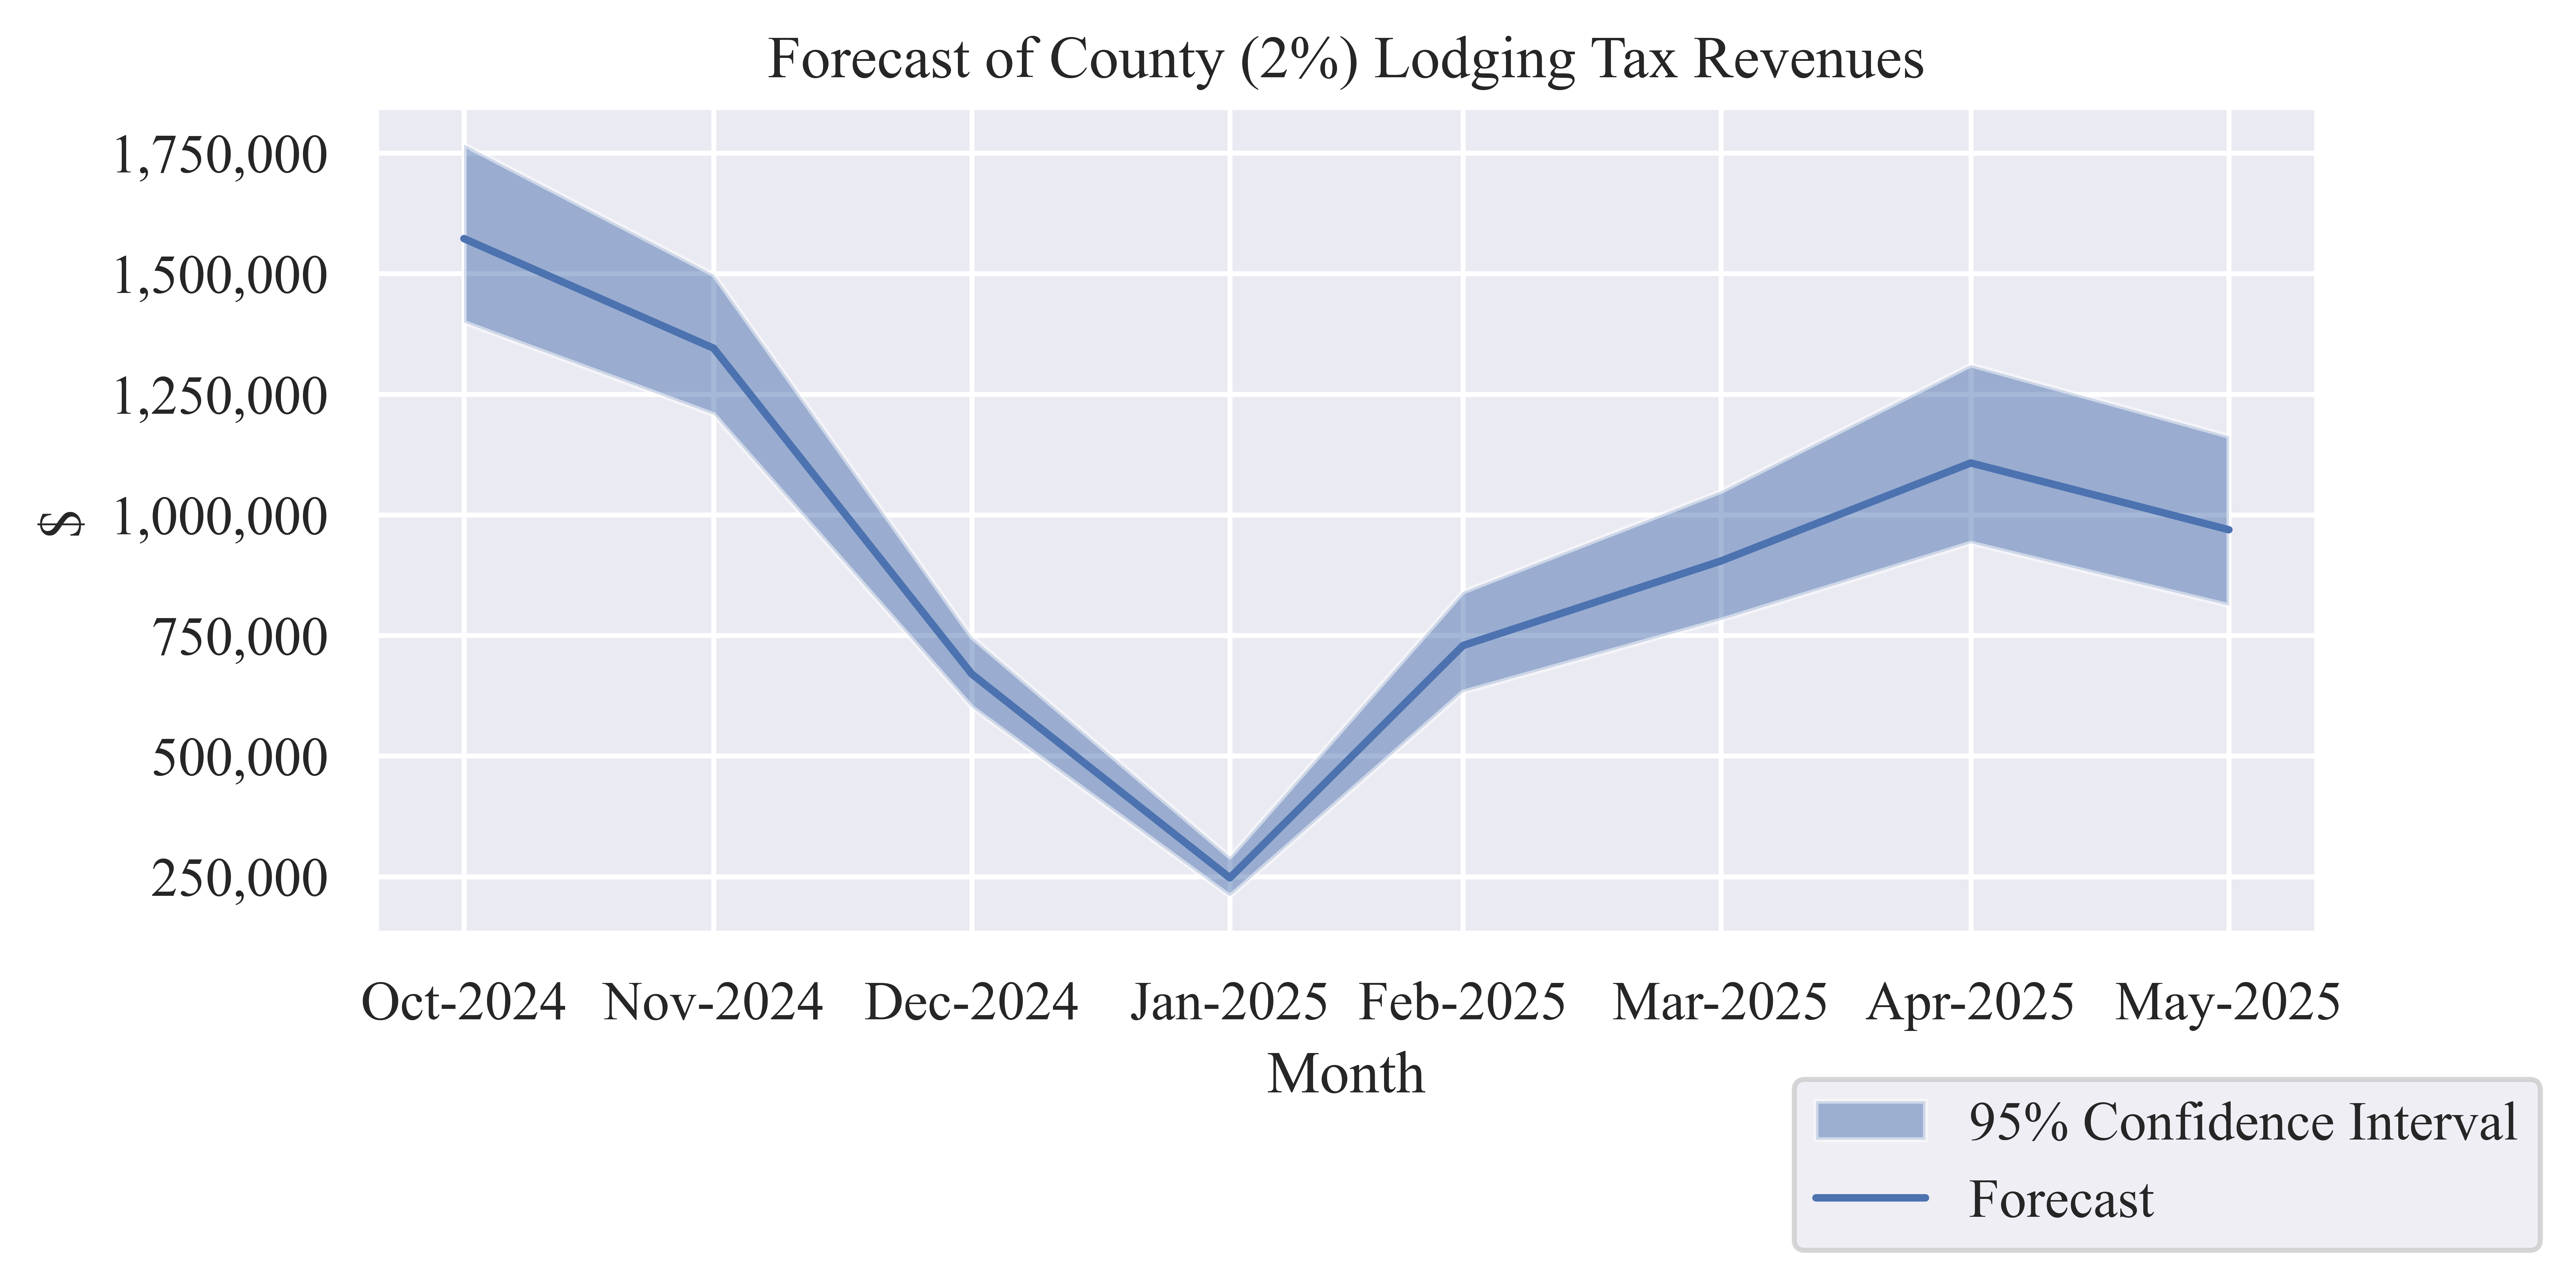
Tax Revenues
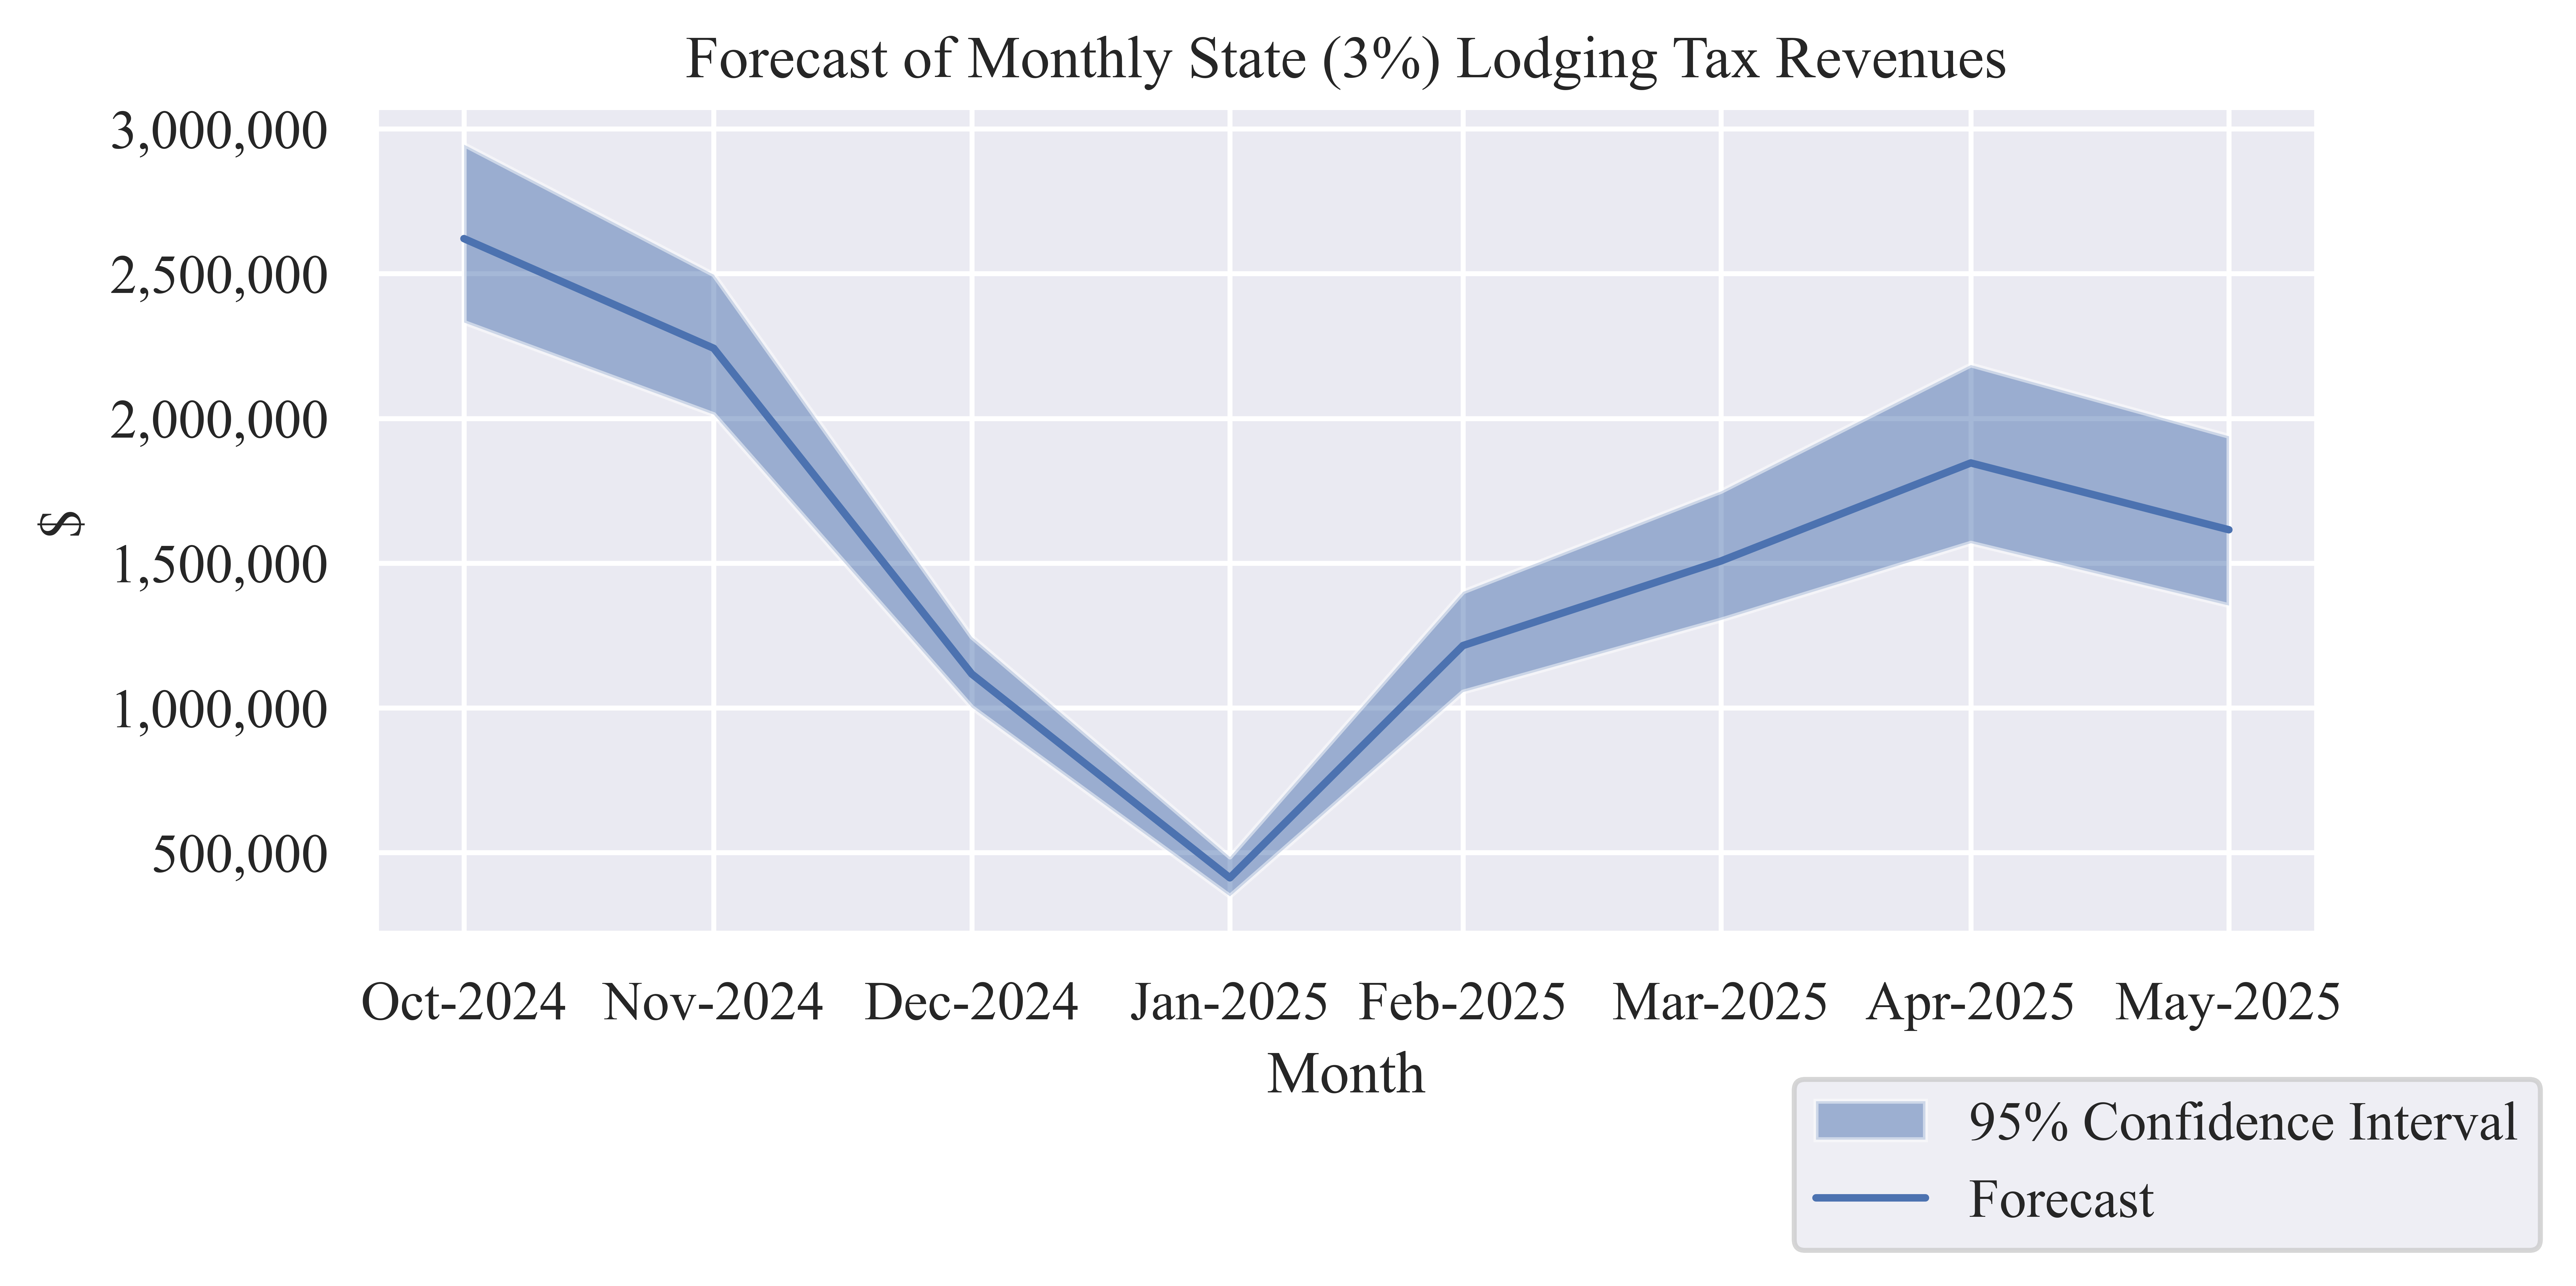
Table 4: Forecast County (2%) Lodging Tax Revenue
| Oct-2024 |
$1,572,679 |
$1,399,065 |
$1,767,837 |
| Nov-2024 |
$1,345,296 |
$1,208,001 |
$1,498,194 |
| Dec-2024 |
$670,003 |
$600,917 |
$747,038 |
| Jan-2025 |
$247,463 |
$209,357 |
$290,977 |
| Feb-2025 |
$728,990 |
$632,801 |
$840,608 |
| Mar-2025 |
$904,405 |
$782,239 |
$1,049,051 |
| Apr-2025 |
$1,107,617 |
$941,482 |
$1,310,921 |
| May-2025 |
$969,093 |
$812,209 |
$1,163,229 |
Table 5: Forecast State (3%) Lodging Tax Revenue
| Oct-2024 |
$2,621,132 |
$2,331,775 |
$2,946,395 |
| Nov-2024 |
$2,242,160 |
$2,013,335 |
$2,496,991 |
| Dec-2024 |
$1,116,671 |
$1,001,529 |
$1,245,063 |
| Jan-2025 |
$412,439 |
$348,928 |
$484,962 |
| Feb-2025 |
$1,214,984 |
$1,054,669 |
$1,401,014 |
| Mar-2025 |
$1,507,342 |
$1,303,732 |
$1,748,418 |
| Apr-2025 |
$1,846,028 |
$1,569,137 |
$2,184,868 |
| May-2025 |
$1,615,154 |
$1,353,682 |
$1,938,716 |
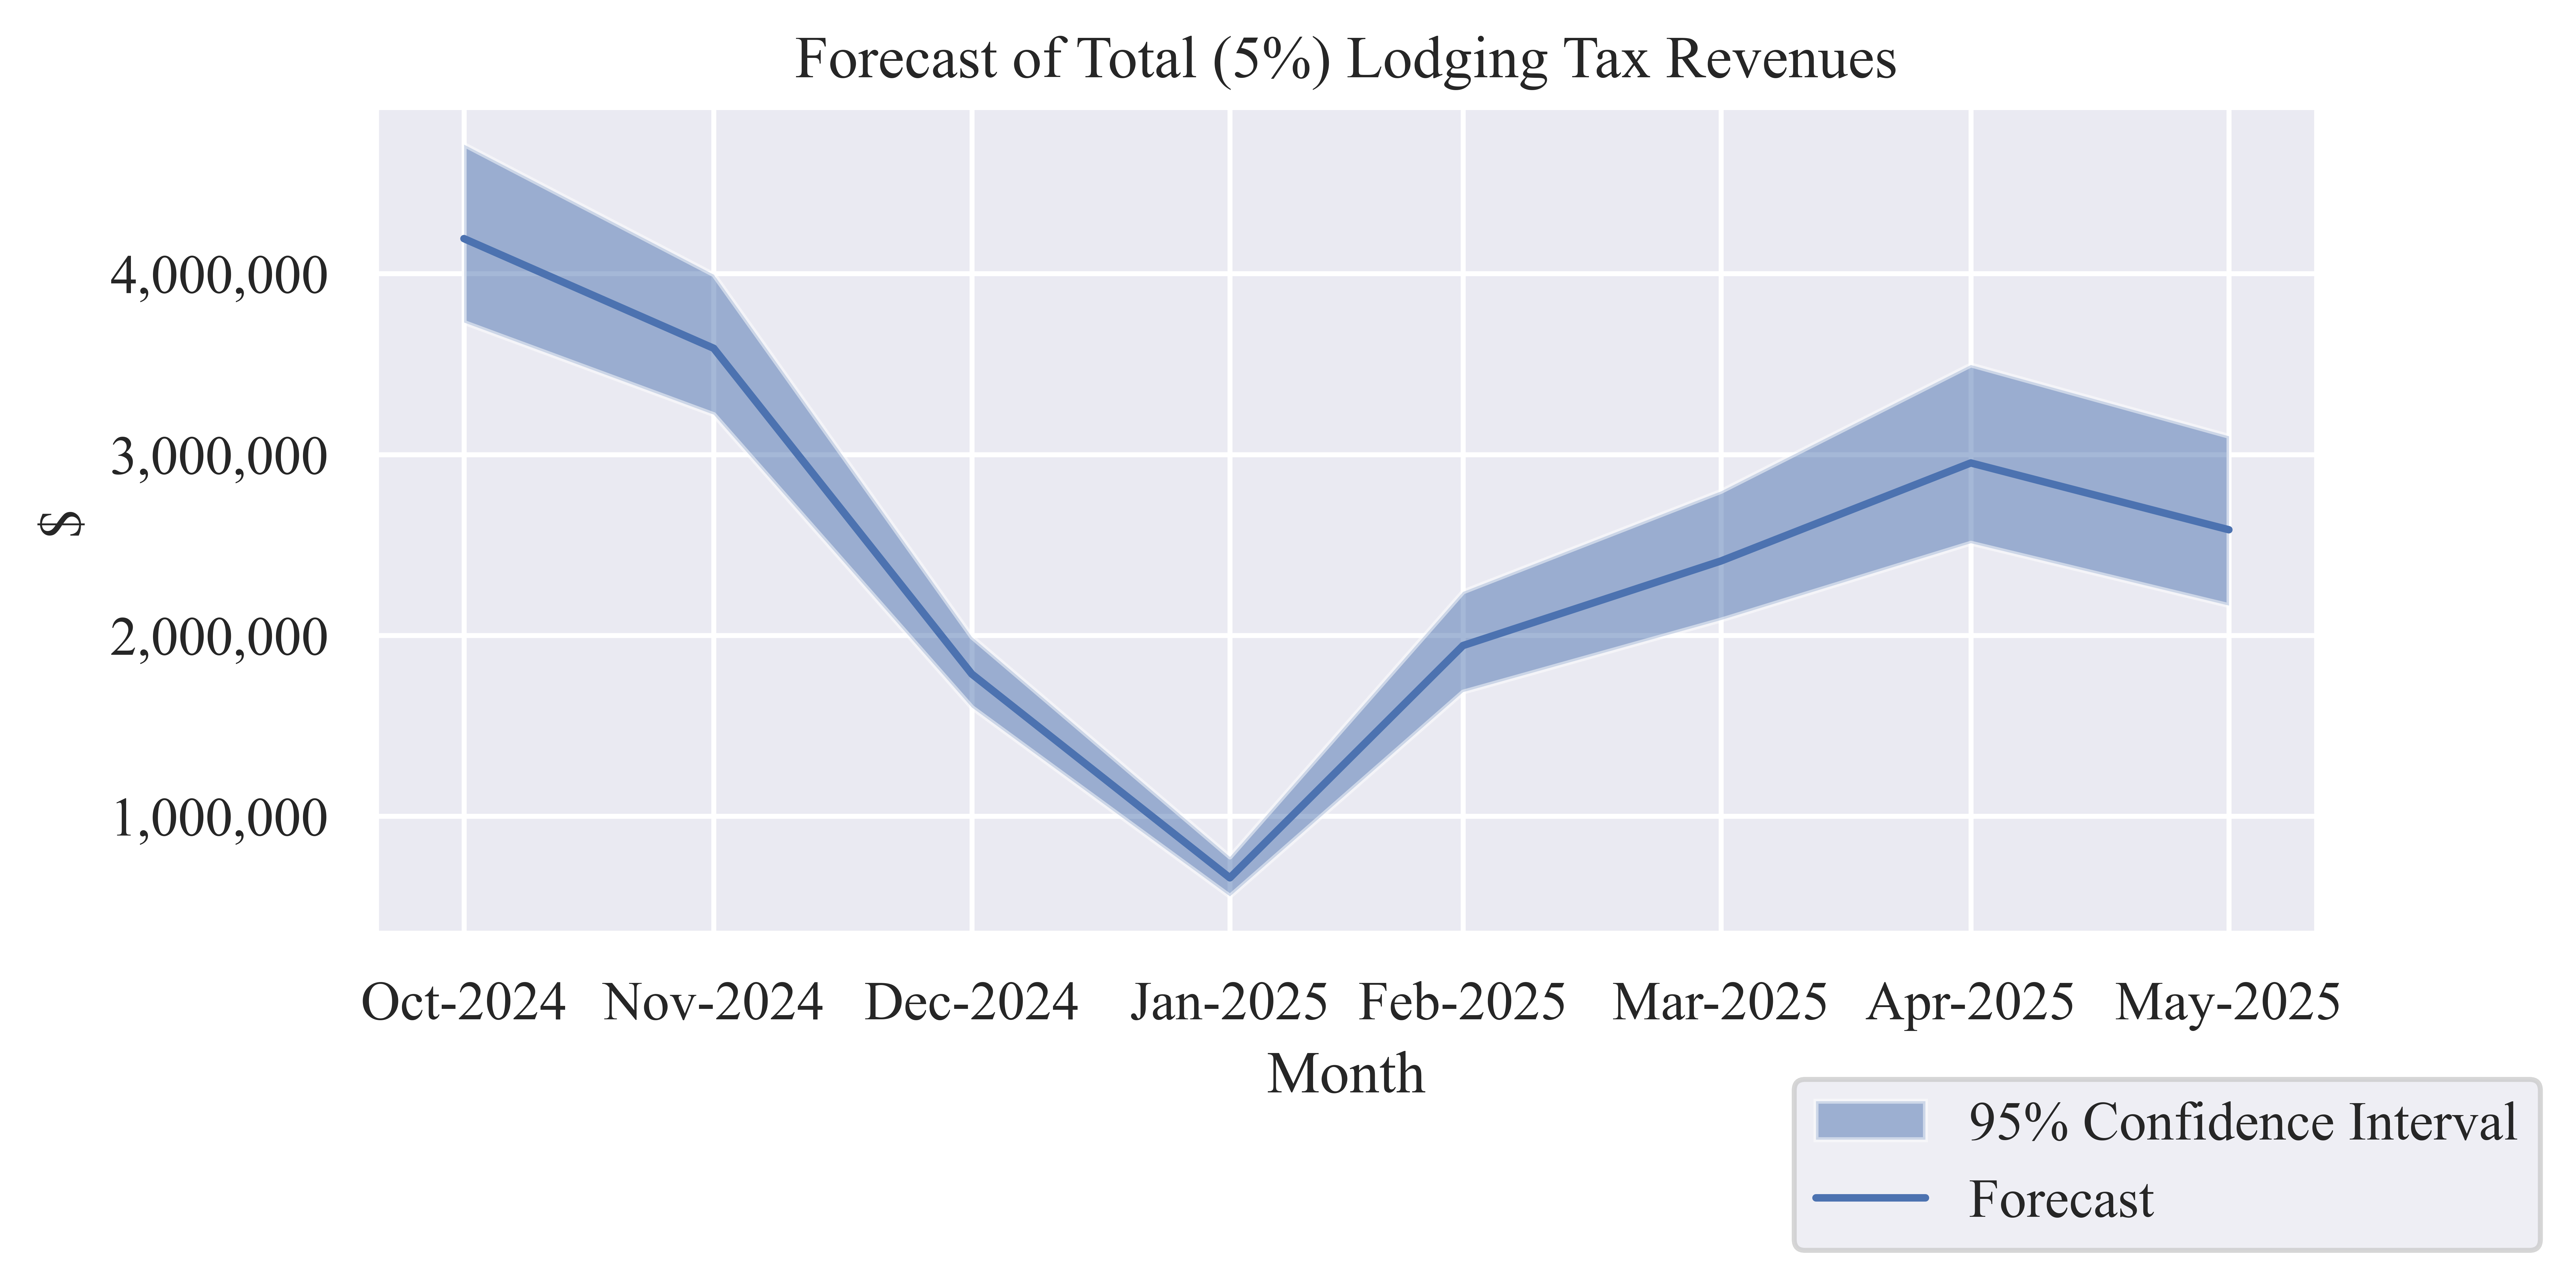
Table 6: Forecast of Monthly Total (5%) Lodging Tax Revenue
| Oct-2024 |
$4,193,811 |
$3,730,840 |
$4,714,233 |
| Nov-2024 |
$3,587,455 |
$3,221,337 |
$3,995,185 |
| Dec-2024 |
$1,786,674 |
$1,602,446 |
$1,992,100 |
| Jan-2025 |
$659,902 |
$558,285 |
$775,939 |
| Feb-2025 |
$1,943,974 |
$1,687,470 |
$2,241,622 |
| Mar-2025 |
$2,411,748 |
$2,085,971 |
$2,797,469 |
| Apr-2025 |
$2,953,644 |
$2,510,619 |
$3,495,789 |
| May-2025 |
$2,584,247 |
$2,165,891 |
$3,101,945 |
Lodging Sector Sales
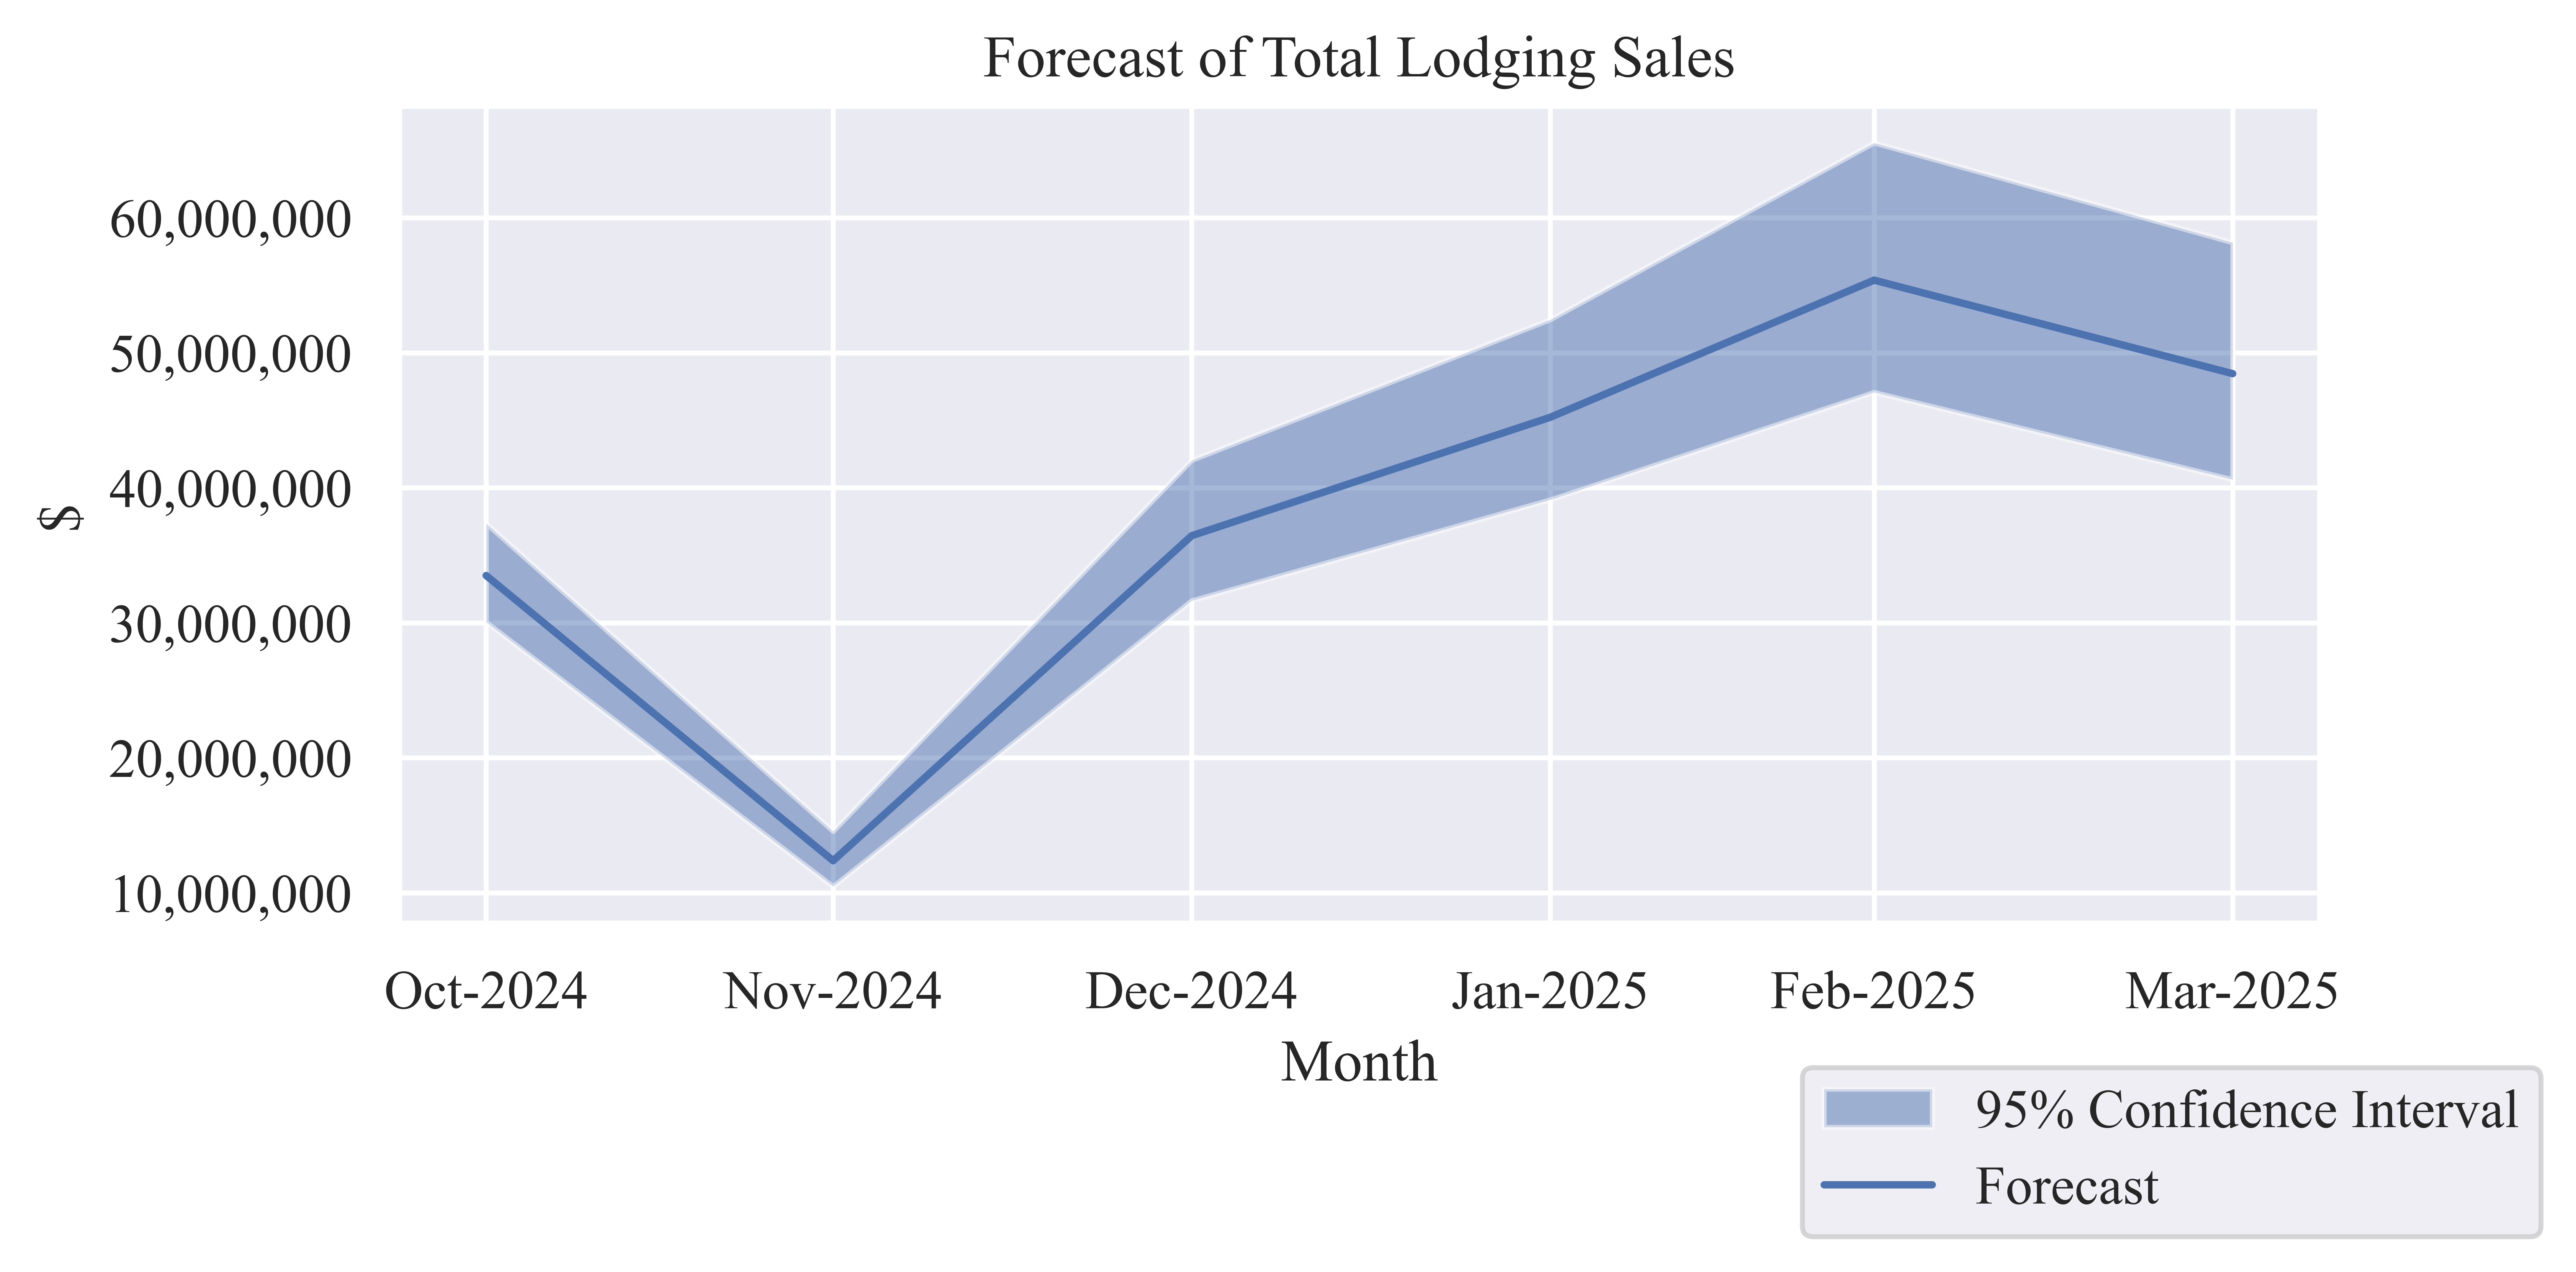
Table 7: Forecast of Monthly Lodging Sales
| Oct-2024 |
$33,500,129 |
$30,045,862 |
$37,351,882 |
| Nov-2024 |
$12,373,170 |
$10,467,852 |
$14,548,862 |
| Dec-2024 |
$36,449,516 |
$31,640,066 |
$42,030,417 |
| Jan-2025 |
$45,220,271 |
$39,111,956 |
$52,452,553 |
| Feb-2025 |
$55,380,833 |
$47,074,101 |
$65,546,044 |
| Mar-2025 |
$48,454,627 |
$40,610,452 |
$58,161,467 |
Economic Indicators
Table 8: Six-Month Forecast of Economic Output from Lodging Sales
| Low Estimate |
$215,599,413 |
$46,525,337 |
$11,708,572 |
$273,833,322 |
| Median Estimate |
$251,645,932 |
$54,304,006 |
$13,666,153 |
$319,616,091 |
| High Estimate |
$294,694,019 |
$63,593,584 |
$16,003,980 |
$374,291,582 |
Table 9: Six-Month Forecast of Employee Compensation from Lodging Sales
| Low Estimate |
$69,732,451 |
$15,676,075 |
$3,229,932 |
$88,638,459 |
| Median Estimate |
$81,391,166 |
$18,296,991 |
$3,769,951 |
$103,458,109 |
| High Estimate |
$95,314,435 |
$21,426,987 |
$4,414,865 |
$121,156,288 |
Table 10: Six-Month Forecast of Contribution to Gross County Product from Lodging
Sales
| Low Estimate |
$155,974,404 |
$27,343,285 |
$7,063,401 |
$190,381,089 |
| Median Estimate |
$182,052,092 |
$31,914,866 |
$8,244,346 |
$222,211,304 |
| High Estimate |
$213,195,033 |
$37,374,420 |
$9,654,680 |
$260,224,133 |
Table 11: Six-Month Forecast of Employment from Lodging Sales
| Low Estimate |
2,739 |
440 |
122 |
3,301 |
| Median Estimate |
3,197 |
513 |
142 |
3,853 |
| High Estimate |
3,744 |
601 |
167 |
4,512 |
