Jackson Hole Economic Forecasting
January 2024 forecast
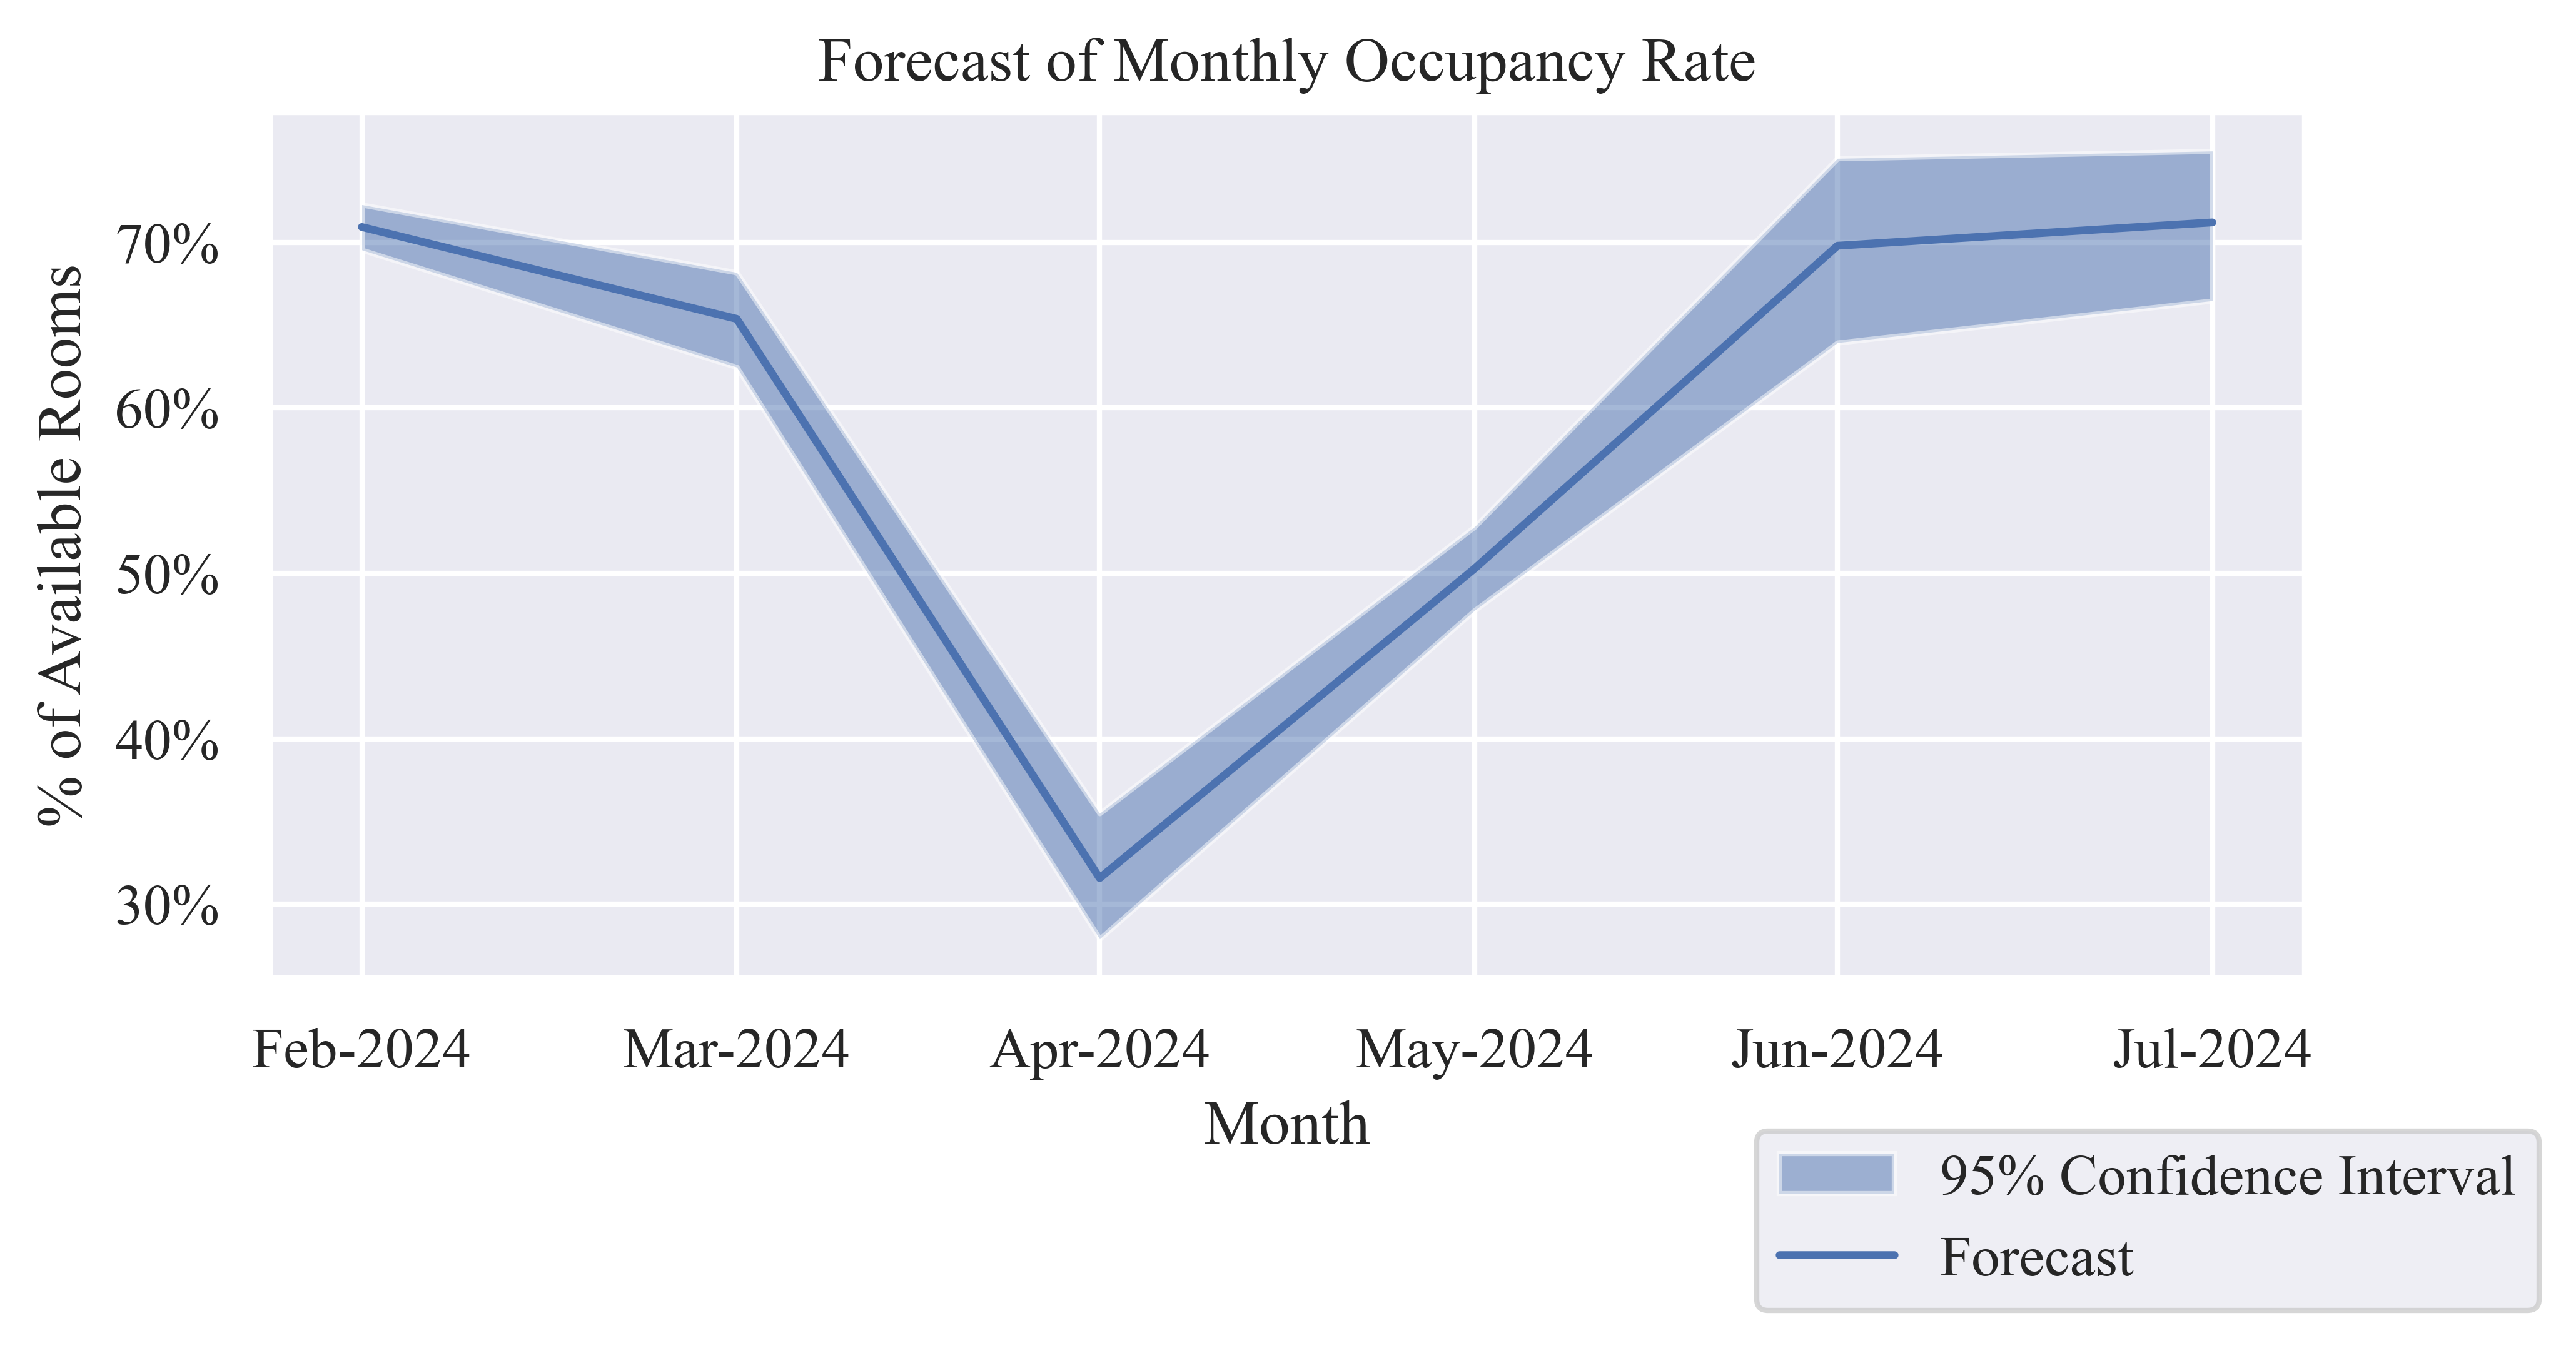
Occupancy Rate (OR)
Table 1: Forecast of Monthly Occupancy Rate
| Feb-2024 |
70.93% |
69.55% |
72.28% |
| Mar-2024 |
65.38% |
62.46% |
68.18% |
| Apr-2024 |
31.58% |
27.91% |
35.50% |
| May-2024 |
50.29% |
47.77% |
52.82% |
| Jun-2024 |
69.80% |
63.94% |
75.08% |
| Jul-2024 |
71.21% |
66.48% |
75.53% |
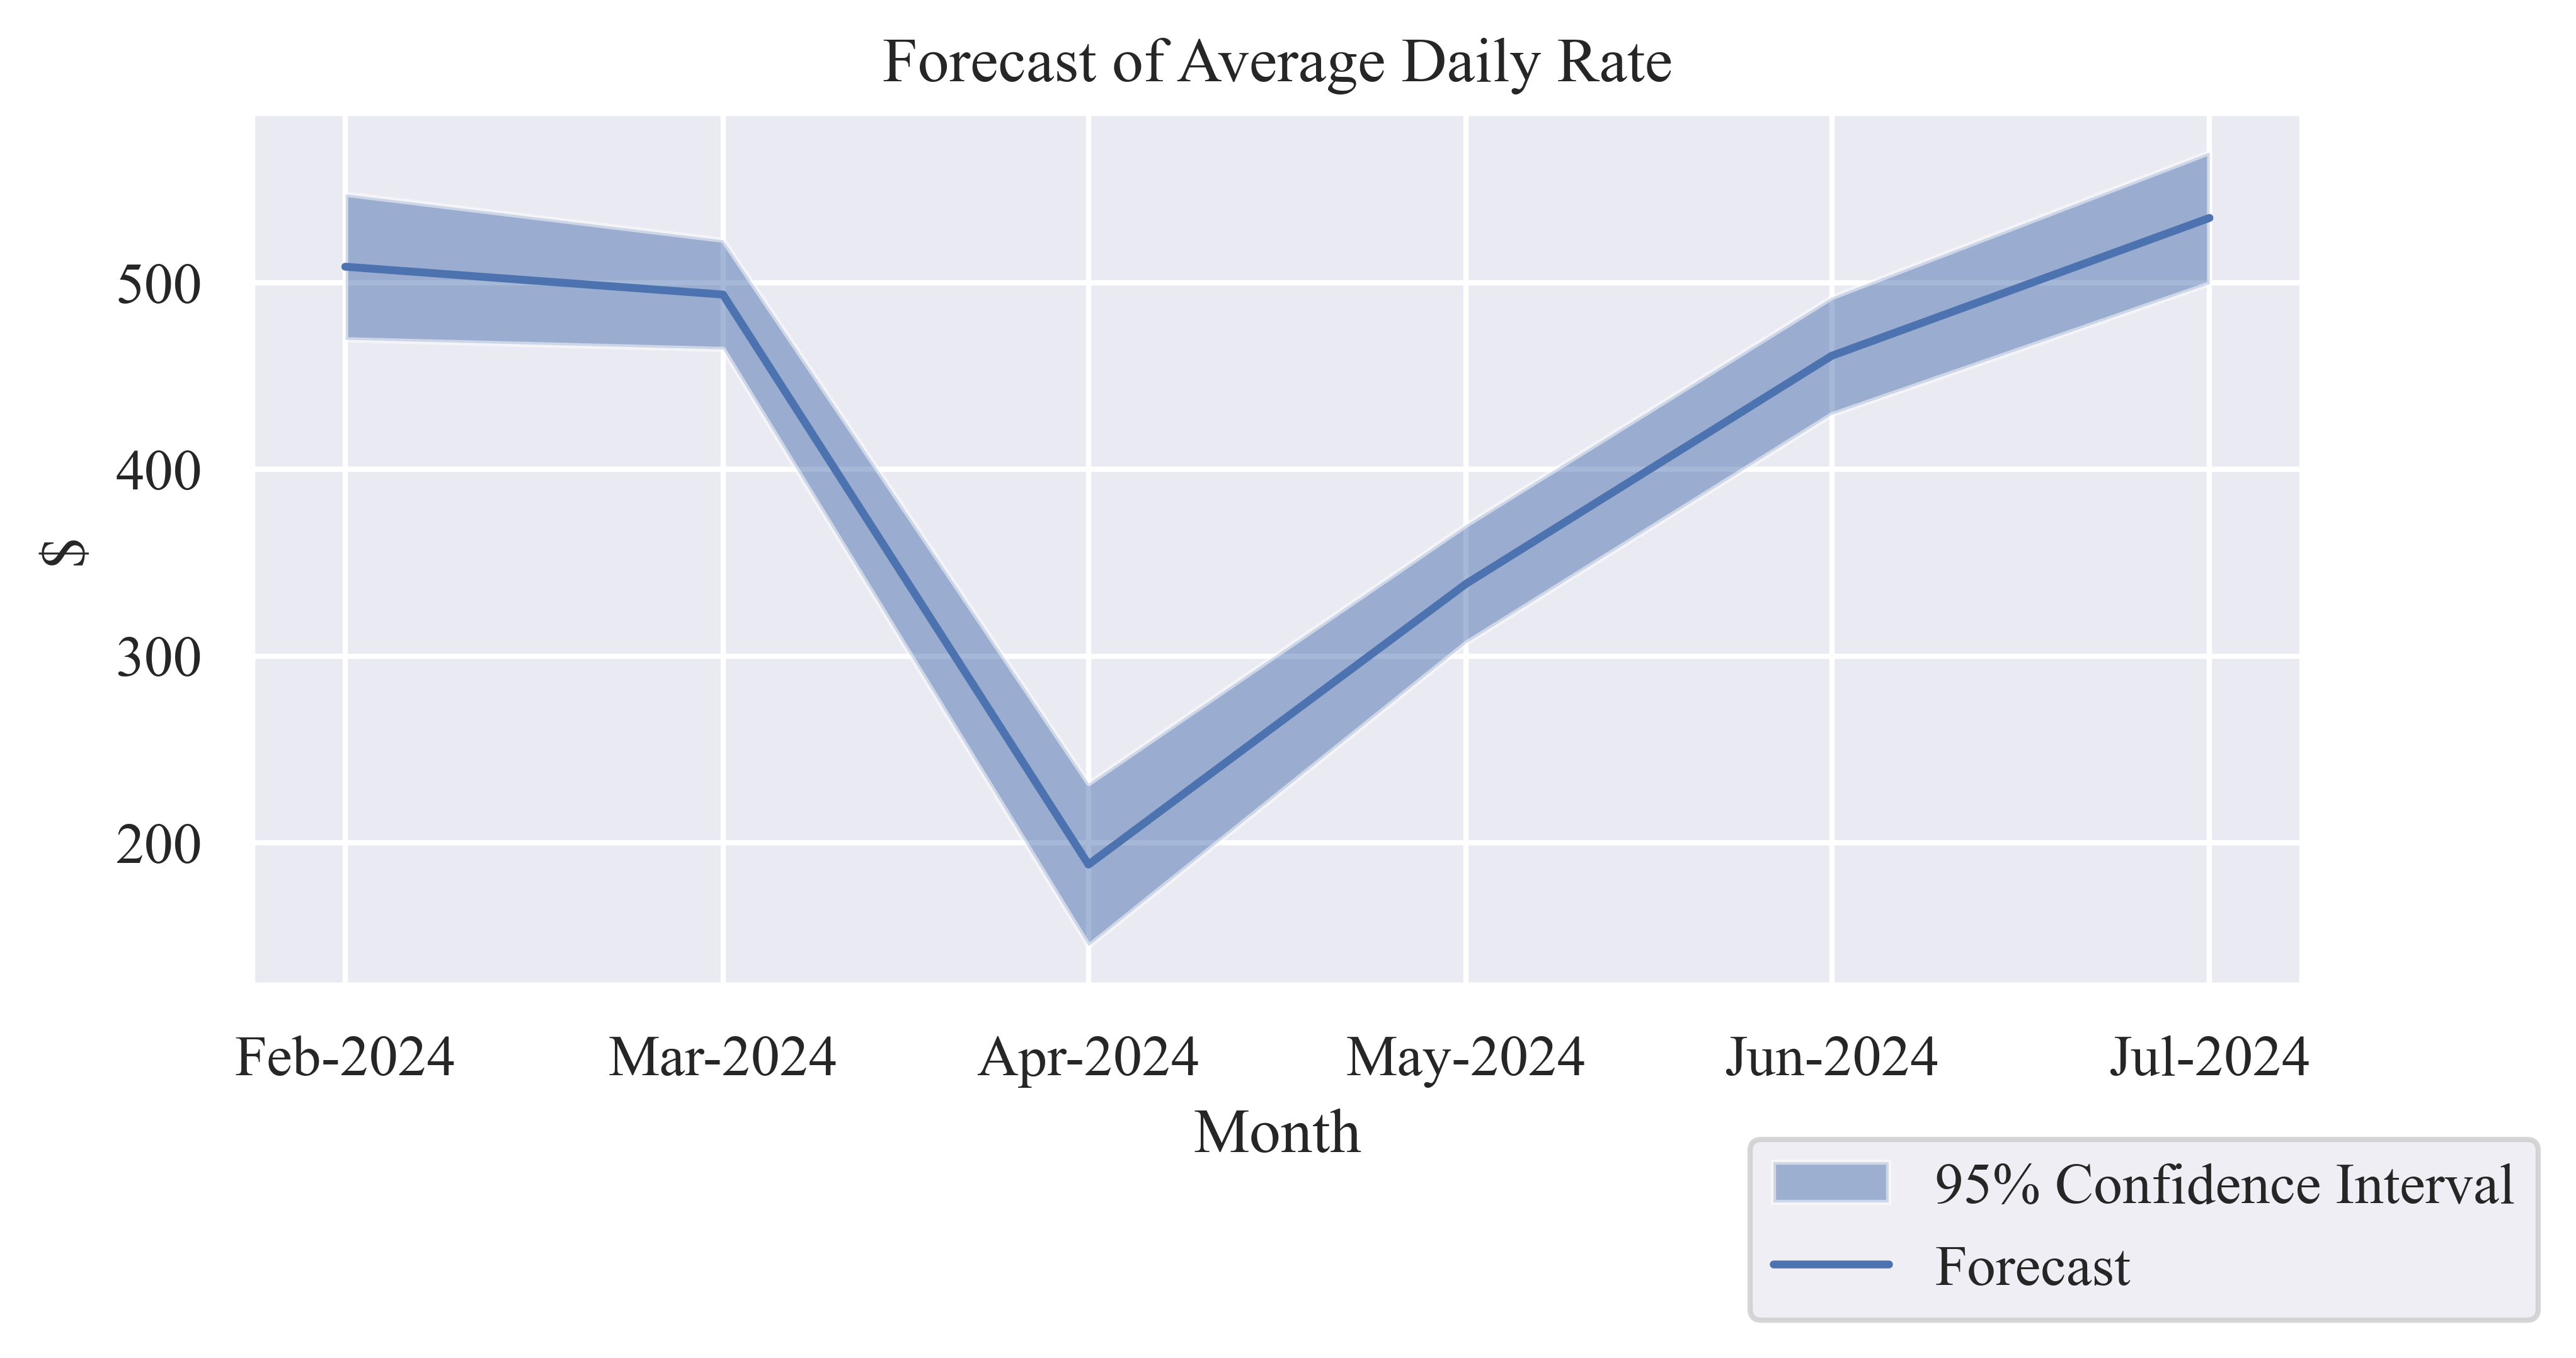
Average Daily Rate (ADR)
Table 2: Forecast of Monthly Average Daily Rate
| Feb-2024 |
$508.53 |
$469.57 |
$547.50 |
| Mar-2024 |
$493.62 |
$464.38 |
$522.87 |
| Apr-2024 |
$188.30 |
$144.76 |
$231.84 |
| May-2024 |
$338.75 |
$307.12 |
$370.38 |
| Jun-2024 |
$460.83 |
$429.45 |
$492.22 |
| Jul-2024 |
$534.66 |
$499.46 |
$569.86 |
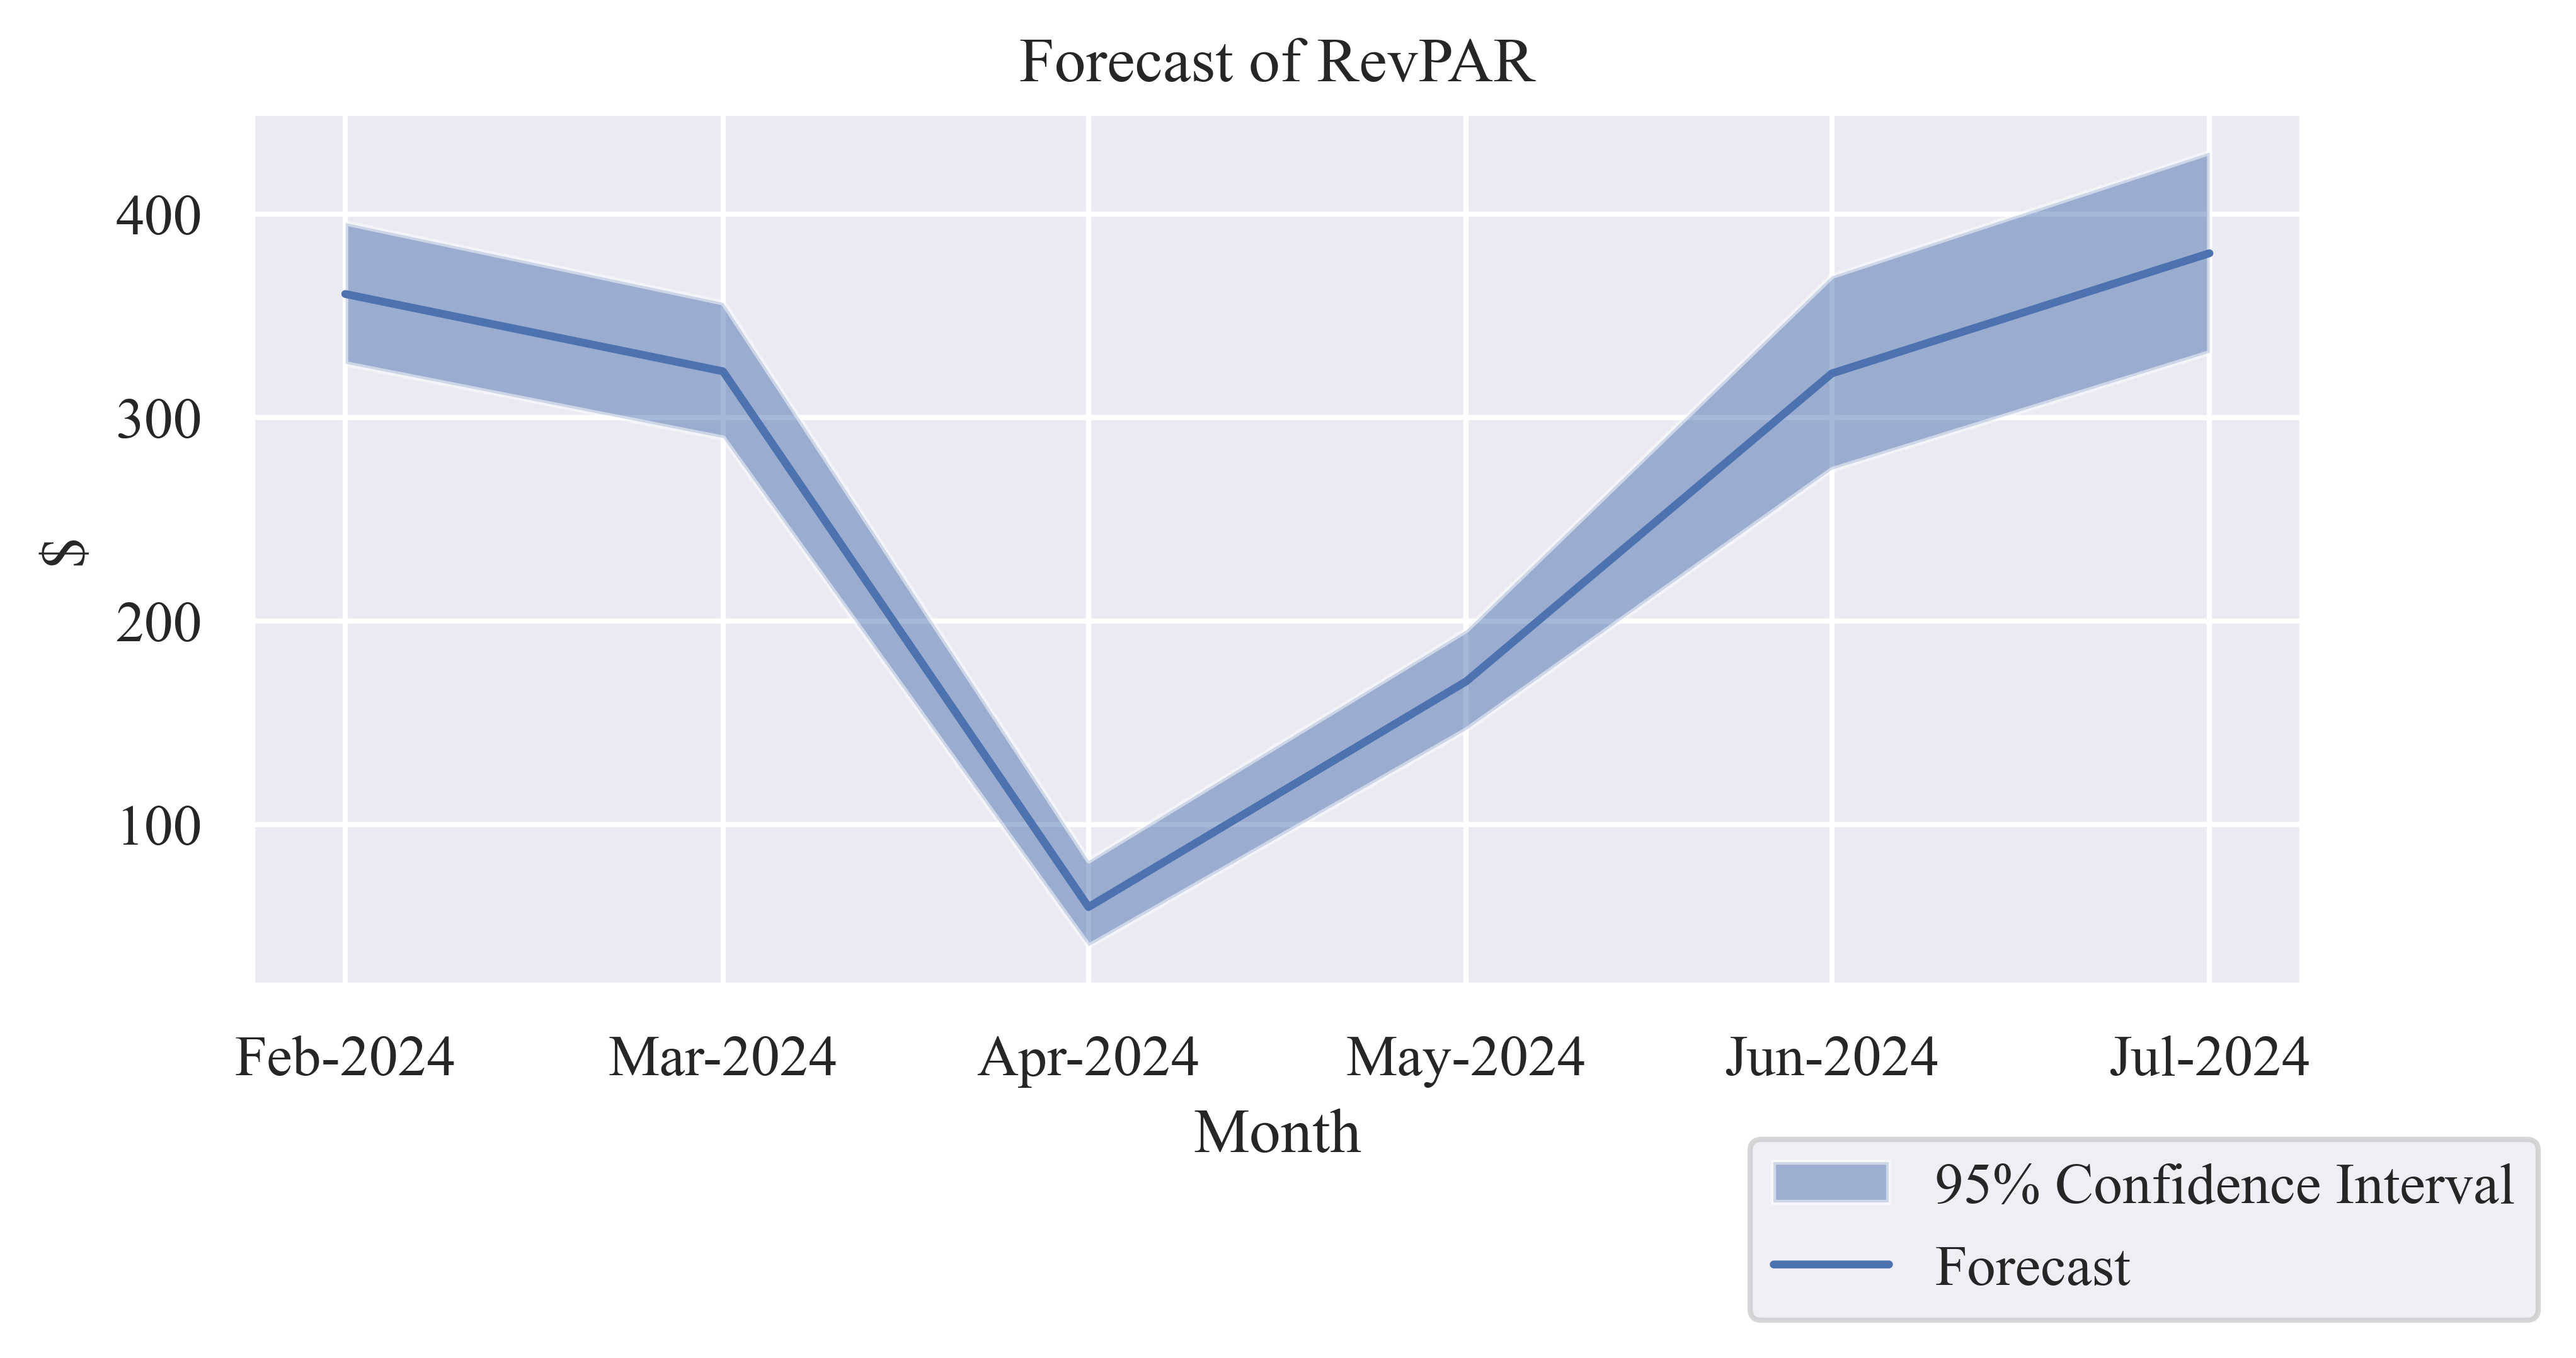
Revenue per Available Room (RevPAR)
Table 3: Forecast of Monthly RevPAR
| Feb-2024 |
$360.72 |
$326.57 |
$395.74 |
| Mar-2024 |
$322.73 |
$290.06 |
$356.52 |
| Apr-2024 |
$59.47 |
$40.40 |
$82.31 |
| May-2024 |
$170.37 |
$146.70 |
$195.63 |
| Jun-2024 |
$321.67 |
$274.60 |
$369.57 |
| Jul-2024 |
$380.75 |
$332.03 |
$430.39 |
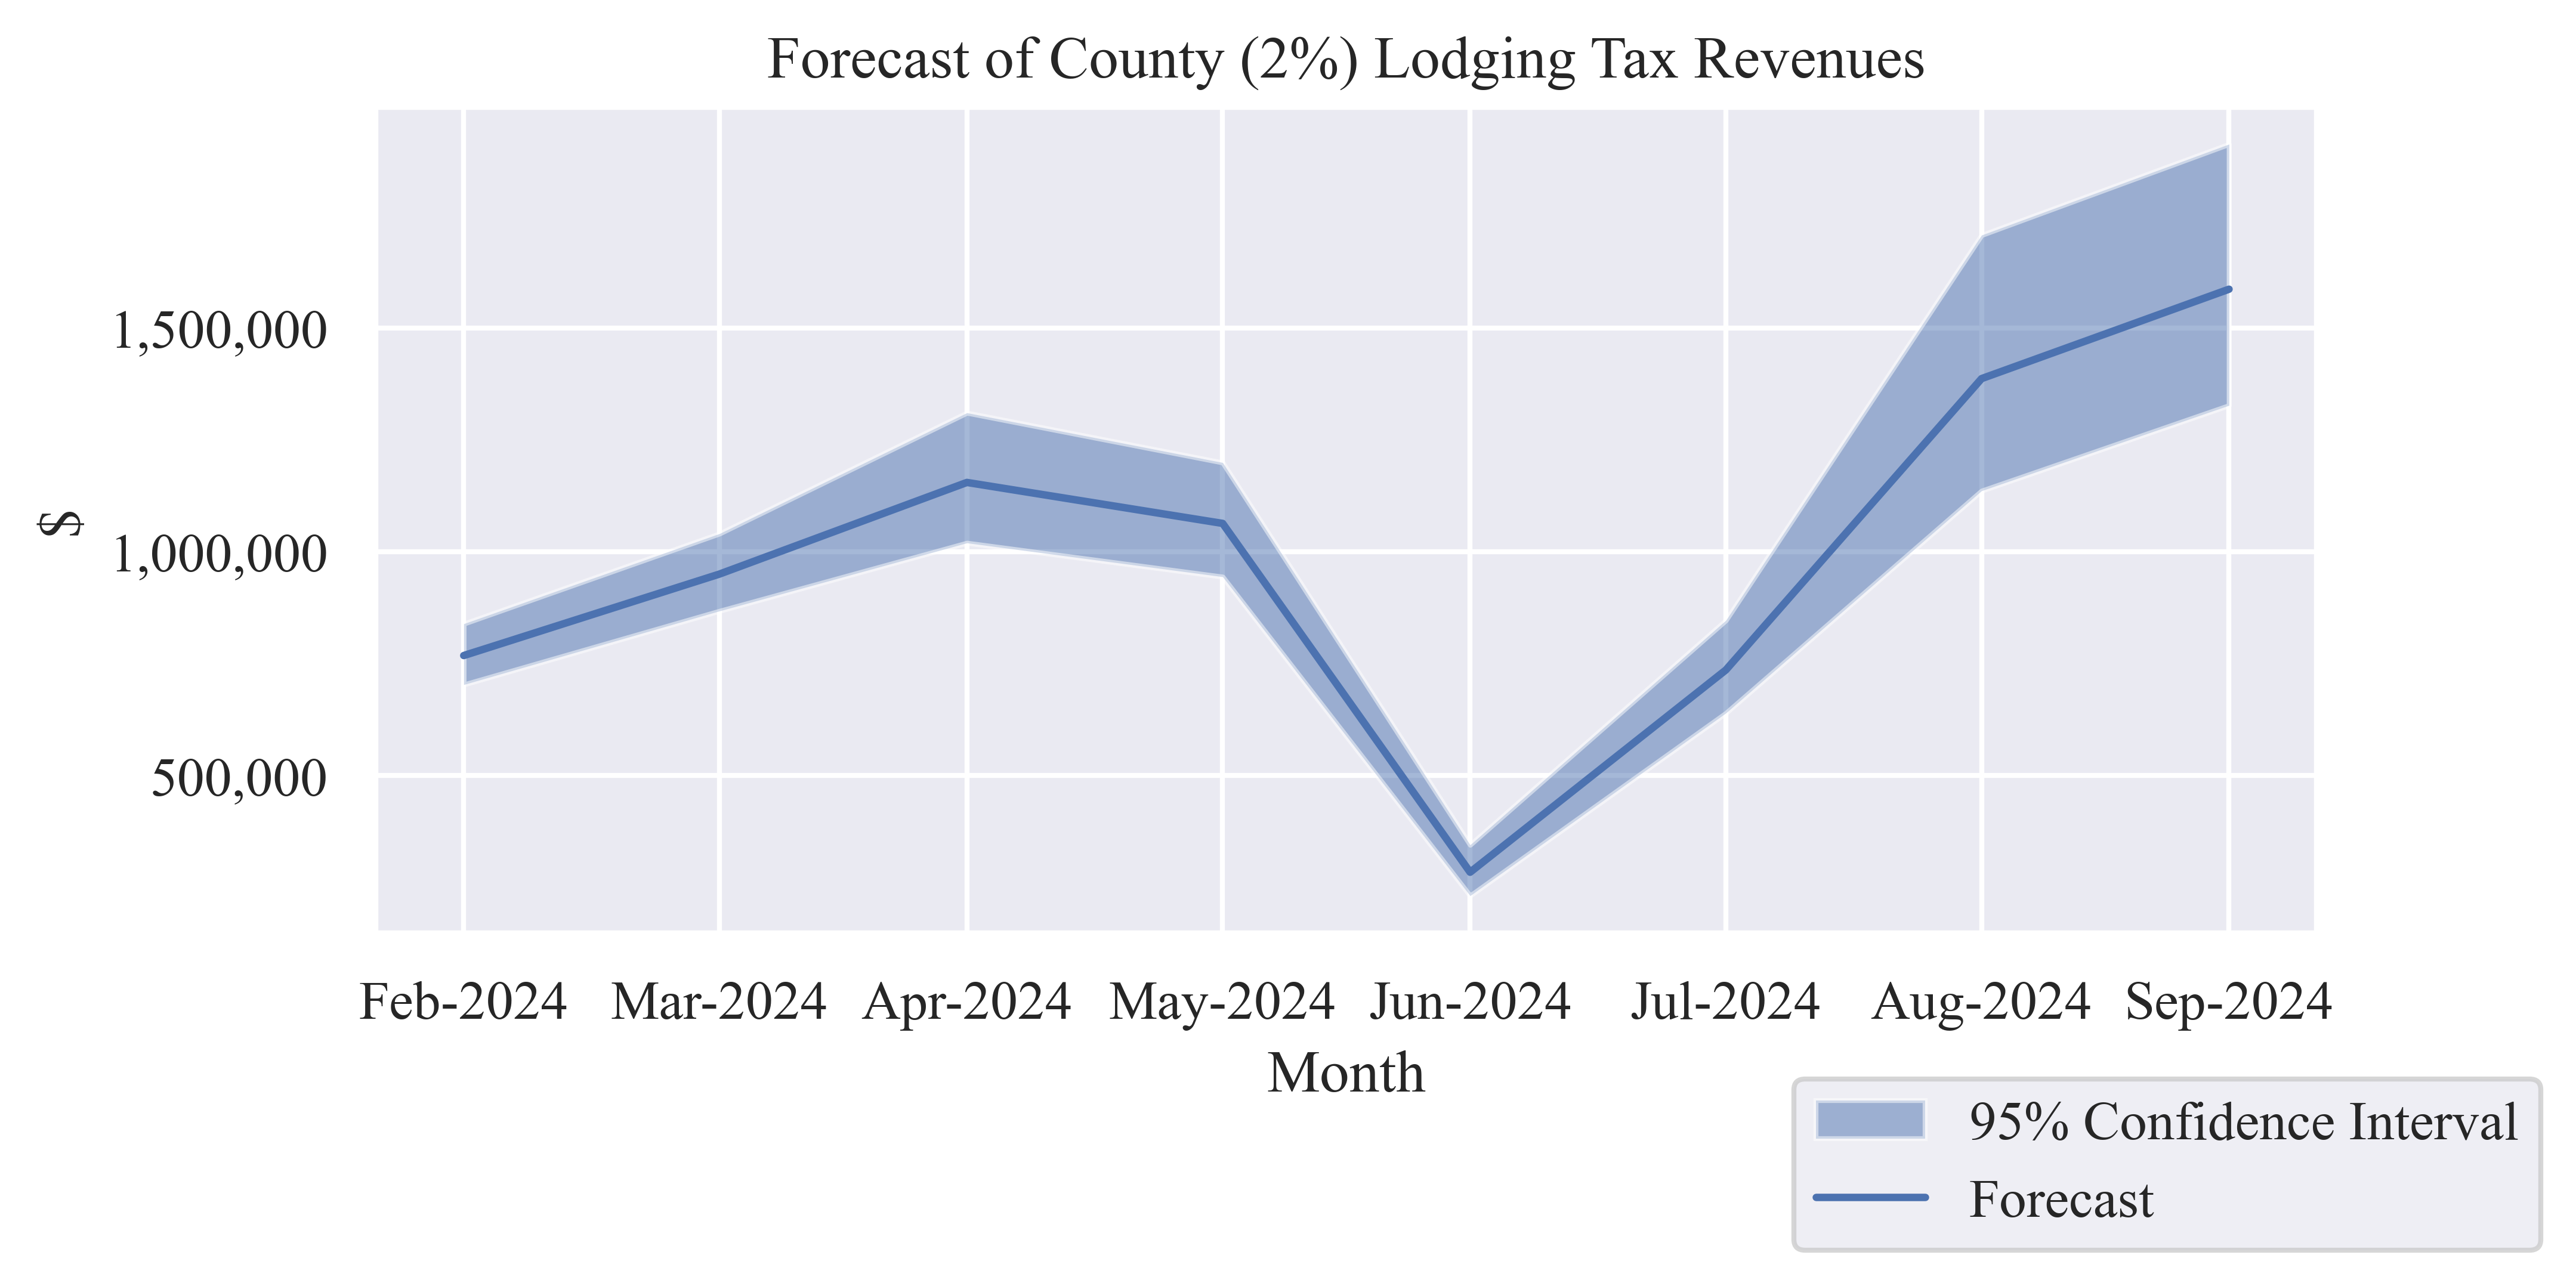
Tax Revenues
Table 4: Forecast County (2%) Lodging Tax Revenue
| Feb-2024 |
$768,325 |
$703,376 |
$839,271 |
| Mar-2024 |
$950,302 |
$867,846 |
$1,040,592 |
| Apr-2024 |
$1,154,978 |
$1,019,890 |
$1,310,490 |
| May-2024 |
$1,063,472 |
$944,320 |
$1,199,379 |
| Jun-2024 |
$284,338 |
$231,912 |
$345,484 |
| Jul-2024 |
$736,083 |
$639,757 |
$846,891 |
| Aug-2024 |
$1,386,863 |
$1,136,305 |
$1,707,374 |
| Sep-2024 |
$1,586,590 |
$1,327,066 |
$1,910,574 |
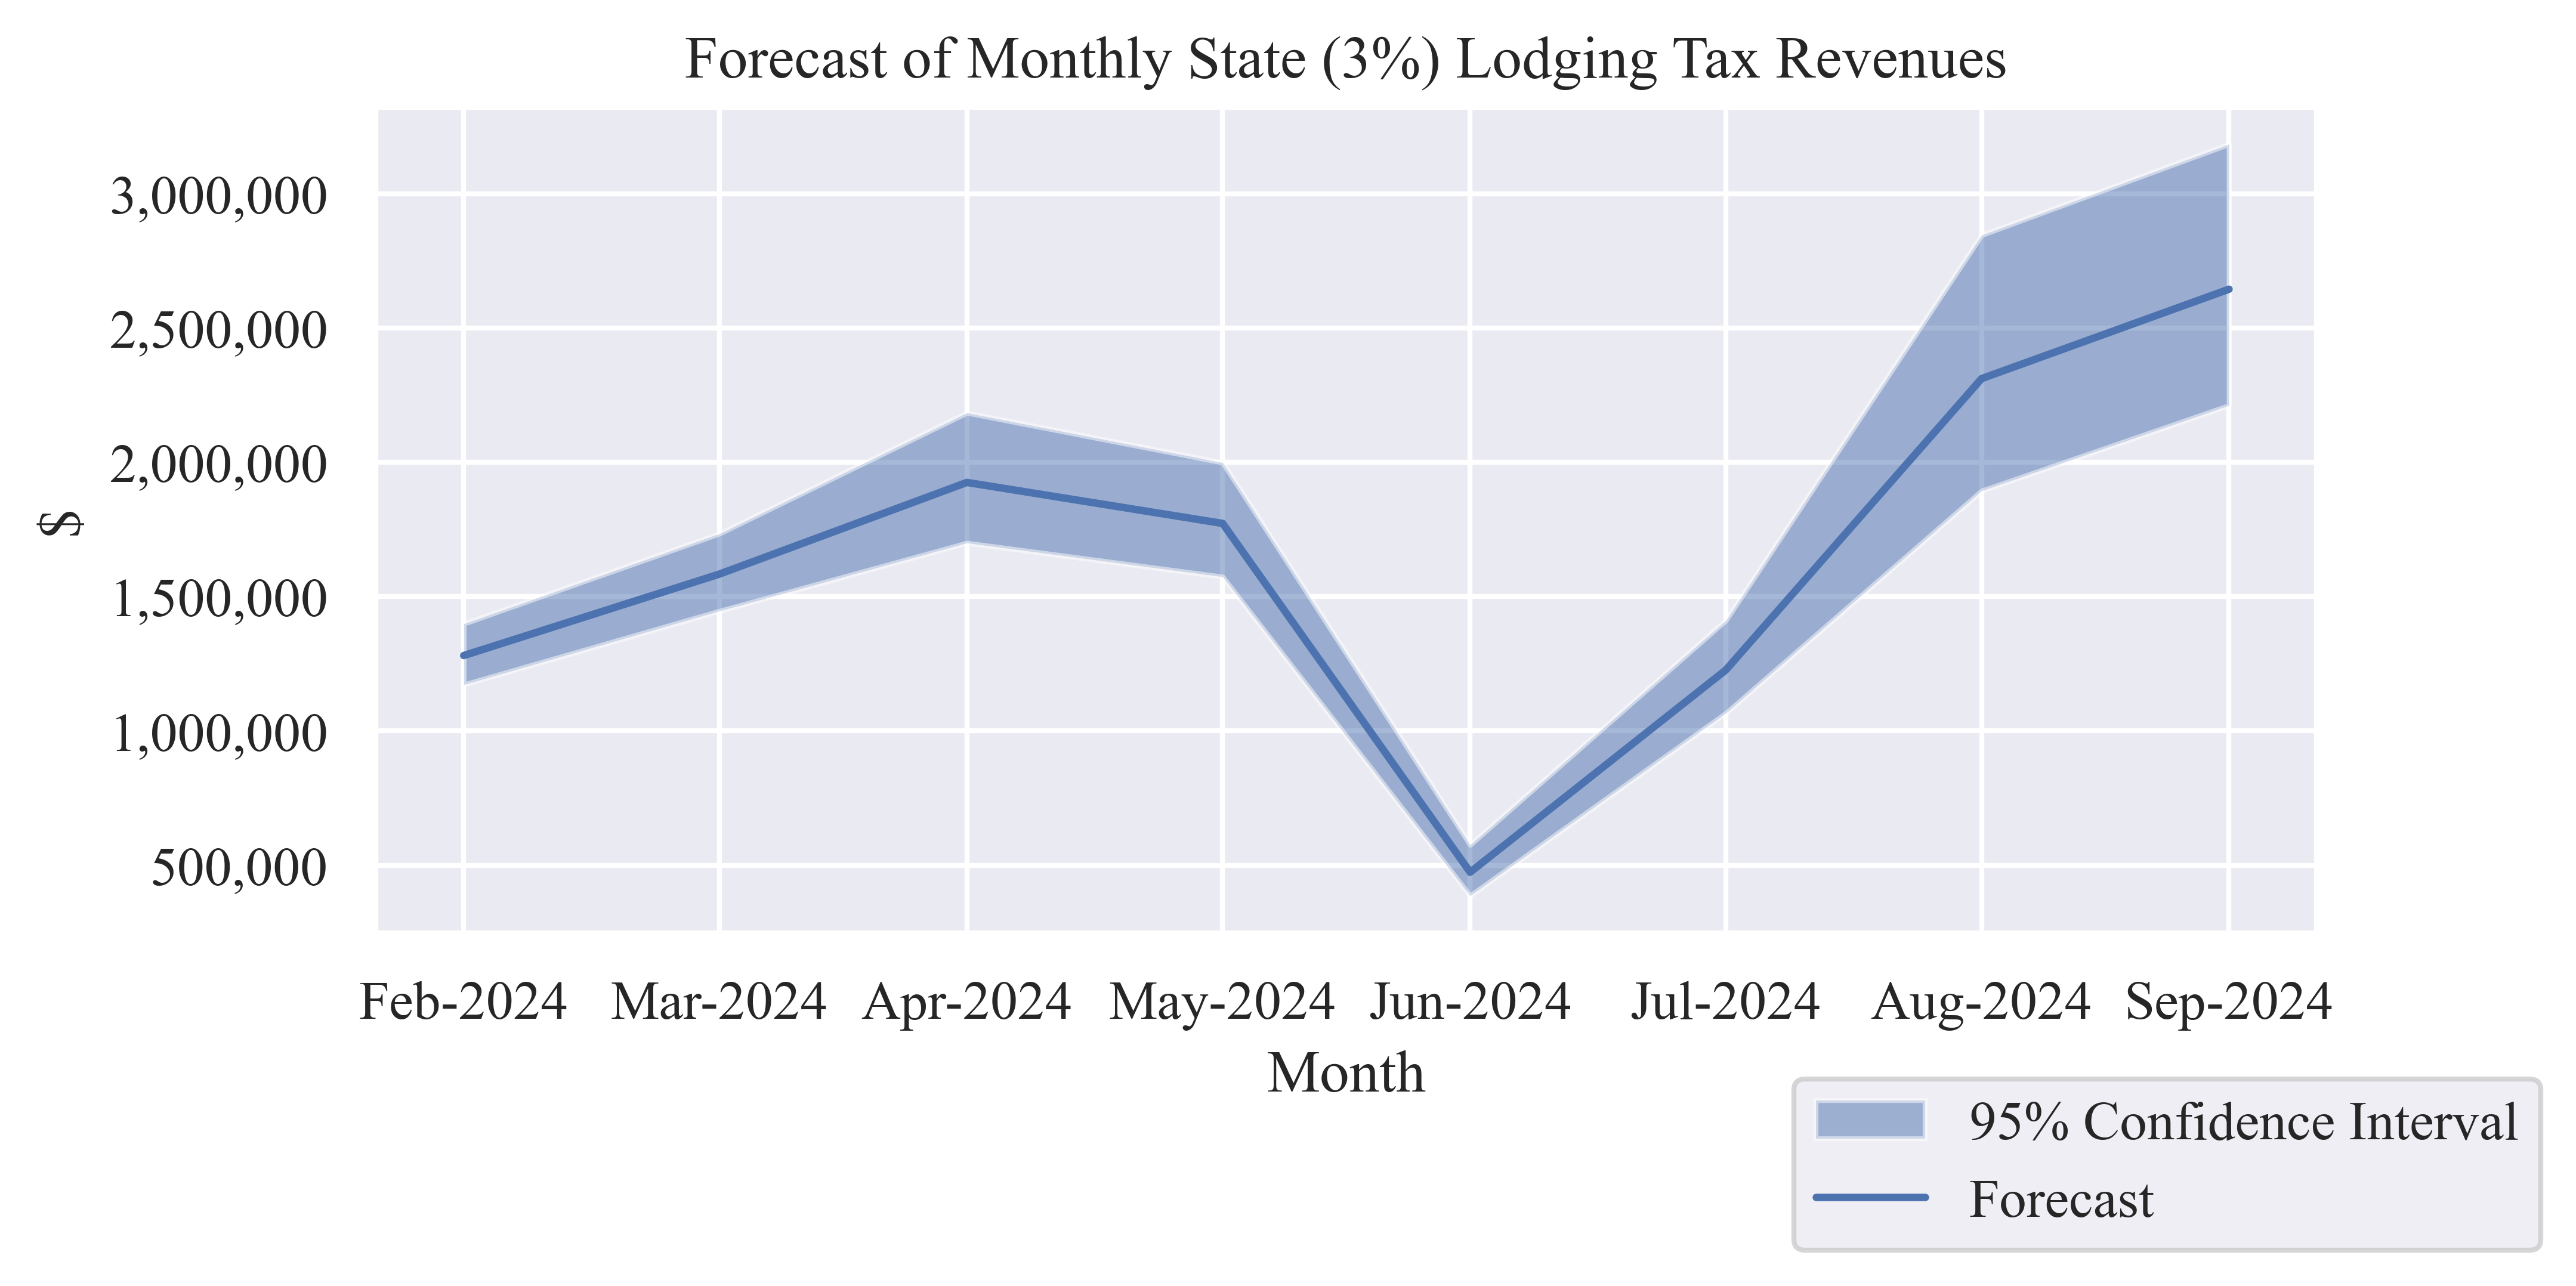
Table 5: Forecast State (3%) Lodging Tax Revenue
| Feb-2024 |
$1,280,542 |
$1,172,294 |
$1,398,785 |
| Mar-2024 |
$1,583,837 |
$1,446,410 |
$1,734,321 |
| Apr-2024 |
$1,924,964 |
$1,699,817 |
$2,184,150 |
| May-2024 |
$1,772,453 |
$1,573,867 |
$1,998,965 |
| Jun-2024 |
$473,896 |
$386,521 |
$575,807 |
| Jul-2024 |
$1,226,805 |
$1,066,261 |
$1,411,485 |
| Aug-2024 |
$2,311,438 |
$1,893,842 |
$2,845,623 |
| Sep-2024 |
$2,644,317 |
$2,211,776 |
$3,184,290 |
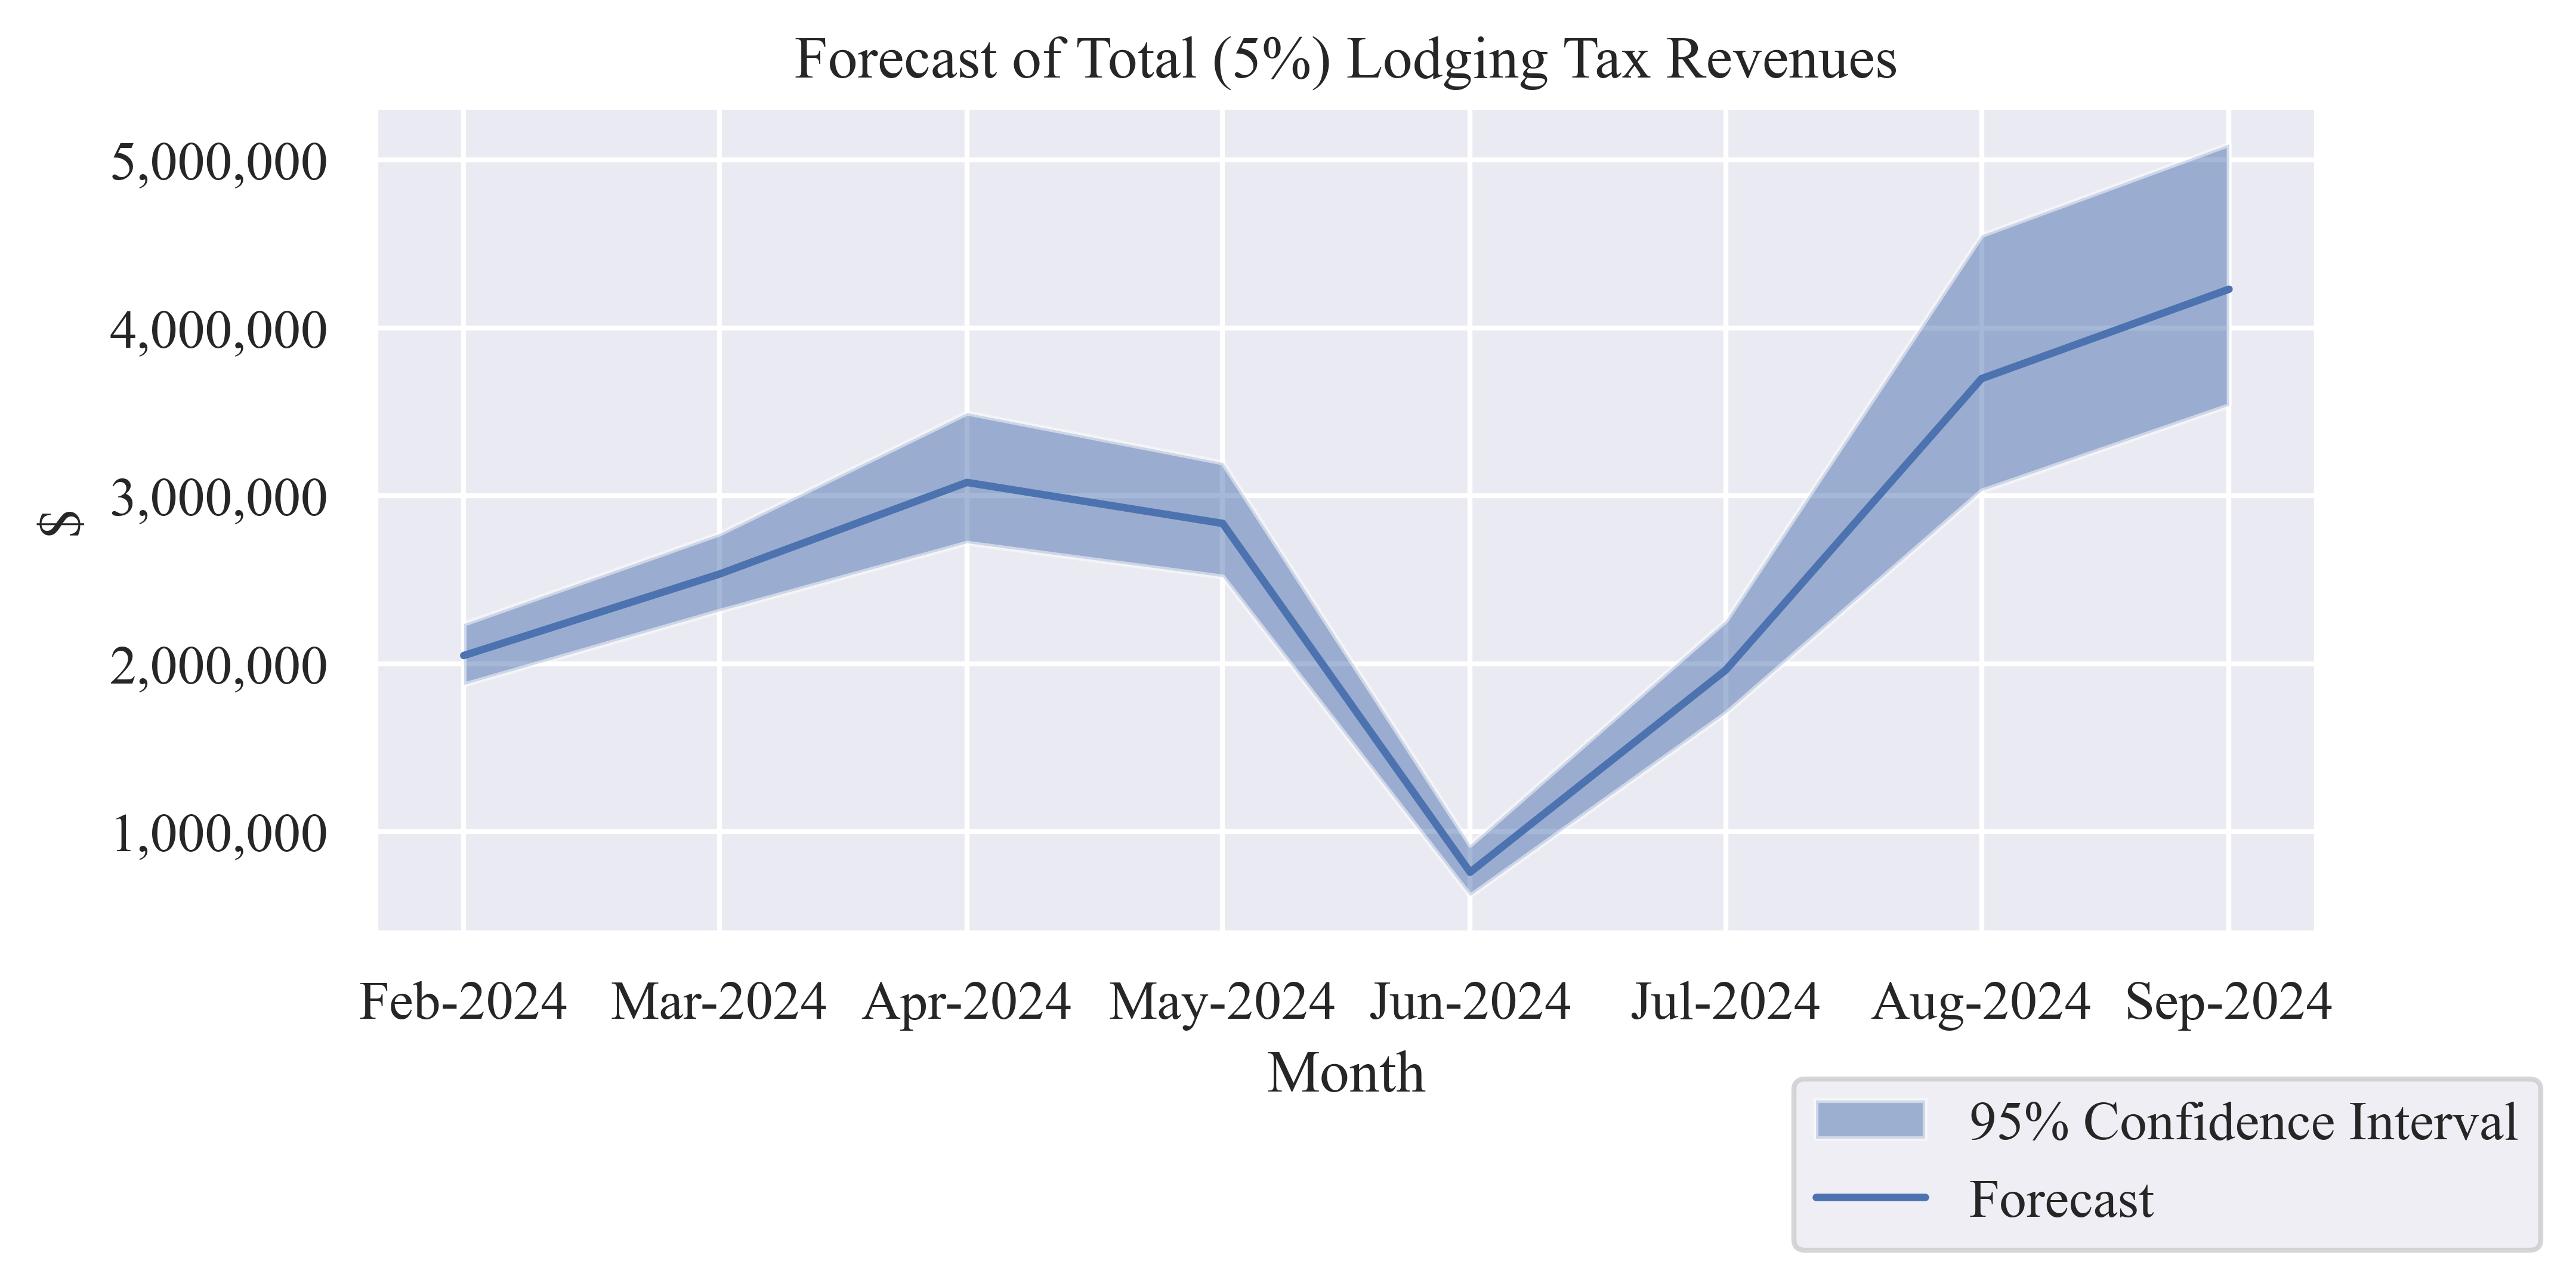
Table 6: Forecast of Monthly Total (5%) Lodging Tax Revenue
| Feb-2024 |
$2,048,867 |
$1,875,670 |
$2,238,056 |
| Mar-2024 |
$2,534,139 |
$2,314,256 |
$2,774,913 |
| Apr-2024 |
$3,079,942 |
$2,719,707 |
$3,494,641 |
| May-2024 |
$2,835,924 |
$2,518,187 |
$3,198,343 |
| Jun-2024 |
$758,234 |
$618,433 |
$921,291 |
| Jul-2024 |
$1,962,887 |
$1,706,018 |
$2,258,377 |
| Aug-2024 |
$3,698,300 |
$3,030,147 |
$4,552,997 |
| Sep-2024 |
$4,230,907 |
$3,538,842 |
$5,094,864 |
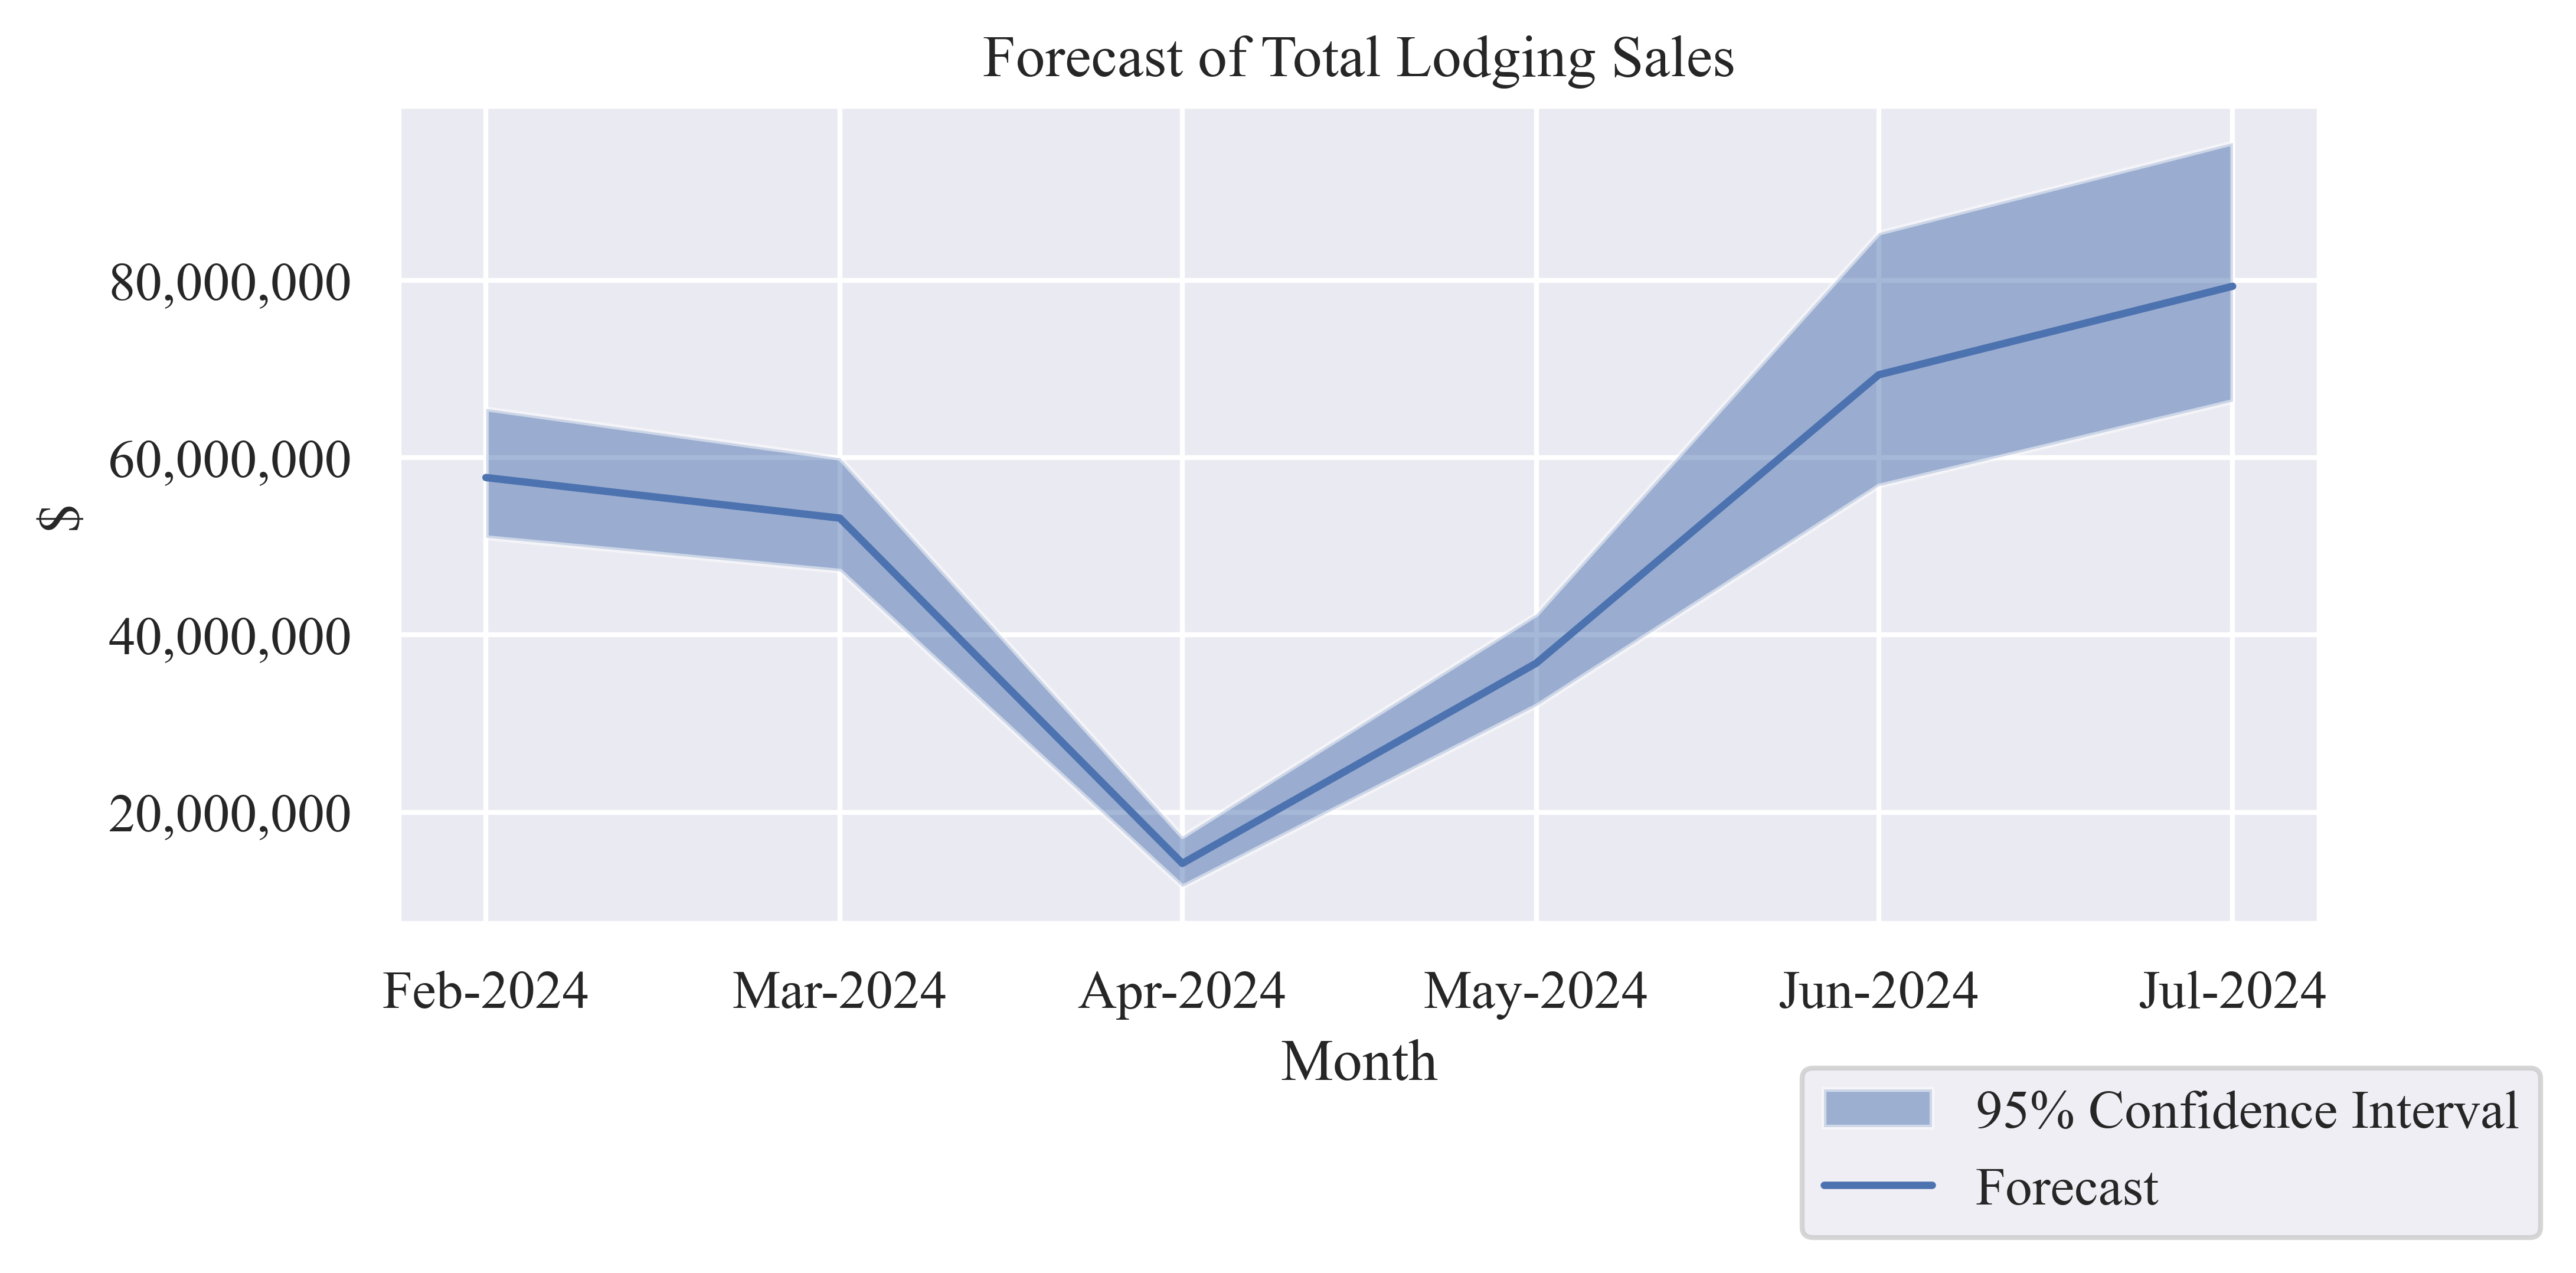
Lodging Sector Sales
Table 7: Forecast of Monthly Lodging Sales
| Feb-2024 |
$57,748,914 |
$50,994,507 |
$65,524,510 |
| Mar-2024 |
$53,173,576 |
$47,216,015 |
$59,968,939 |
| Apr-2024 |
$14,216,890 |
$11,595,620 |
$17,274,206 |
| May-2024 |
$36,804,137 |
$31,987,830 |
$42,344,561 |
| Jun-2024 |
$69,343,128 |
$56,815,248 |
$85,368,688 |
| Jul-2024 |
$79,329,511 |
$66,353,284 |
$95,528,699 |
Economic Indicators
Table 8: Six-Month Forecast of Economic Output from Lodging Sales
| Low Estimate |
$264,962,504 |
$56,840,393 |
$14,246,842 |
$336,049,738 |
| Median Estimate |
$310,616,156 |
$66,634,124 |
$16,701,605 |
$393,951,885 |
| High Estimate |
$366,009,604 |
$78,517,260 |
$19,680,071 |
$464,206,935 |
Table 9: Six-Month Forecast of Employee Compensation from Lodging Sales
| Low Estimate |
$85,698,215 |
$19,177,653 |
$3,900,742 |
$108,776,610 |
| Median Estimate |
$100,464,216 |
$22,482,007 |
$4,572,849 |
$127,519,071 |
| High Estimate |
$118,380,410 |
$26,491,315 |
$5,388,344 |
$150,260,068 |
Table 10: Six-Month Forecast of Contribution to Gross County Product from Lodging
Sales
| Low Estimate |
$191,685,905 |
$33,440,372 |
$8,588,941 |
$233,715,217 |
| Median Estimate |
$224,713,829 |
$39,202,225 |
$10,068,835 |
$273,984,890 |
| High Estimate |
$264,787,965 |
$46,193,318 |
$11,864,452 |
$322,845,734 |
Table 11: Six-Month Forecast of Employment from Lodging Sales
| Low Estimate |
3,367 |
538 |
147 |
4,052 |
| Median Estimate |
3,947 |
631 |
173 |
4,750 |
| High Estimate |
4,651 |
743 |
204 |
5,597 |