Jackson Hole Economic Forecasting
March 2024 Forecast
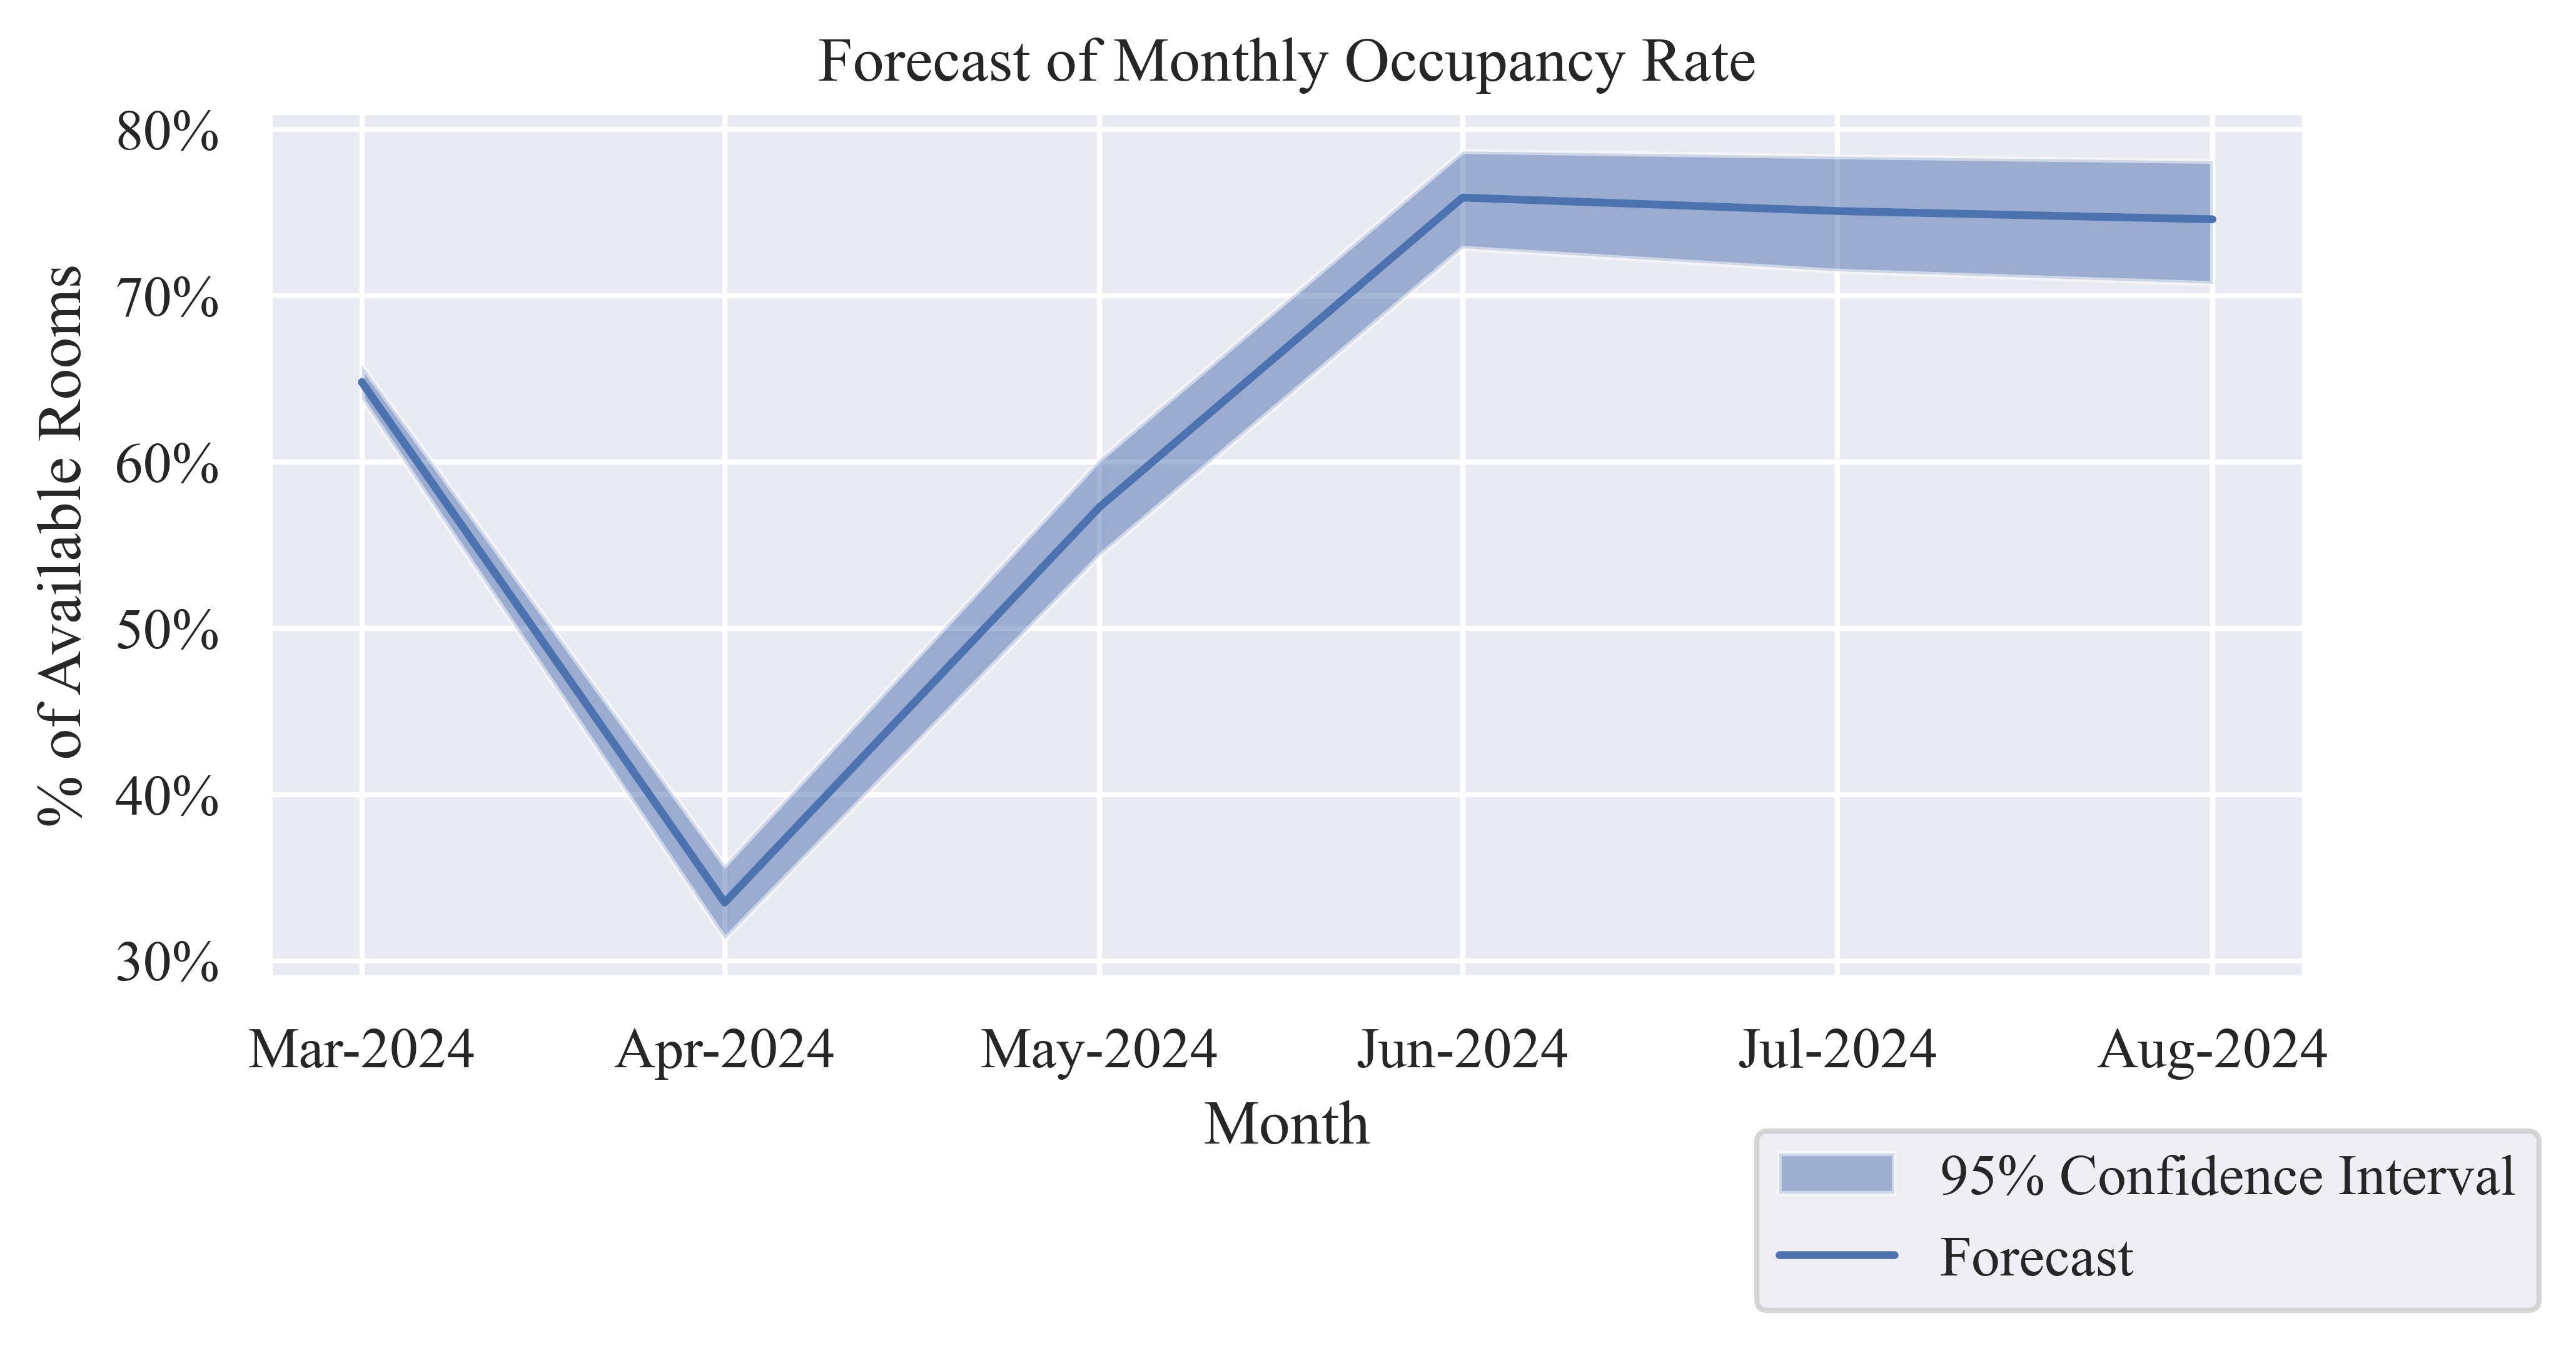
Occupancy Rate (OR)
Table 1: Forecast of Monthly Occupancy Rate
| Mar-2024 |
64.81% |
63.80% |
65.82% |
| Apr-2024 |
33.50% |
31.31% |
35.76% |
| May-2024 |
57.30% |
54.38% |
60.17% |
| Jun-2024 |
75.92% |
72.88% |
78.71% |
| Jul-2024 |
75.11% |
71.50% |
78.40% |
| Aug-2024 |
74.61% |
70.75% |
78.12% |
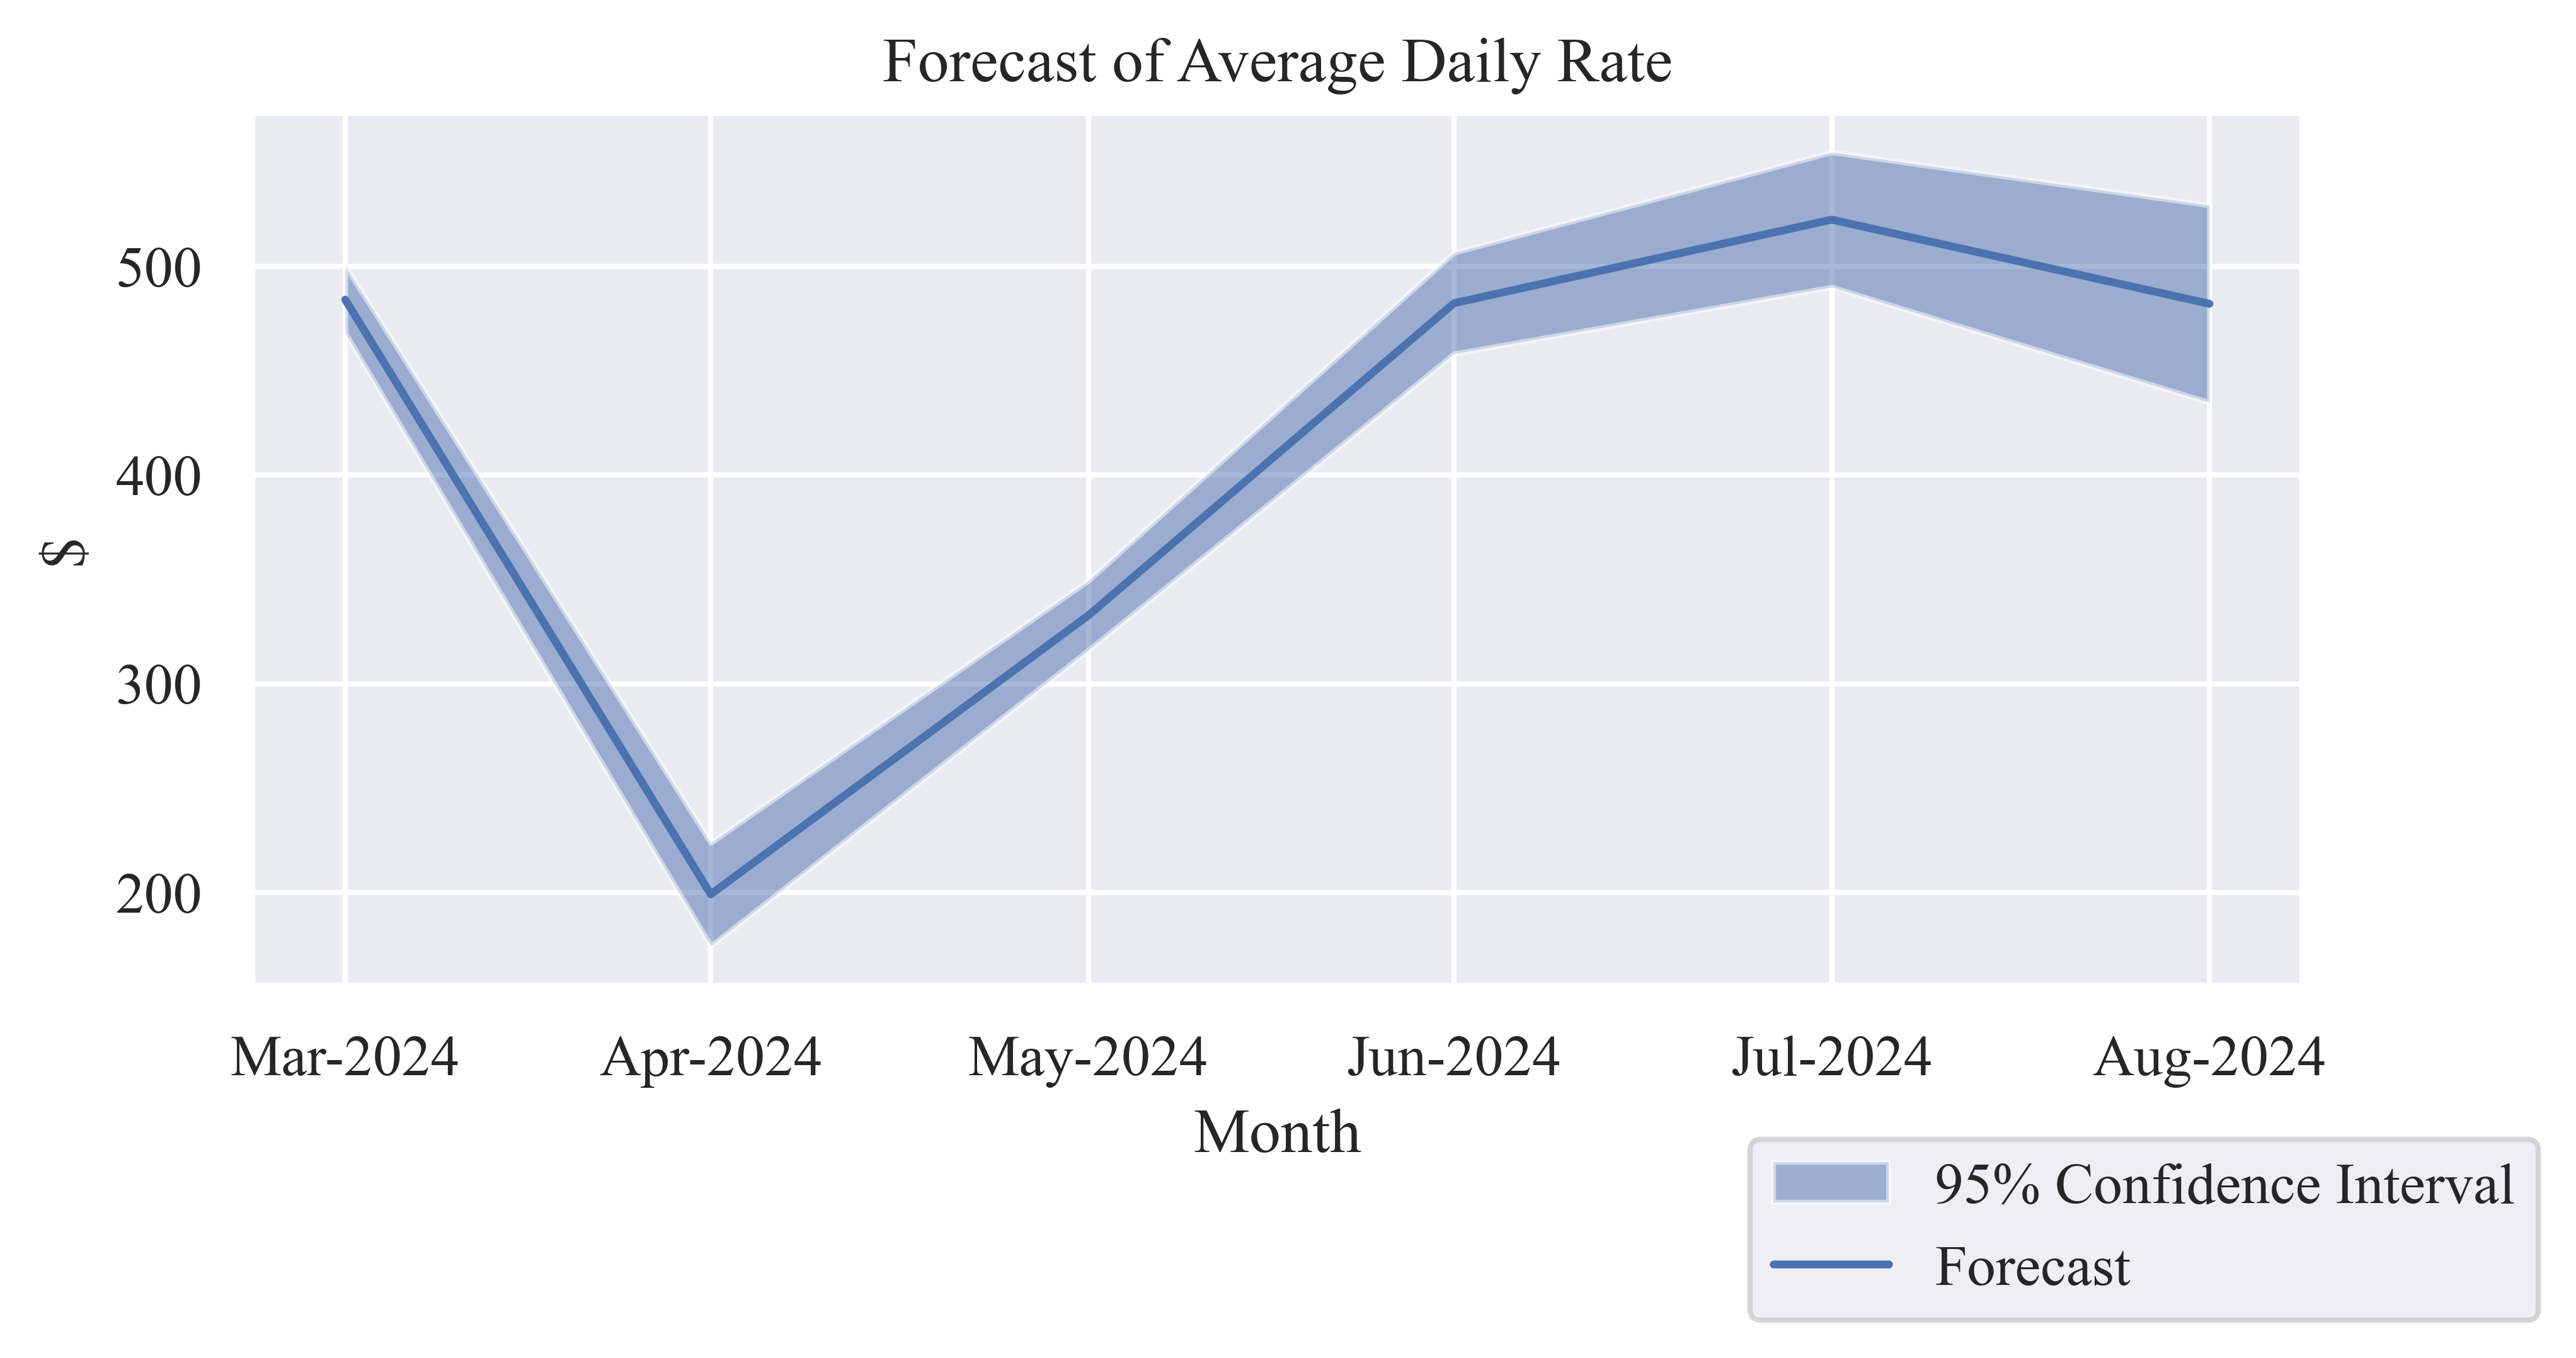
Average Daily Rate (ADR)
Table 2: Forecast of Monthly Average Daily Rate
| Mar-2024 |
$484.03 |
$468.00 |
$500.06 |
| Apr-2024 |
$199.15 |
$174.46 |
$223.85 |
| May-2024 |
$332.82 |
$316.18 |
$349.47 |
| Jun-2024 |
$482.33 |
$458.13 |
$506.54 |
| Jul-2024 |
$522.35 |
$490.05 |
$554.65 |
| Aug-2024 |
$482.04 |
$434.80 |
$529.28 |
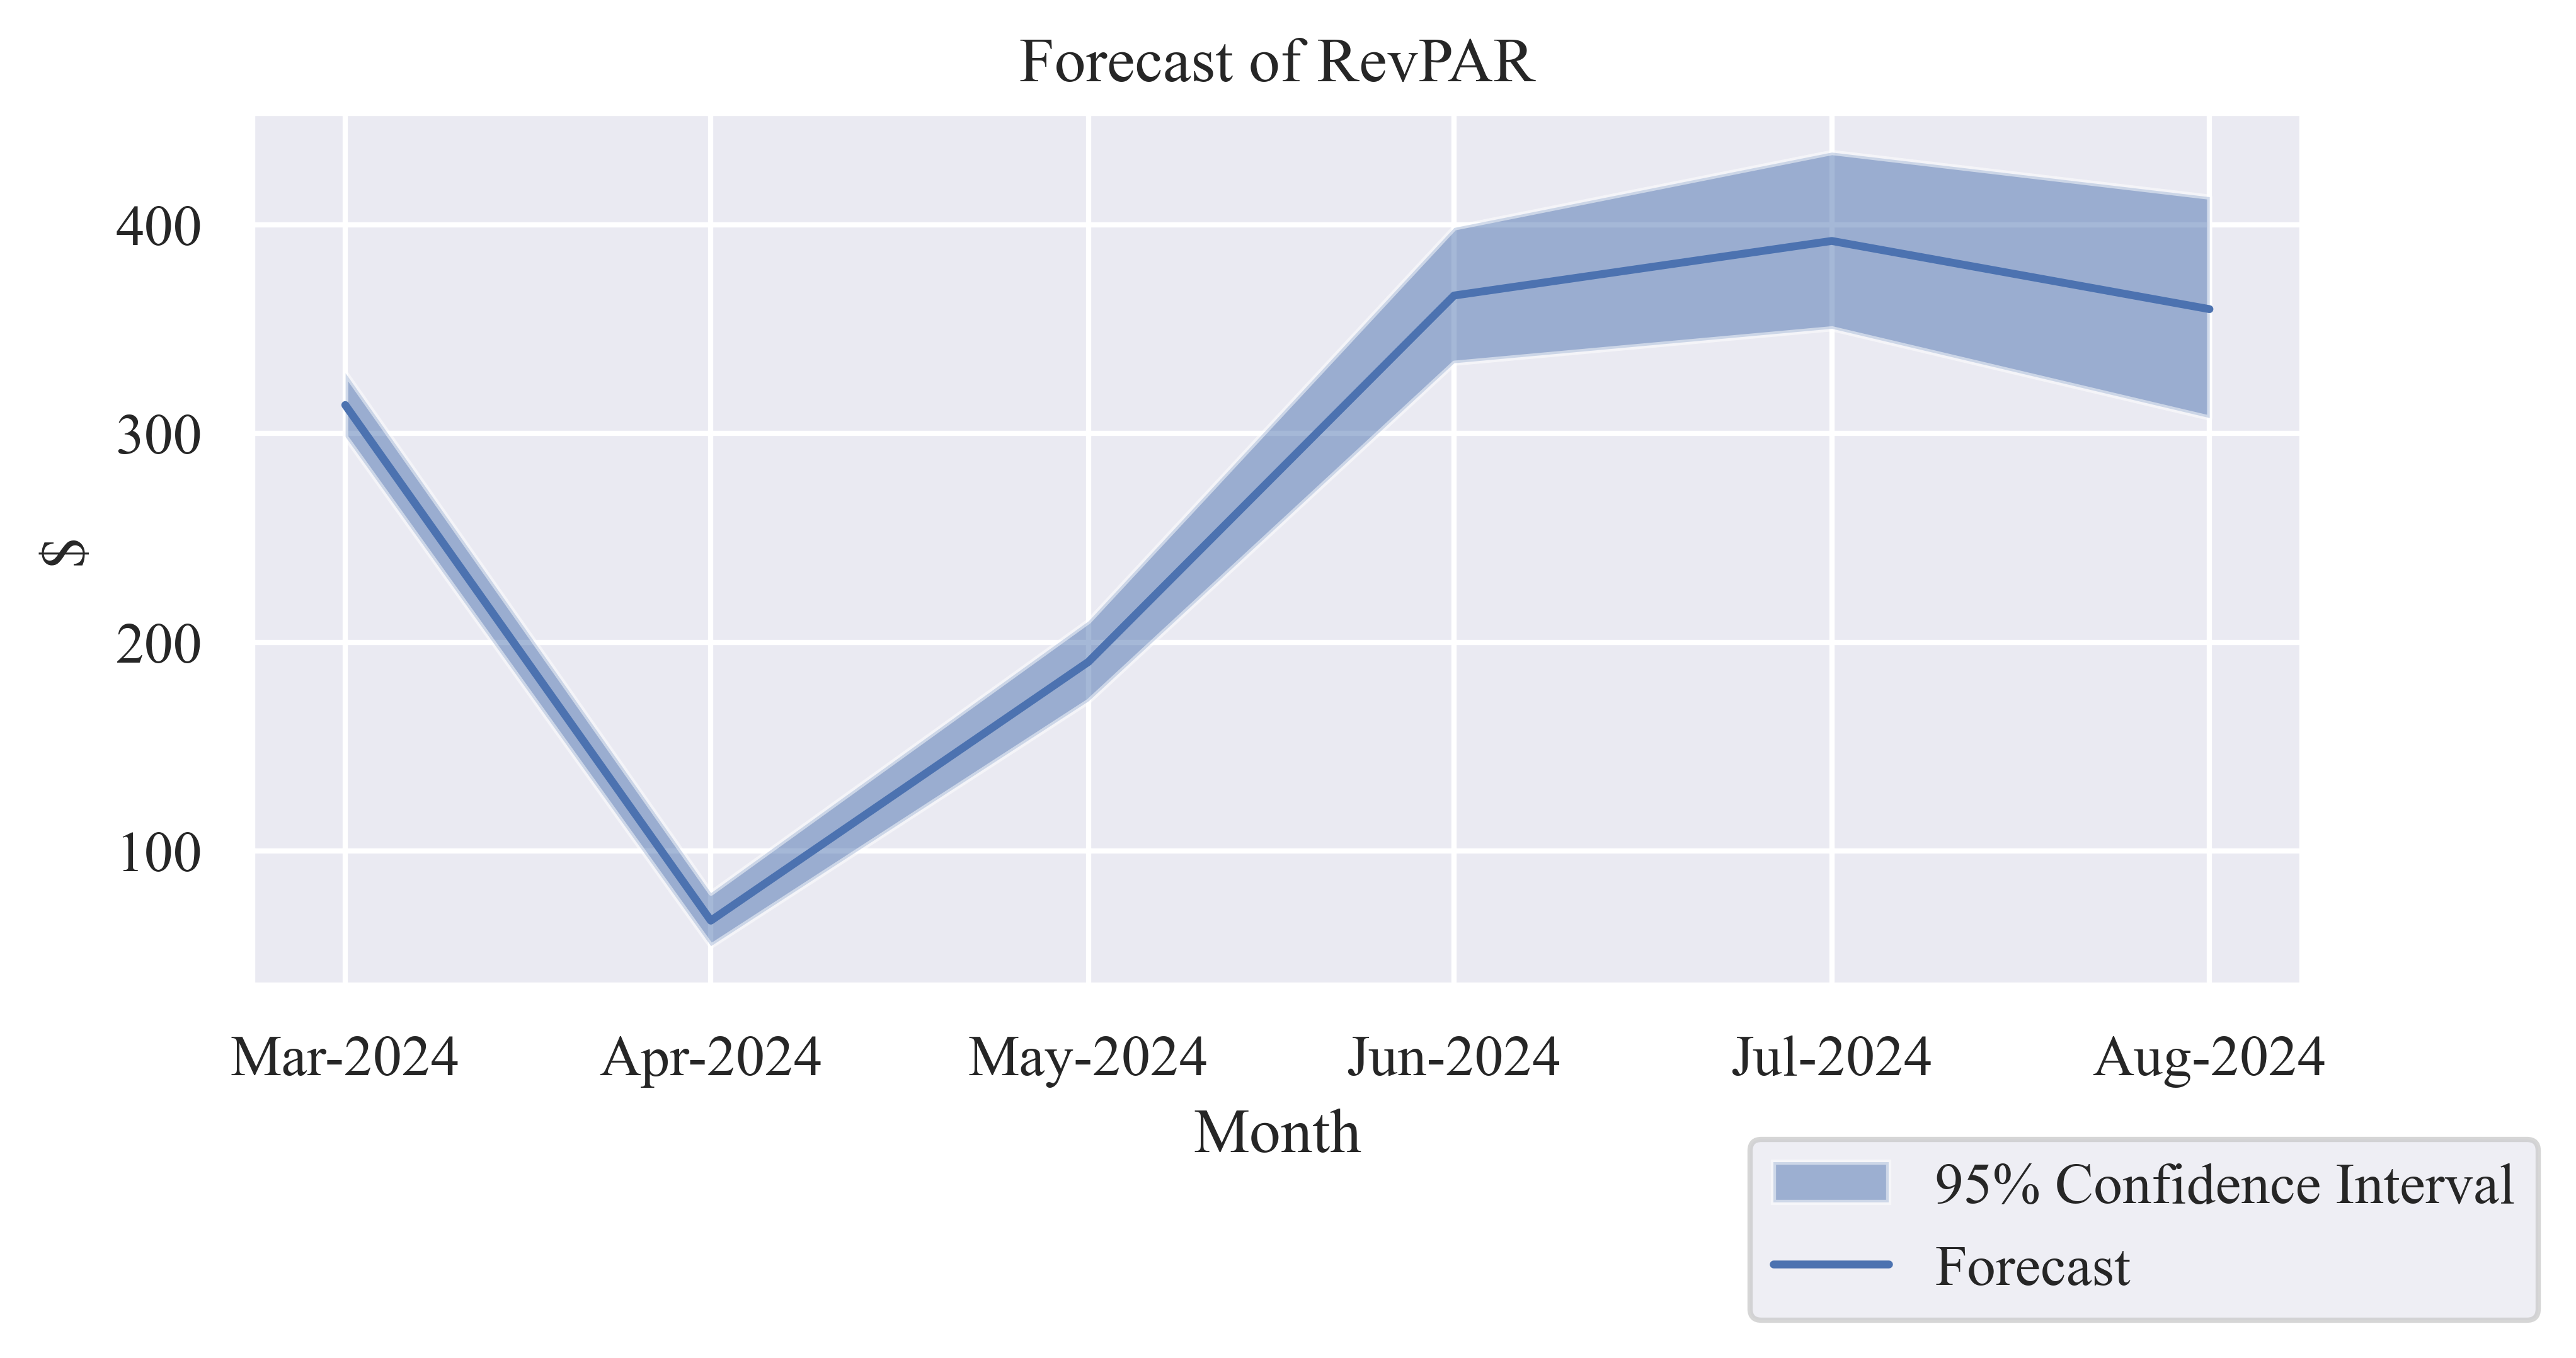
Revenue per Available Room (RevPAR)
Table 3: Forecast of Monthly RevPAR
| Mar-2024 |
$313.72 |
$298.58 |
$329.12 |
| Apr-2024 |
$66.71 |
$54.63 |
$80.04 |
| May-2024 |
$190.72 |
$171.95 |
$210.29 |
| Jun-2024 |
$366.17 |
$333.88 |
$398.71 |
| Jul-2024 |
$392.32 |
$350.38 |
$434.82 |
| Aug-2024 |
$359.65 |
$307.62 |
$413.47 |
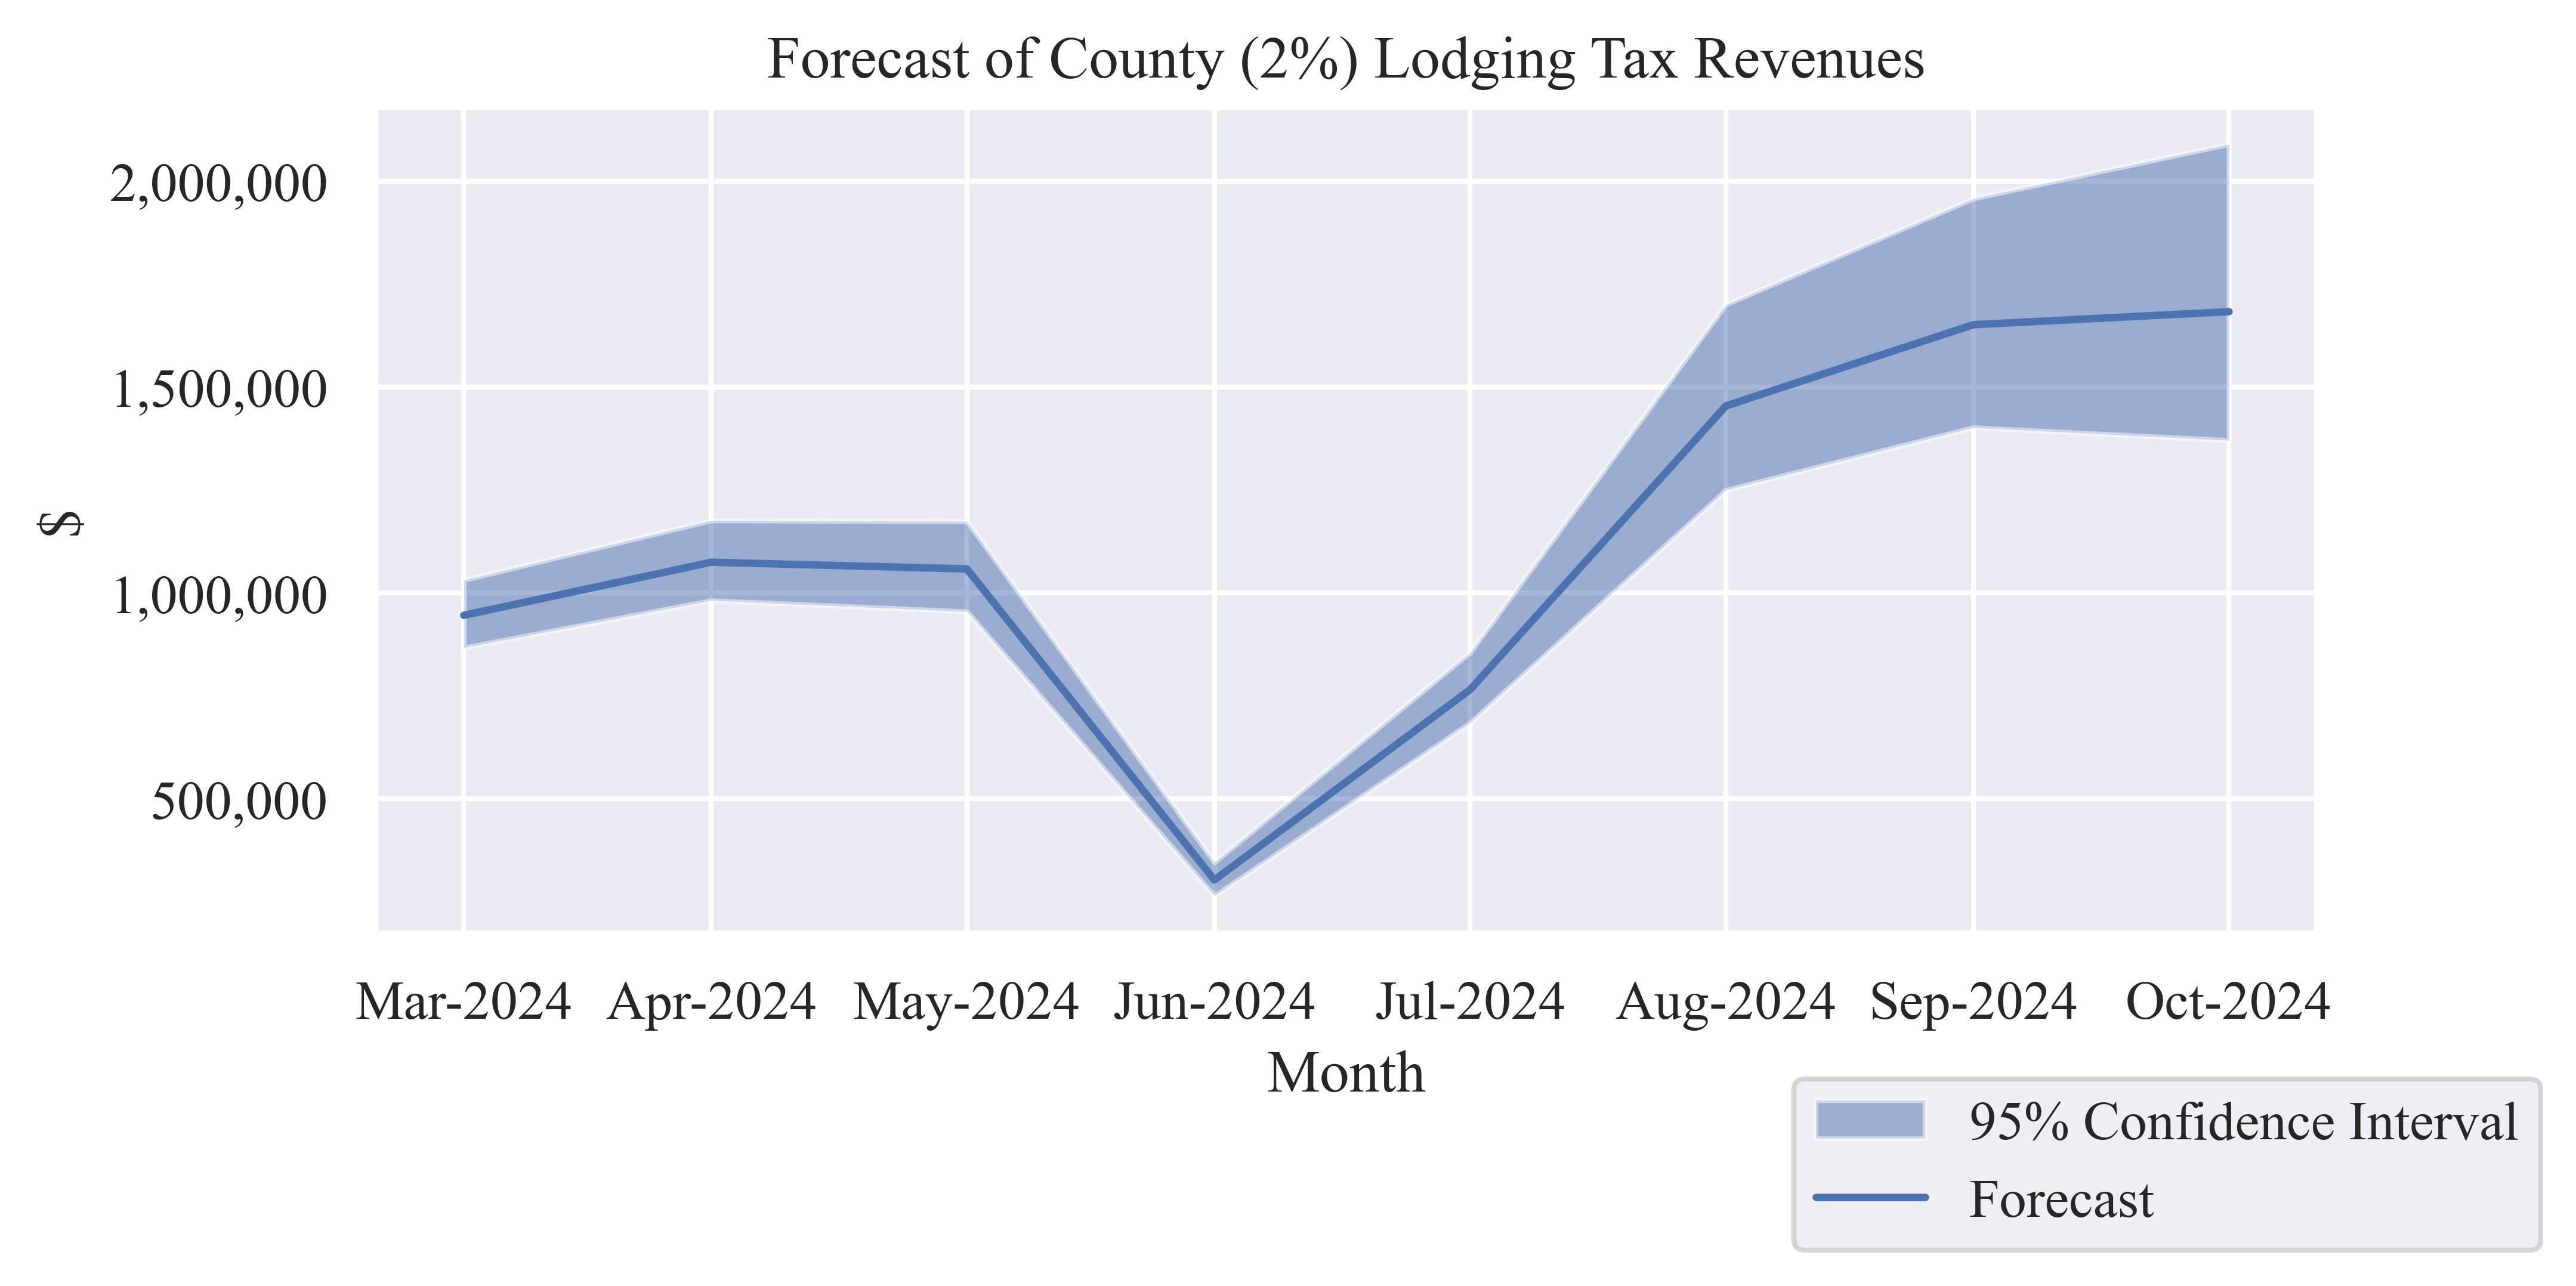
Tax Revenues
Table 4: Forecast County (2%) Lodging Tax Revenue
| Mar-2024 |
$946,096 |
$867,560 |
$1,031,742 |
| Apr-2024 |
$1,075,058 |
$982,275 |
$1,176,604 |
| May-2024 |
$1,058,839 |
$955,422 |
$1,174,449 |
| Jun-2024 |
$303,212 |
$265,032 |
$346,023 |
| Jul-2024 |
$765,592 |
$685,030 |
$855,902 |
| Aug-2024 |
$1,454,732 |
$1,250,363 |
$1,701,166 |
| Sep-2024 |
$1,652,051 |
$1,402,399 |
$1,958,552 |
| Oct-2024 |
$1,683,696 |
$1,371,263 |
$2,090,651 |
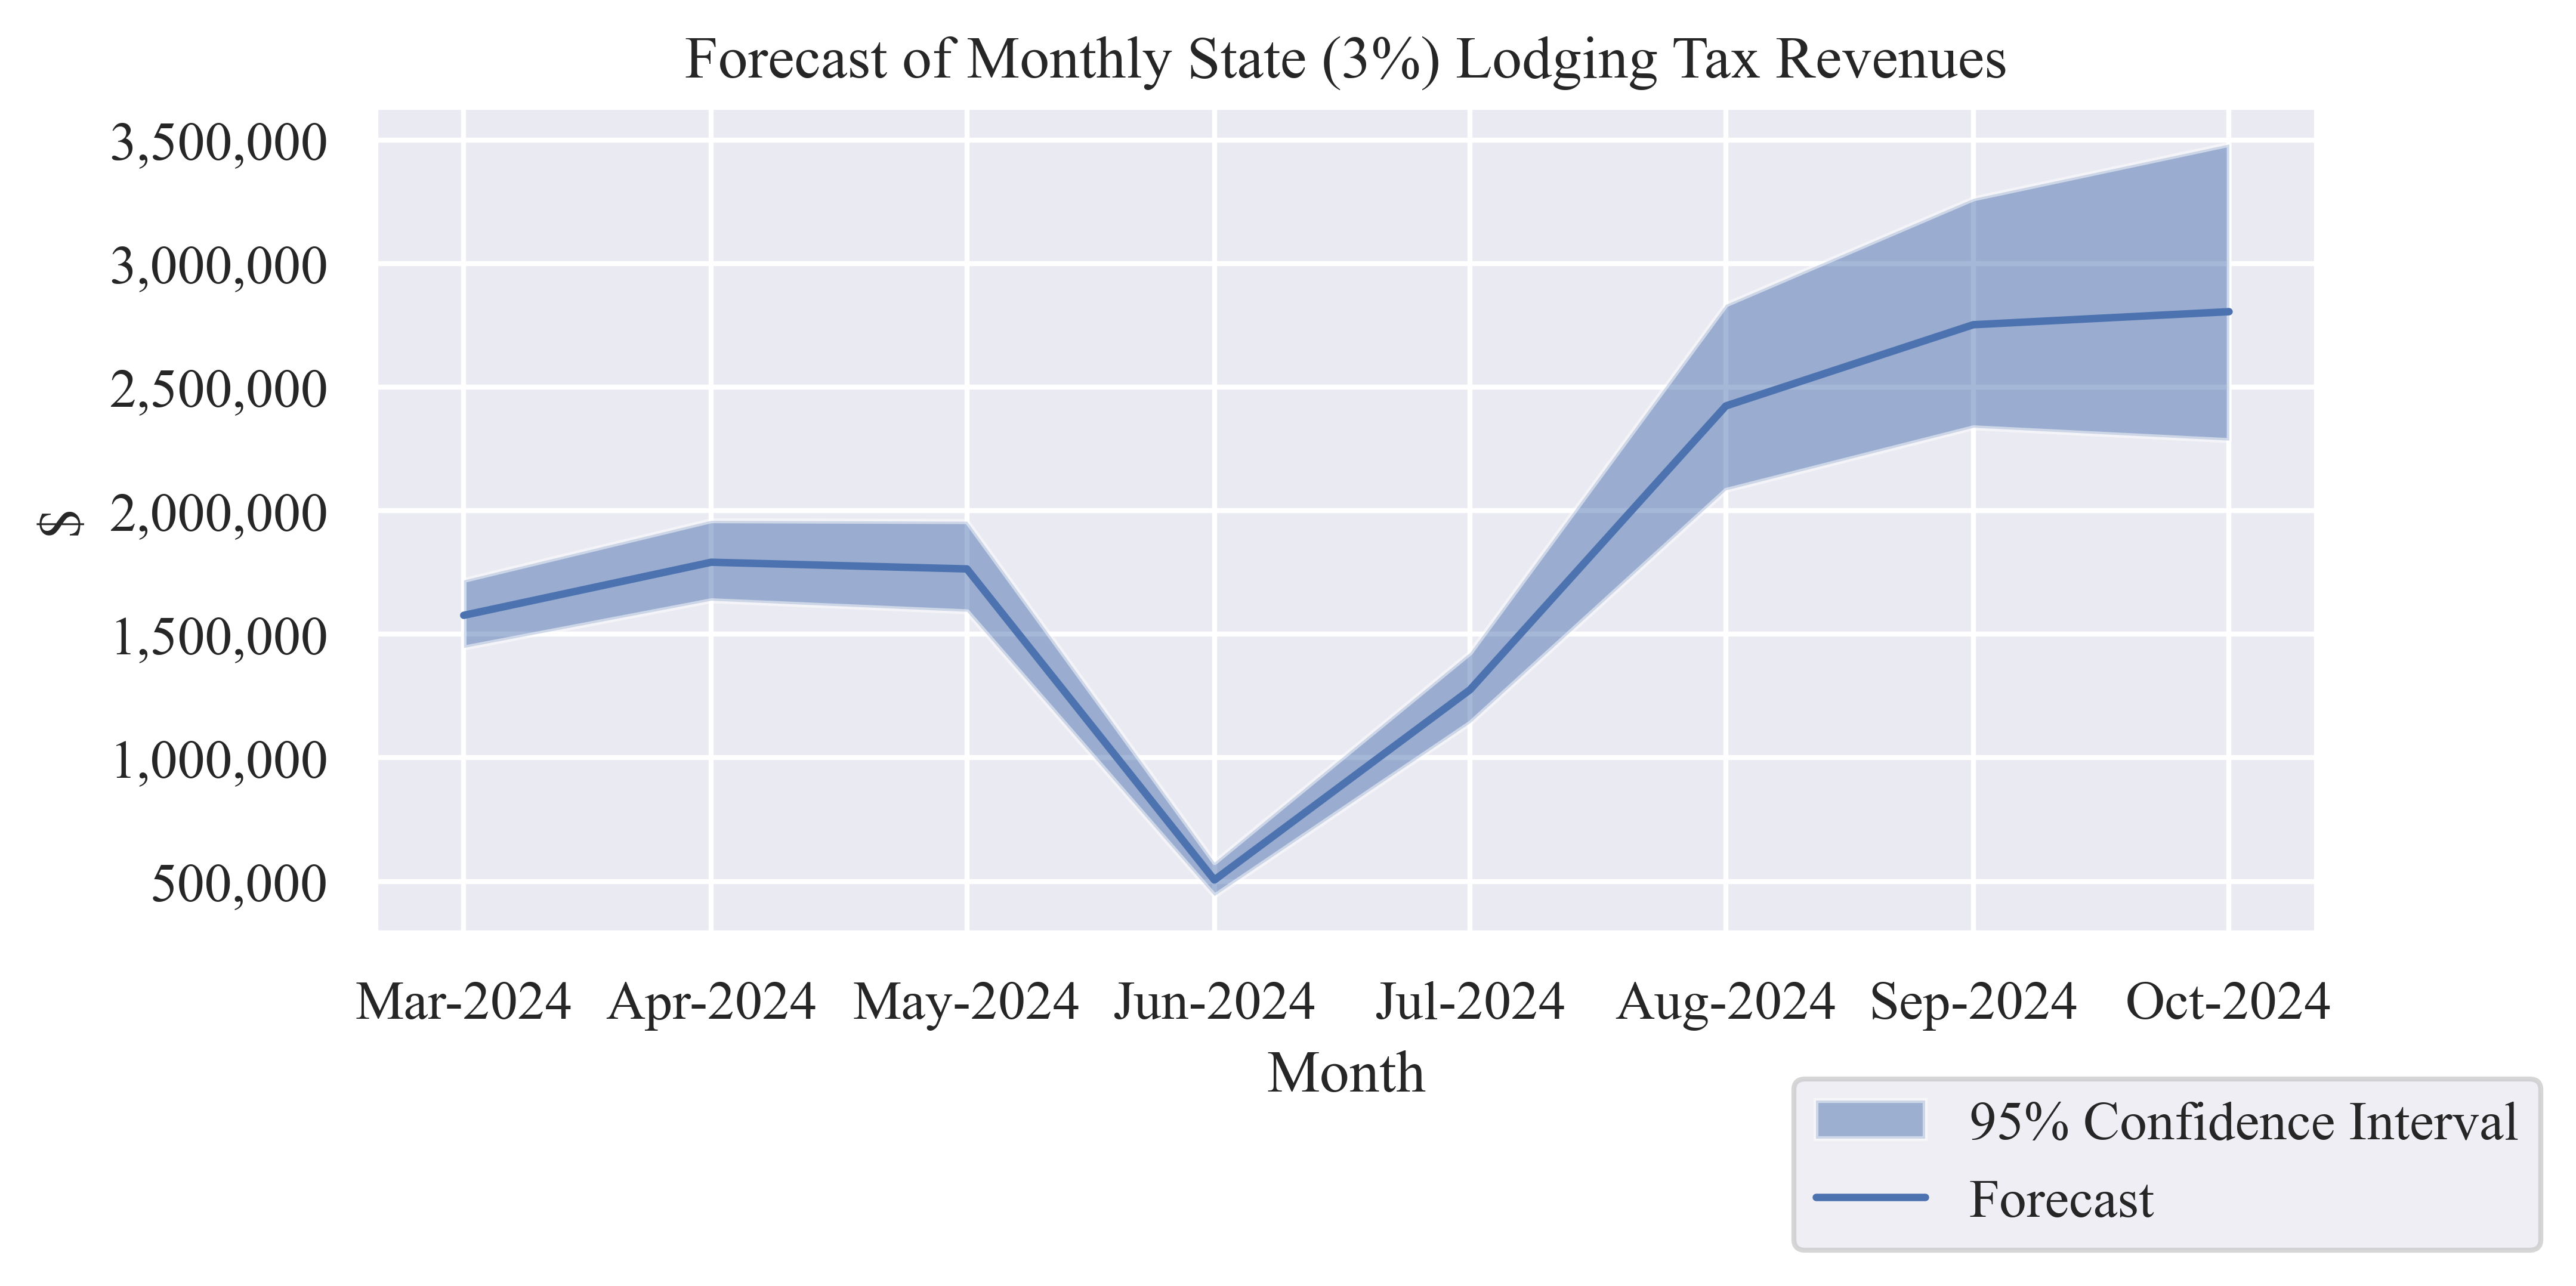
Table 5: Forecast State (3%) Lodging Tax Revenue
| Mar-2024 |
$1,576,827 |
$1,445,933 |
$1,719,571 |
| Apr-2024 |
$1,791,763 |
$1,637,125 |
$1,961,007 |
| May-2024 |
$1,764,731 |
$1,592,370 |
$1,957,415 |
| Jun-2024 |
$505,353 |
$441,720 |
$576,705 |
| Jul-2024 |
$1,275,987 |
$1,141,717 |
$1,426,503 |
| Aug-2024 |
$2,424,553 |
$2,083,938 |
$2,835,276 |
| Sep-2024 |
$2,753,418 |
$2,337,332 |
$3,264,254 |
| Oct-2024 |
$2,806,160 |
$2,285,438 |
$3,484,418 |
Table 6: Forecast of Monthly Total (5%) Lodging Tax Revenue
| Mar-2024 |
$2,522,923 |
$2,313,493 |
$2,751,313 |
| Apr-2024 |
$2,866,820 |
$2,619,400 |
$3,137,611 |
| May-2024 |
$2,823,570 |
$2,547,792 |
$3,131,864 |
| Jun-2024 |
$808,564 |
$706,753 |
$922,728 |
| Jul-2024 |
$2,041,580 |
$1,826,747 |
$2,282,404 |
| Aug-2024 |
$3,879,285 |
$3,334,301 |
$4,536,442 |
| Sep-2024 |
$4,405,468 |
$3,739,732 |
$5,222,806 |
| Oct-2024 |
$4,489,856 |
$3,656,701 |
$5,575,069 |
Lodging Sector Sales
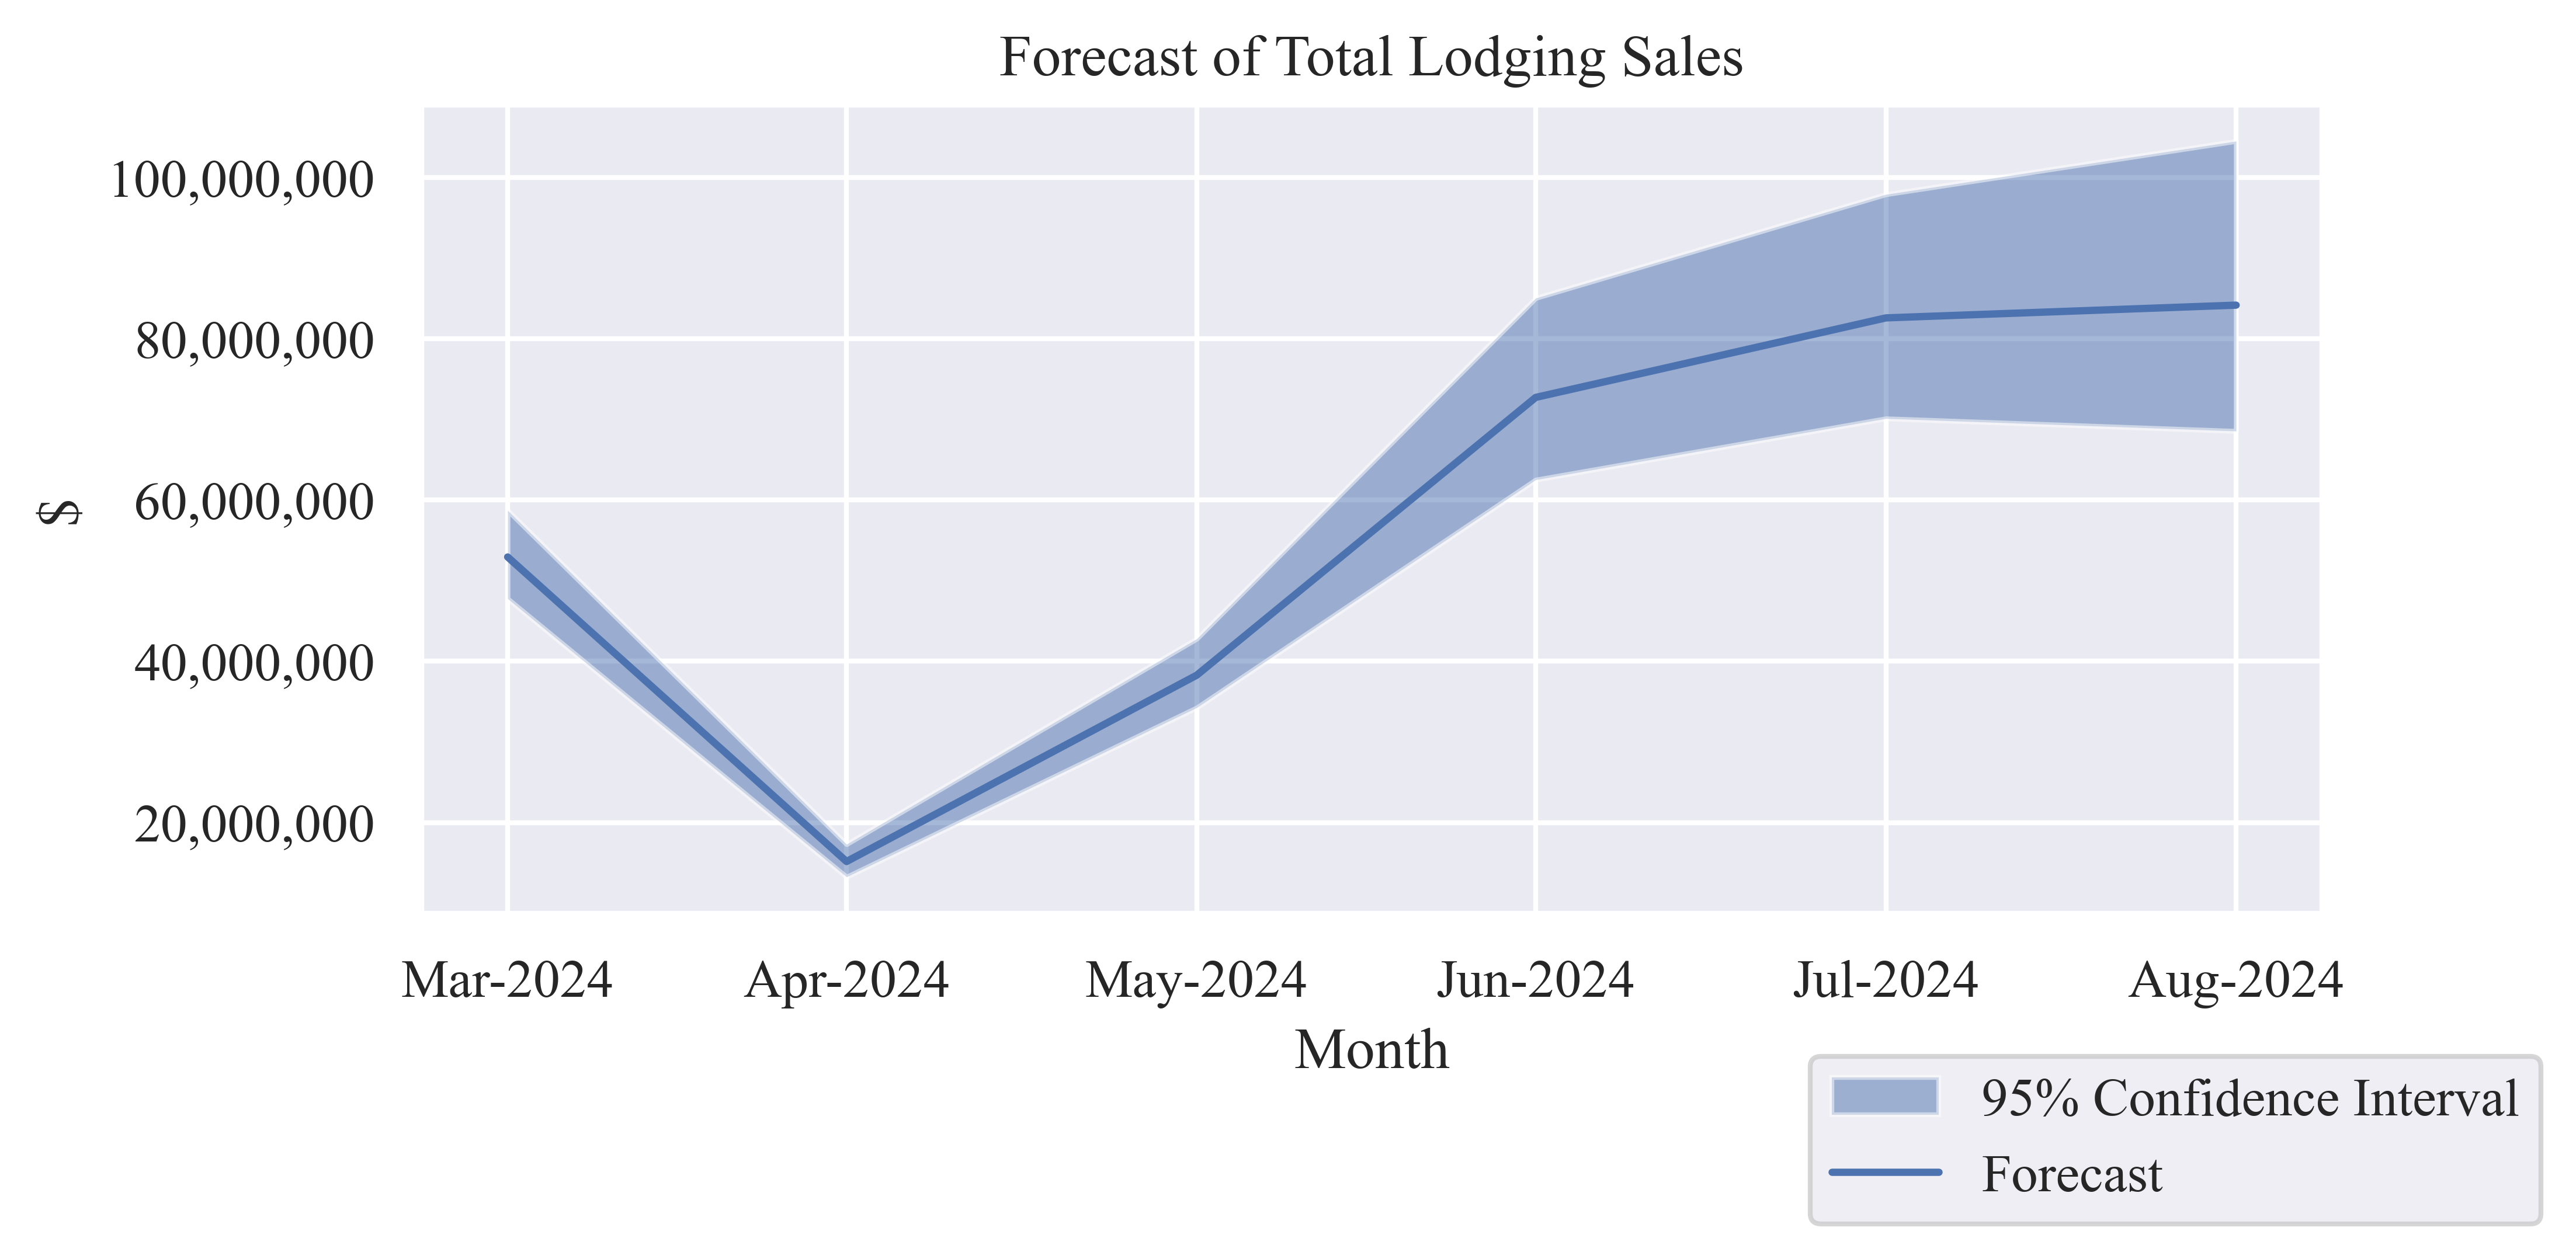
Table 7: Forecast of Monthly Lodging Sales
| Mar-2024 |
$52,941,943 |
$47,771,107 |
$58,722,452 |
| Apr-2024 |
$15,160,583 |
$13,251,613 |
$17,301,153 |
| May-2024 |
$38,279,619 |
$34,251,501 |
$42,795,080 |
| Jun-2024 |
$72,736,593 |
$62,518,140 |
$85,058,279 |
| Jul-2024 |
$82,602,528 |
$70,119,966 |
$97,927,607 |
| Aug-2024 |
$84,184,798 |
$68,563,147 |
$104,532,540 |
Economic Indicators
Table 8: Six-Month Forecast of Economic Output from Lodging Sales
| Low Estimate |
$296,475,474 |
$63,600,631 |
$15,941,271 |
$376,017,376 |
| Median Estimate |
$345,906,064 |
$74,204,600 |
$18,599,118 |
$438,709,783 |
| High Estimate |
$406,337,112 |
$87,168,429 |
$21,848,473 |
$515,354,014 |
Table 9: Six-Month Forecast of Employee Compensation from Lodging Sales
| Low Estimate |
$95,890,621 |
$21,458,522 |
$4,364,672 |
$121,713,814 |
| Median Estimate |
$111,878,216 |
$25,036,246 |
$5,092,382 |
$142,006,844 |
| High Estimate |
$131,423,748 |
$29,410,174 |
$5,982,046 |
$166,815,967 |
Table 10: Six-Month Forecast of Contribution to Gross County Product from Lodging
Sales
| Low Estimate |
$214,483,818 |
$37,417,559 |
$9,610,455 |
$261,511,832 |
| Median Estimate |
$250,244,151 |
$43,656,092 |
$11,212,782 |
$305,113,025 |
| High Estimate |
$293,962,715 |
$51,282,979 |
$13,171,708 |
$358,417,402 |
Table 11: Six-Month Forecast of Employment from Lodging Sales
| Low Estimate |
3,767 |
602 |
165 |
4,534 |
| Median Estimate |
4,395 |
702 |
193 |
5,290 |
| High Estimate |
5,163 |
825 |
226 |
6,214 |