Institutional Marketing, Web Team
Dept. 3226, 1000 E. University Avenue
Laramie, WY 82071-2000
Email: webhelp@uwyo.edu
-----------------------------------
Web Strategist, Shelbey Gunter
Email: sprusia@uwyo.edu
At Institutional Marketing, the main software we use to track website analytics is Google Analytics - which is free and easy to use! Tracking website and page statistics is essential for making informed decisions on your website, improving user experience and achieving your online objectives and goals.
During the summer of 2023, Google moved away for Universal Analytics to Google Analytics 4 (GA4). Due to GA4's changes, we were able to add a tracking Google Analytics code on our header and footer, so you never have to worry about if your page is being tracked or not!
Yes, I want access to GA4.
Resources:
To request access to GA4, please email Shelbey Gunter at sprusia@uwyo.edu with the Gmail account you intend to use.
If you are the person in charge of pulling data and reports from GA4, here are the main reports we pull at Institutional Marketing for not only internal use, but when sending reports to departments across campus. Sometimes reading these reports can be tricky, so be sure to look at our handy tips for reading these GA4 reports! Some of the most common reports are:
Pages & Screens Report: shows you standard performance metrics such as users & sessions along with performance of your pages over time. Allows you to filter results based on what web directory you manage.
Traffic Acquisition: Show you how site visitors got to your page (Google, direct link, etc.)
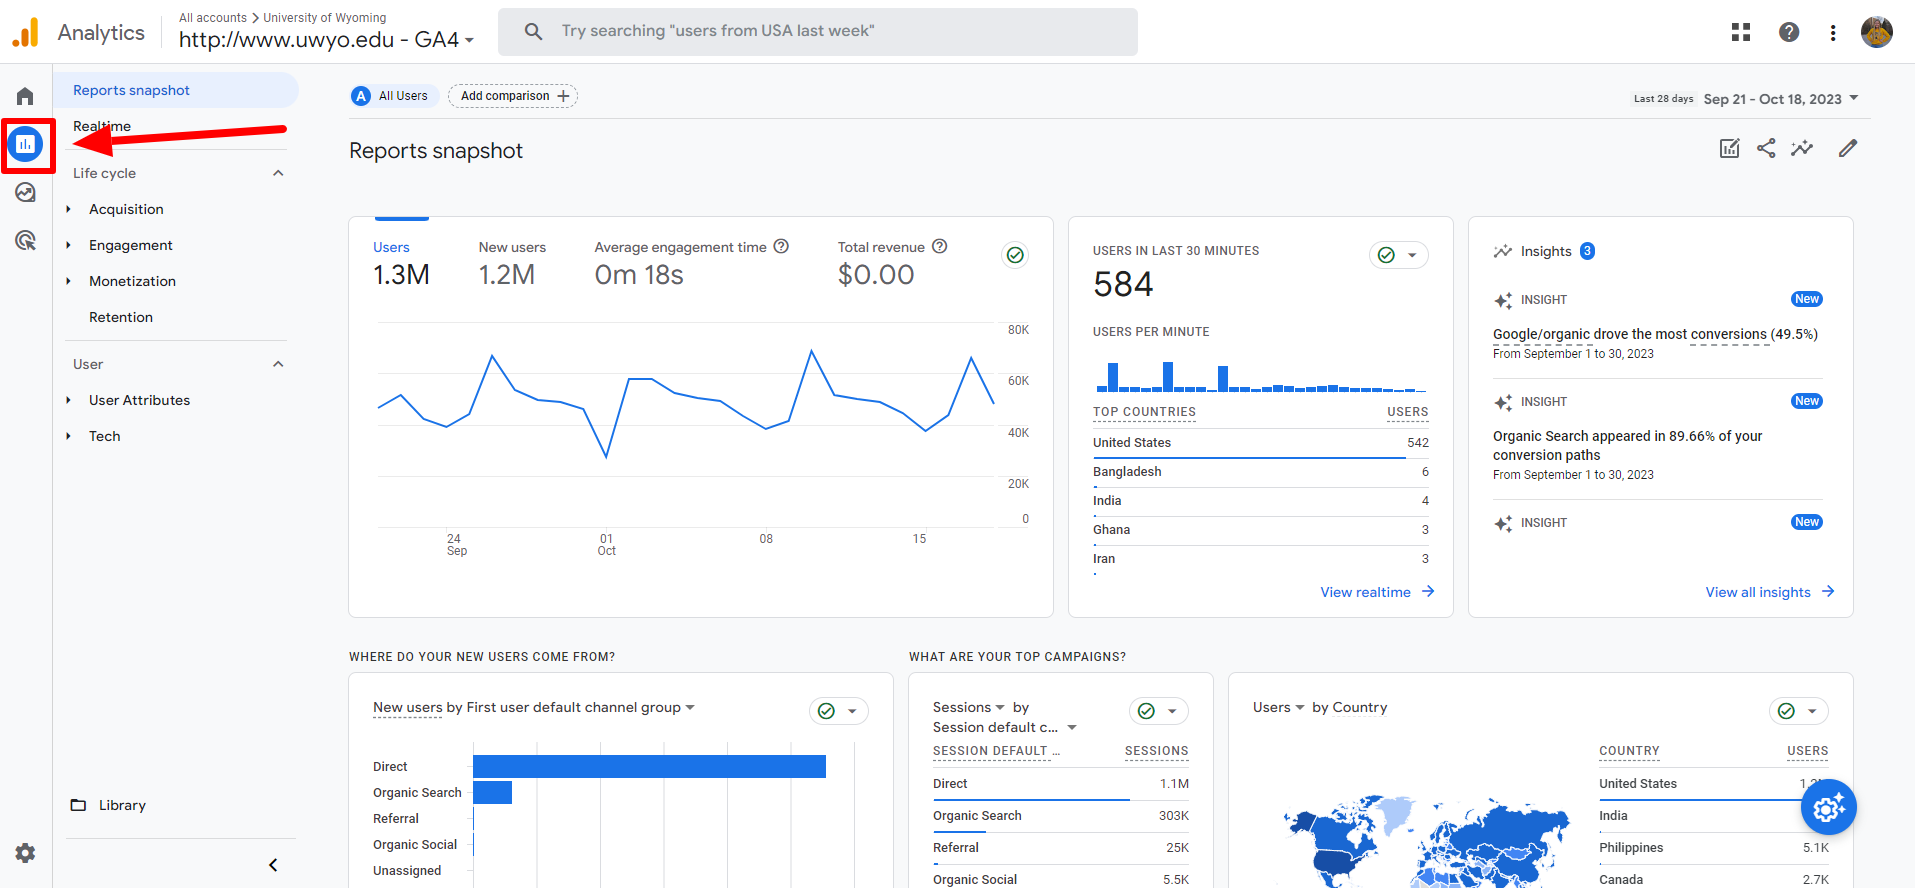
IMPORTANT: Before getting started, make sure your Google Analytics Property is set to http://www.uwyo.edu - GA4.

First, you'll click on the "Reports" section on the left-hand side of your GA4.
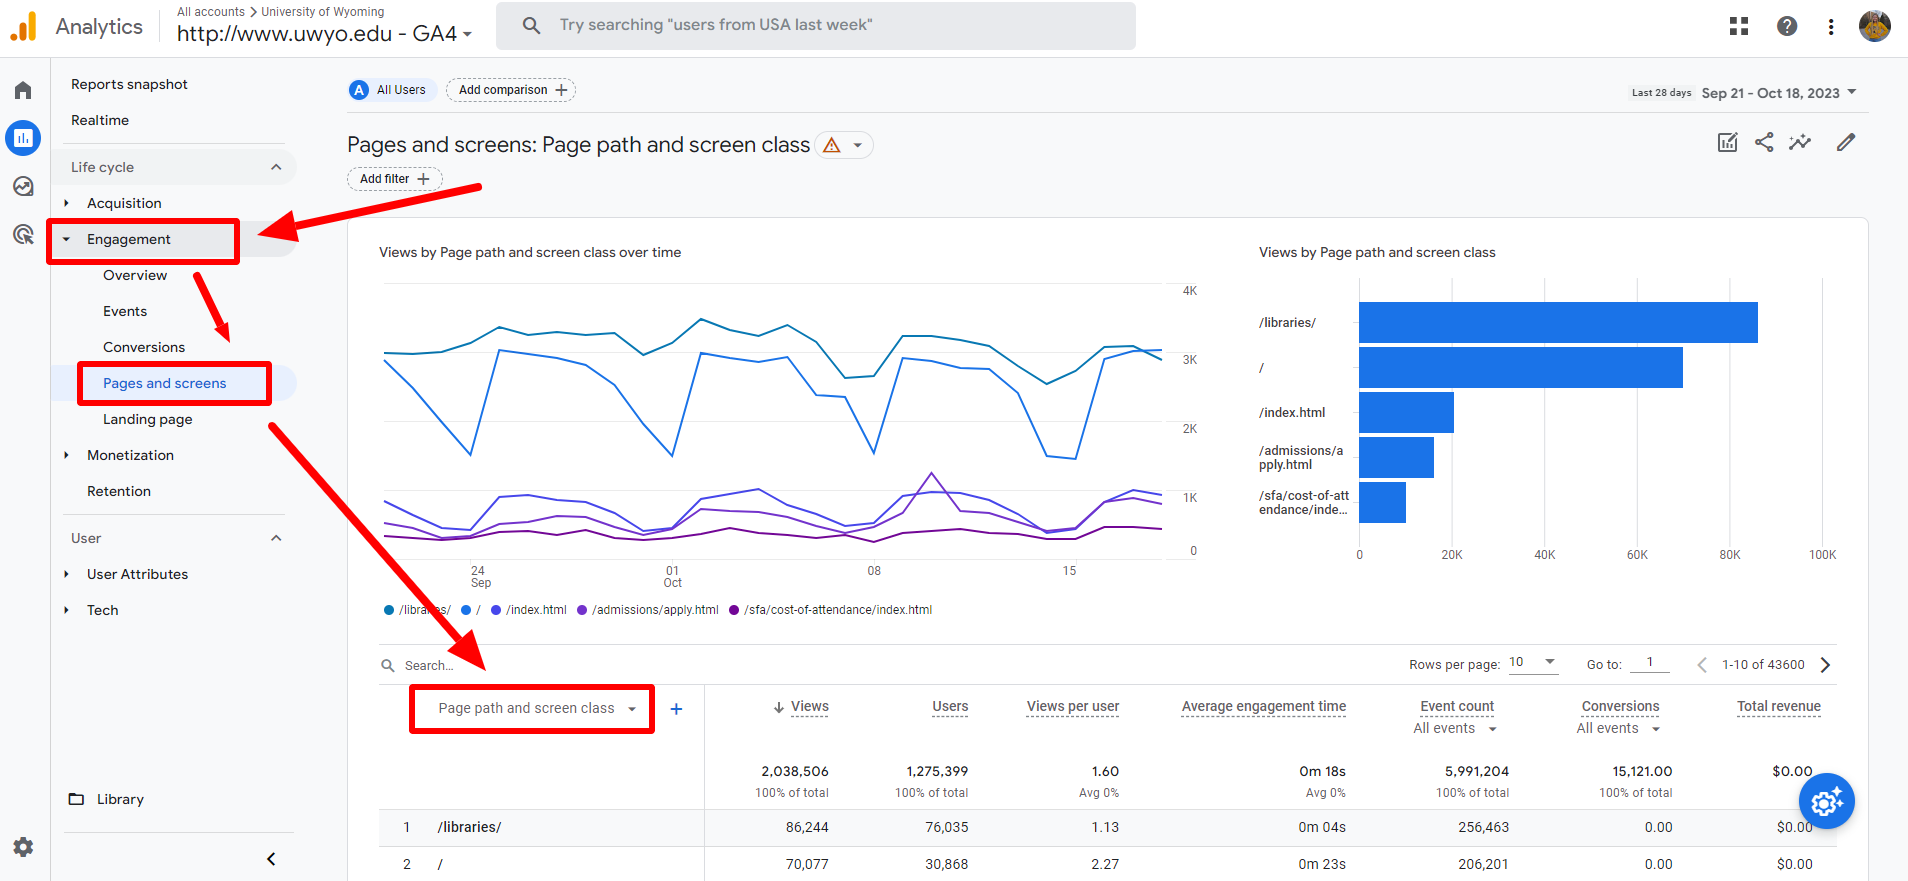
Select "Engagement" > "Pages and screens". To make it easier to read the report and make filters work, click on the "Page title and screen class" dropdown after the bar graph and select "Page path and screen class".
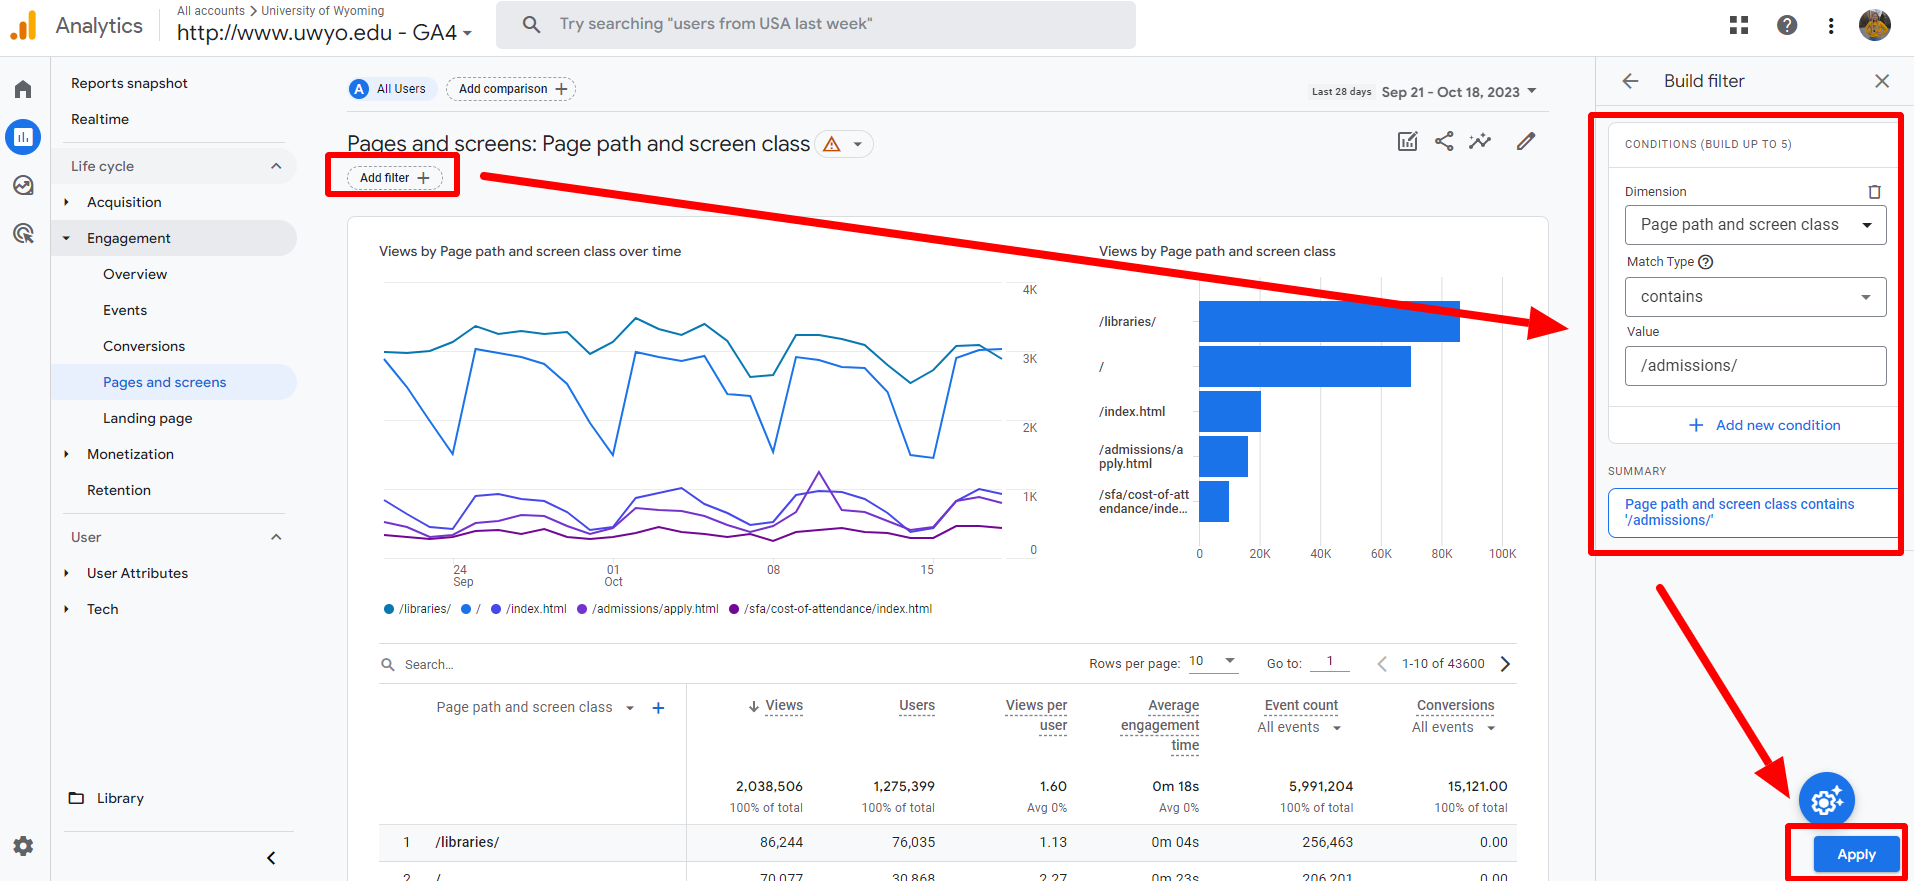
From here, you'll want to add a filter so you are only viewing your site's data. To do this, click on "Add filter +" under the "Pages and screens: Page path and screen class" heading. In the "Build filter" on the right side of your screen, fill out the following information:
Dimension: Page path and screen class
Match Type: contains
Value: /[your site name]/
And select the "Apply" button when complete.
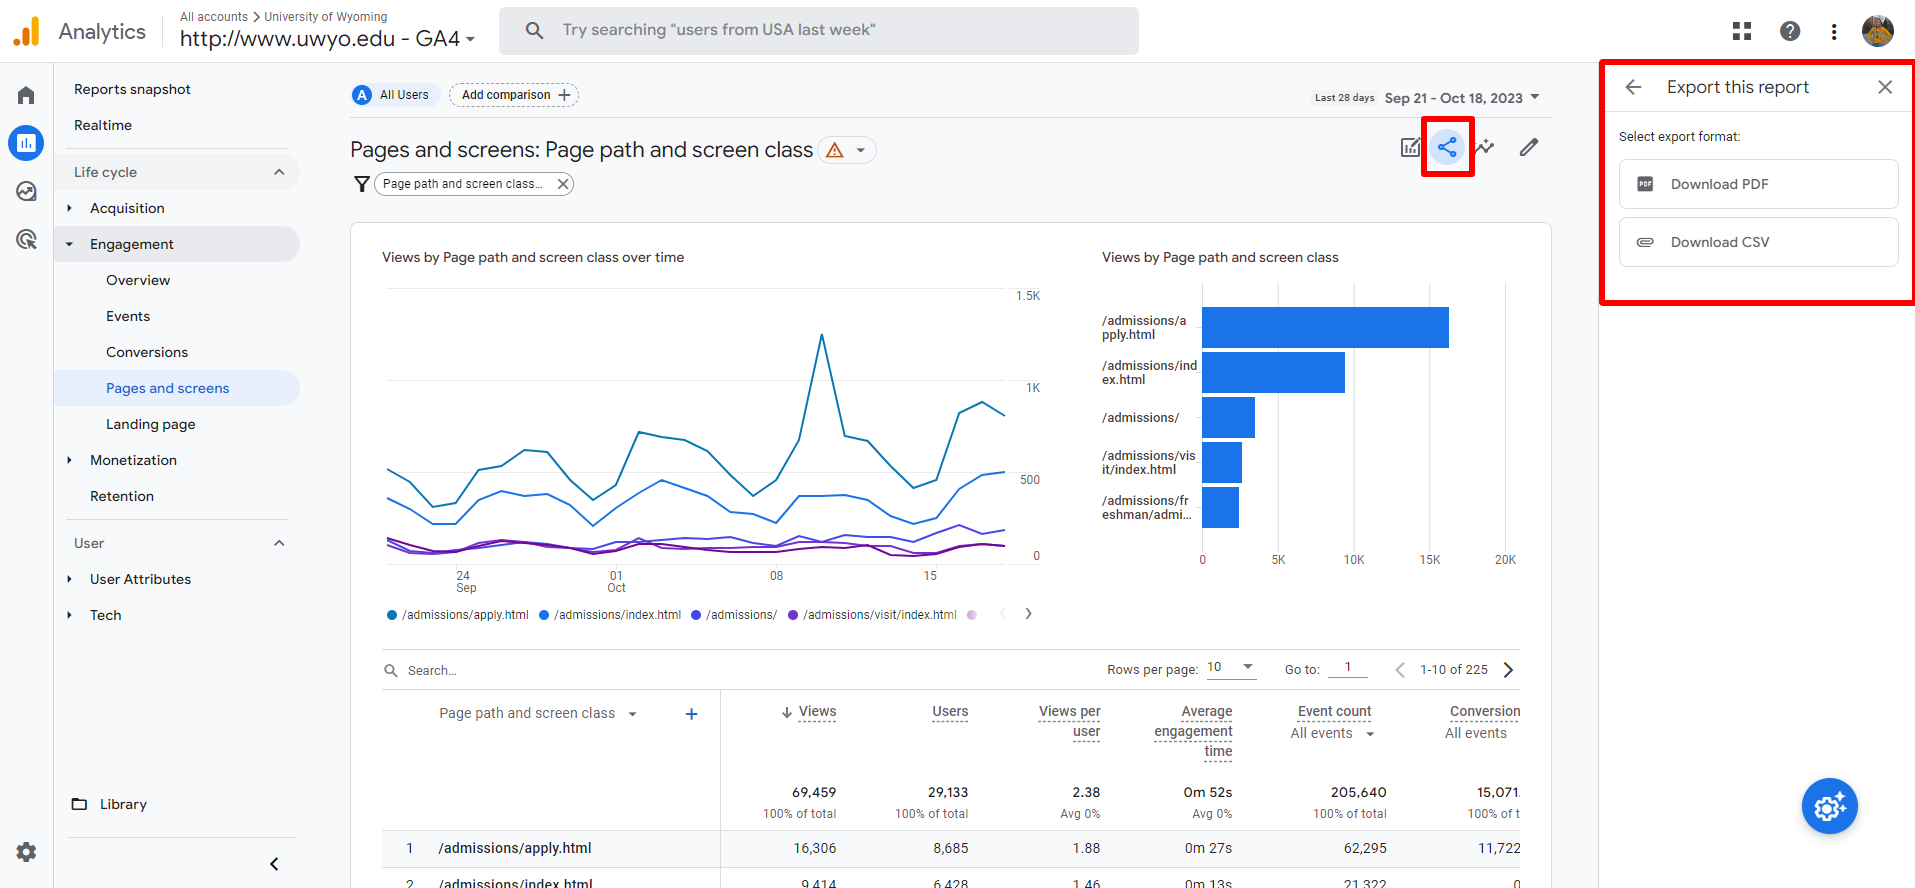
From there, you'll should only see pages and screens data for your site. Feel free to play around with date ranges, Rows per page and other customizable data. To export your data, click the "Share this report" icon under the date range and export as a PDF or CSV.
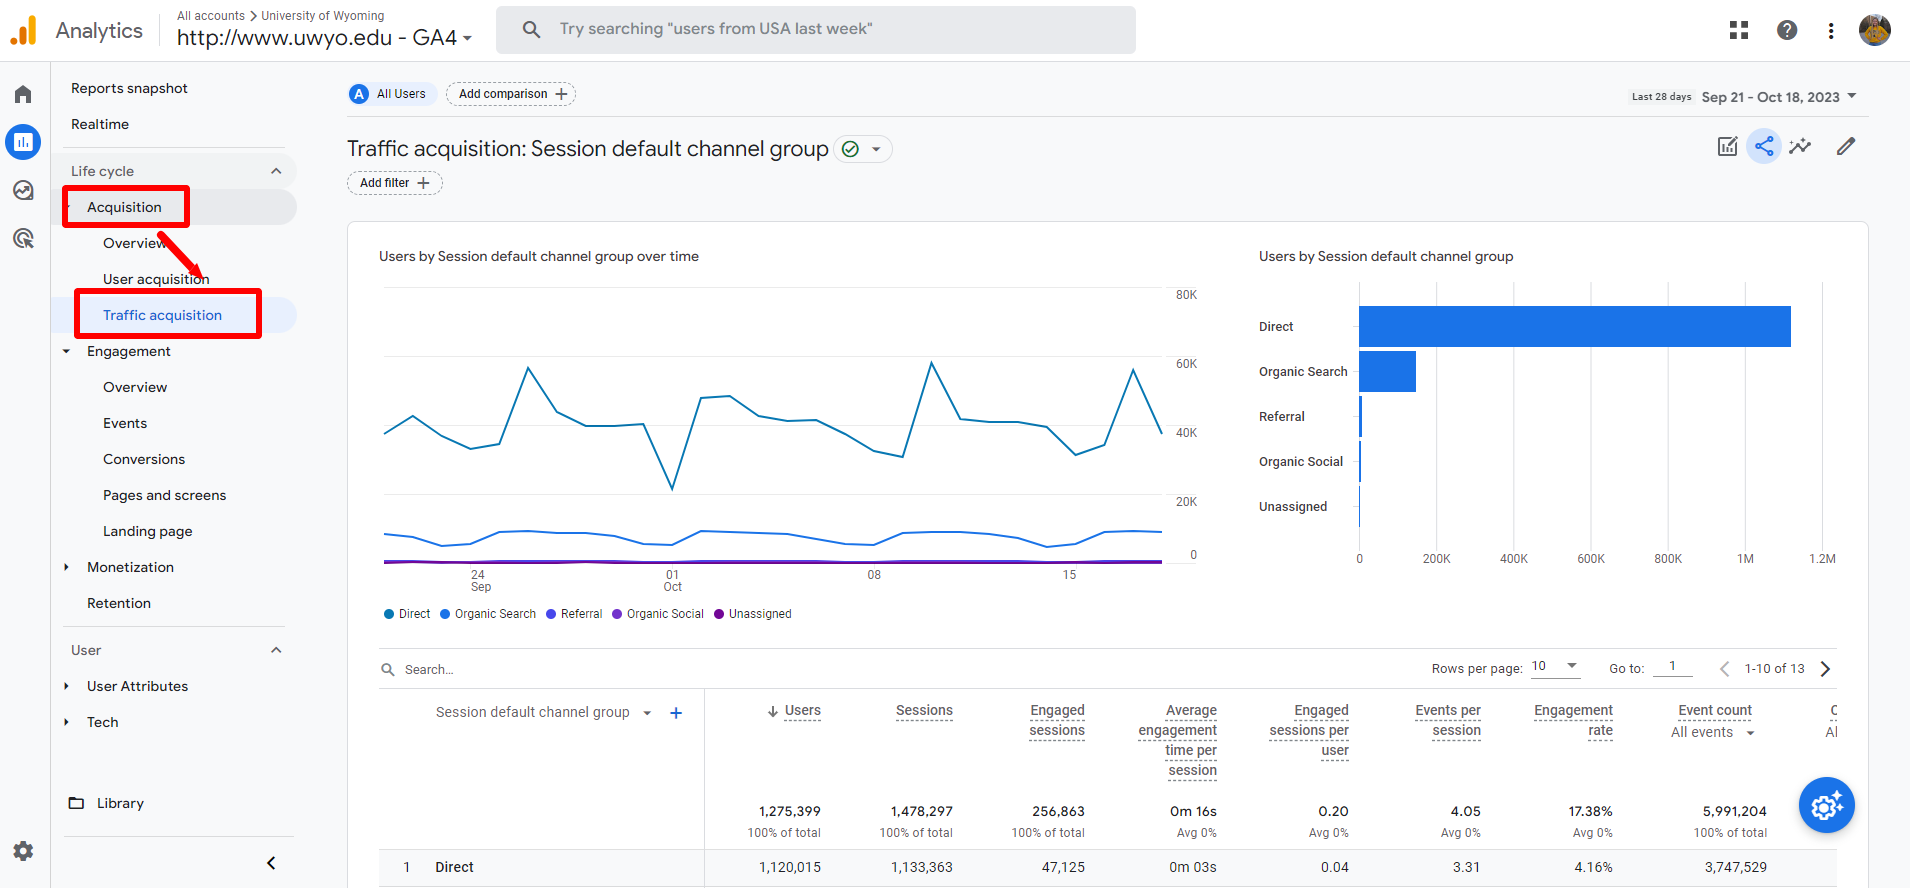
First, you'll click on the "Reports" section on the left-hand side of your GA4.
Select "Acquisition" > "Traffic acquisition".
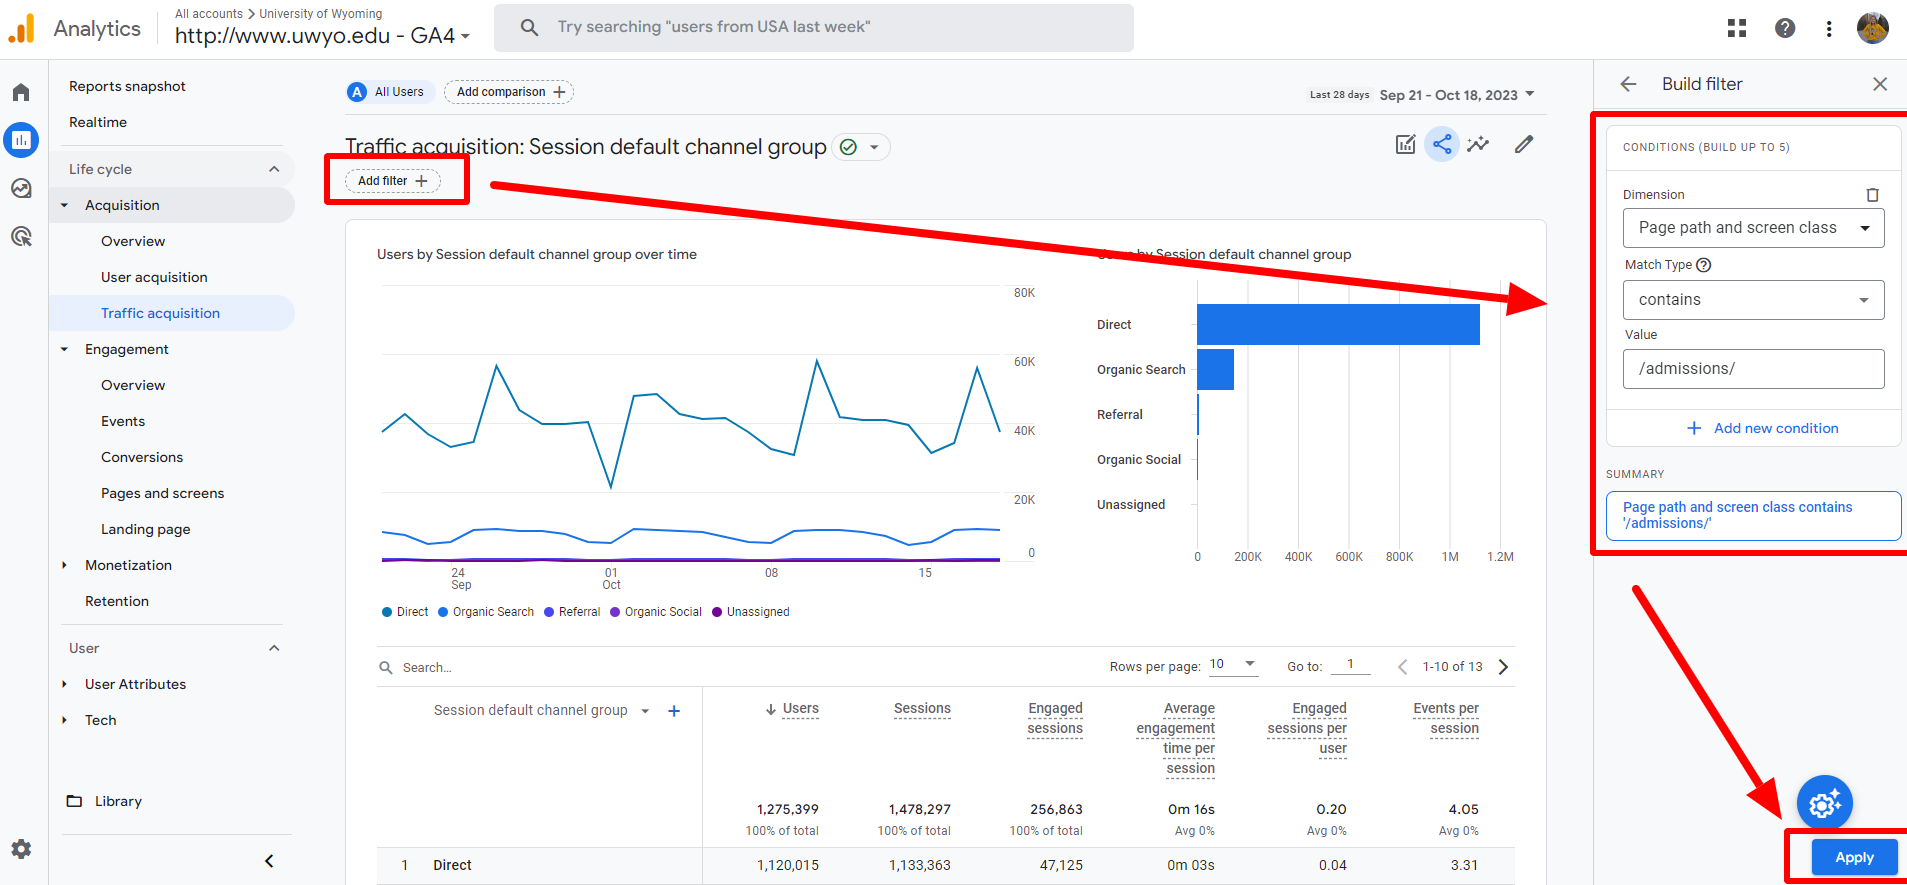
From here, you'll want to add a filter so you are only viewing your site's data. To do this, click on "Add filter +" under the "Traffic acquisition: Session default channel group" heading. In the "Build filter" on the right side of your screen, fill out the following information:
Dimension: Page path and screen class
Match Type: contains
Value: /[your site name]/
And select the "Apply" button when complete.
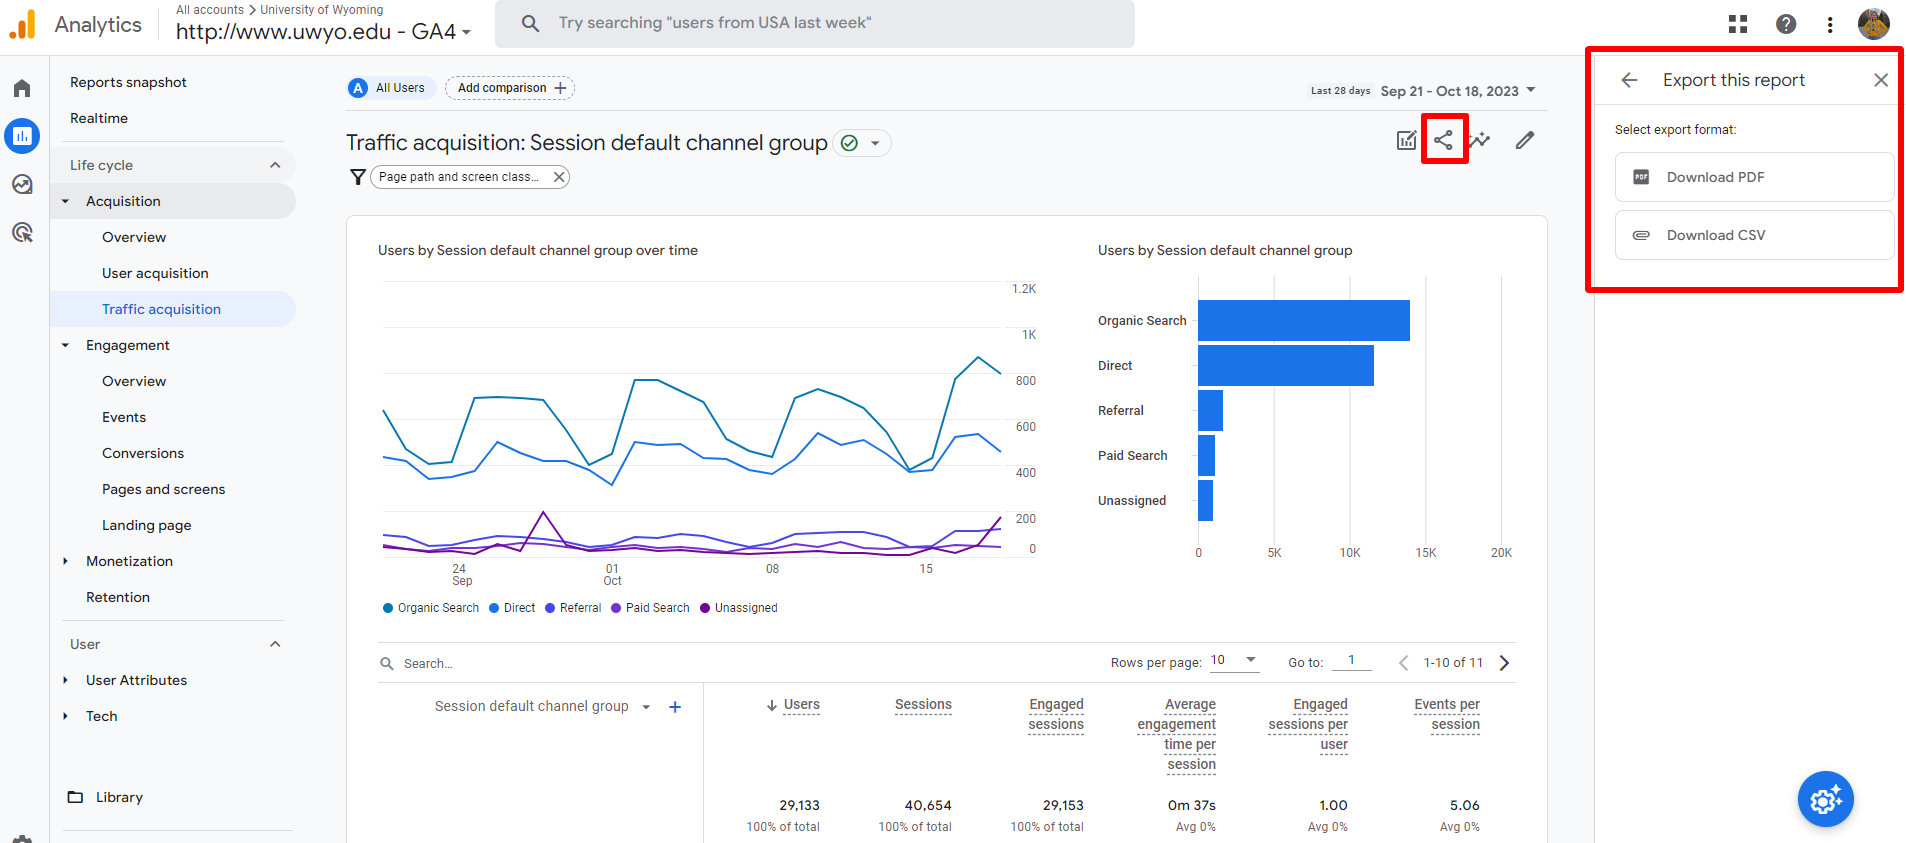
From there, you'll should only see traffic acquisition data for your site. Feel free to play around with date ranges, Rows per page and other customizable data. To export your data, click the "Share this report" icon under the date range and export as a PDF or CSV.
To break down traffic acquisition on the page level, select the "+" next to "Session default channel group" > "Page / screen" > "Page path and screen class".
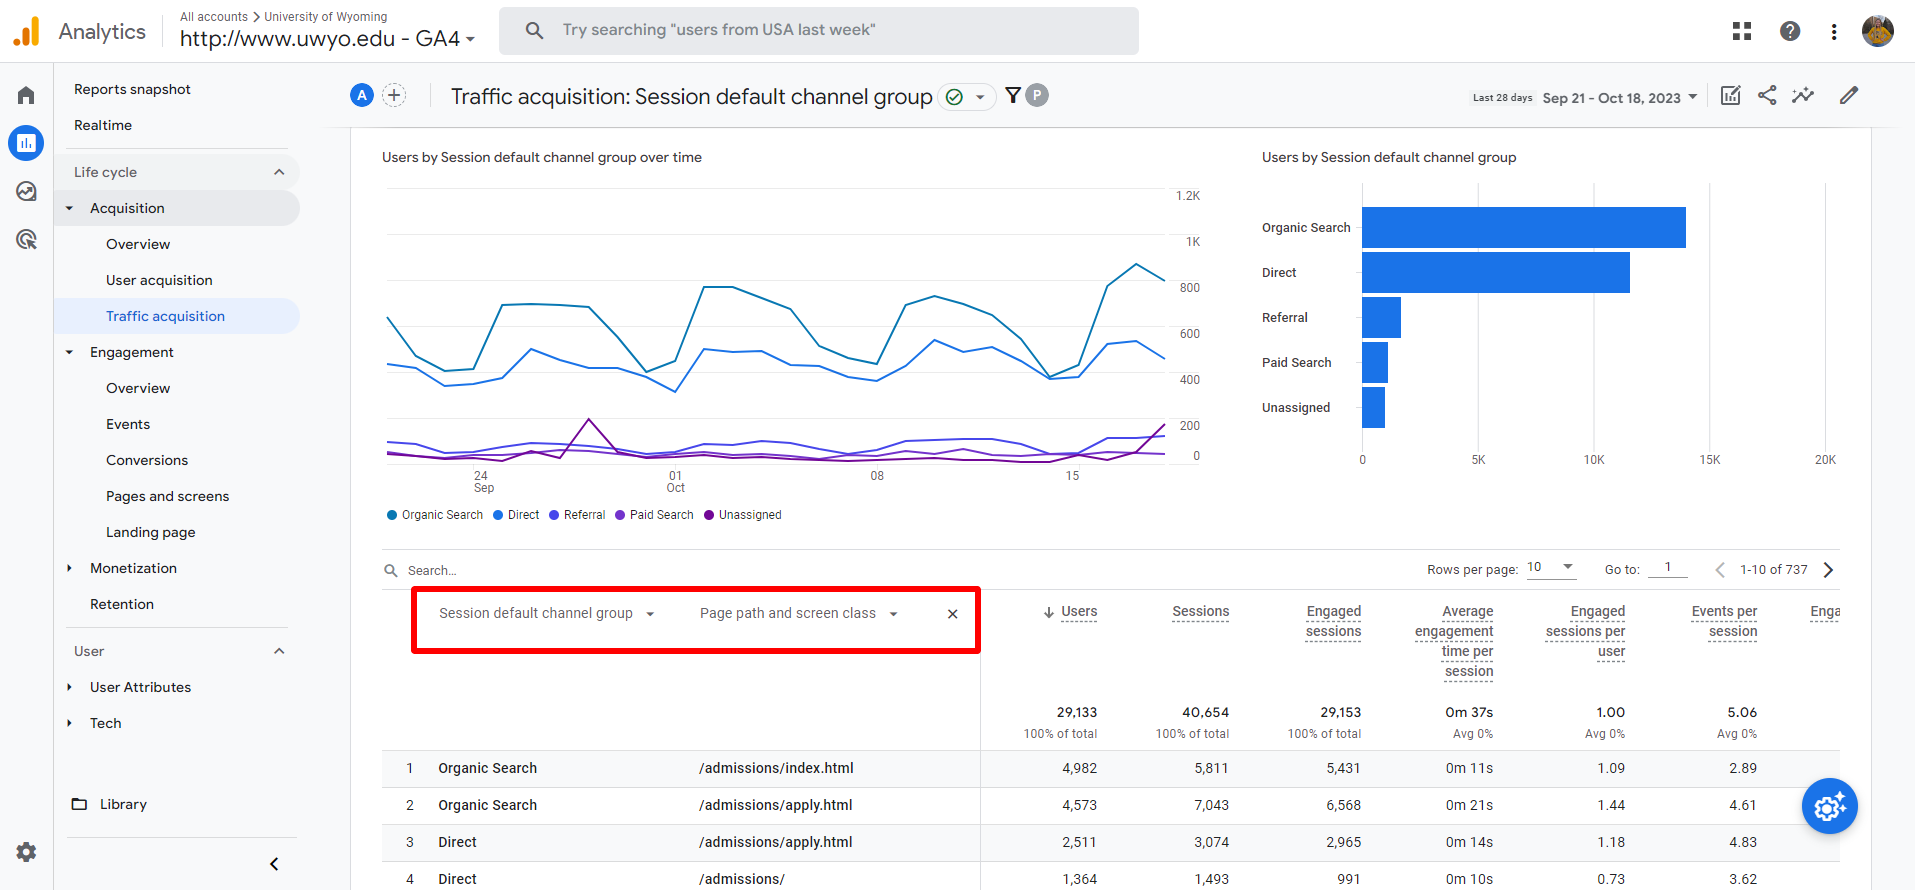
To export your data, click the "Share this report" icon under the date range and export as a PDF or CSV.
Google Analytics offers a bunch of other reports you can easily grab, especially for your specific site, using the nifty "Filter" function.
The "Explorations" section you see under "Reports" on the far left-hand side gives you the ability to build custom reports that the normal GA4 functions can't. Please contact Web Strategist, Shelbey Gunter (sprusia@uwyo.edu) if you are interested in pulling a custom report for your site. She should only be contacted if the the Pages & Screens Report and Traffic Acquisition Report do not suffice for your department's needs.
Please use our example Pages & Screens Report to follow along - when you receive this kind of report, it will look exactly like this one (with a different date range)!
Top Two Views Graphs
At the top of a Pages & Screens Report, you'll see a line graph as well as a bar graph of views in that specific date range. This is a great visual representation to see trends in page views for your top five pages.
Views
The first category in the table is "Views." This metric is simply how many views that particular page got in the set date range. A good baseline to aim for this metric is 10,000 pageviews per month.
Users
This is how many users accessed that particular page in that date range.
Views Per User
This metric shows the average amount of times a user visited the page within in the date range.
Average Engagement Time
Wondering how long users stay on your page? This is the metric for you! A normal visitor spends 52 seconds on a page, so aiming for that or higher is ideal.
Event Count
Event Count refers to the total number of interactions or actions taken by users on a page. These events include actions like button clicks, video plays and more.
Conversions
This metric is less important for the normal site editor as conversions are set up by the Institutional Marketing team to track things such as students hitting an application success page or visiting our programs page. While the example report has numbers in the conversion category, you will likely see a lot of 0.00, which is completely normal and okay!
Total Revenue
UW's website does not bring any revenue, so this metric will always display as $0.00.
Please use our example Traffic Acquisition Report to follow along - when you receive this kind of report, it will look exactly like this one!
Top Two Default Channel Graphs
At the top of a Traffic Acquisition Report, you'll see a line graph as well as a bar graph of default channels in that specific date range. This is a great visual representation to see trends of your top five default channels and see quickly how users are accessing your pages.
Default Channel Group*
Organic Search
Users who visited your webpages by clicking on a search result from a search engine,
without any direct influence from paid advertising.
Direct
Users who directly entered your webpages URL into their browser or accessed it through
a bookmark.
Referral
Users who visited your webpages by clicking on a link from another webpage.
Paid Search
Users who visited your webpages by clicking on a link from a paid advertising campaign.
Display
Users who visited your webpages after clicking on a display ad.
Unassigned
Traffic sources that could not be categorized or attributed to a specific channel
or medium.
Organic Social
Users who visited your webpages by clicking on a link from a social media platform
without any influence from advertising.
Paid Video
Users who visited your webpages after clicking on a video advertisement.
Email
Users who visited your webpages by clicking on a link within an email.
Paid Other
Users who arrived on one of your webpages through paid advertising channels not covered
by specific categories like search, display or video.
Organic Video
Users who visited your webpages after clicking on a link from a video platform without
any influence from advertising.
*Note: All default channel groups might not show up on your report.
Table Metrics
Users
This is the total number of individuals who visited your webpages within the set date
range.
Sessions
The total number of interactions (pageviews, events, etc.) that occurred on your webpages
within the set date range, initiated by a single user.
Engaged Sessions
Sessions where users interact with the website by performing actions such as clicking
on links, watching videos or submitting forms, indicating a higher level of user engagement
compared to passive pageviews.
Engaged Sessions Per User
Quantifies the average number of engaged sessions per user.
Events Per Session
The average number of interactions or actions (such as clicks, forms submissions or
video plays) that take place within a single session on your pages.
Engagement Rate
Measures sessions on your webpages that involve active user interaction, providing
a percentage indicating level of user engagement.
Event Count
The total number of specific user interactions or actions tracked on a webpage.
Conversions
This metric is less important for the normal site editor as conversions are set up
by the Institutional Marketing team to track things such as students hitting an application
success page or visiting our programs page. While the example report has numbers in
the conversion category, you will likely see a lot of 0.00, which is completely normal
and okay!
Total Revenue
UW's website does not bring any revenue, so this metric will always display as $0.00.
To request Google Analytic reports for your site(s), please fill out the following
form and Website Strategist, Shelbey Gunter (sprusia@uwyo.edu) will be in touch with you soon. If you are unsure what report you want, please review
the "Suggested Reports to Pull in GA4" section and read the paragraph of the three different reports.
Institutional Marketing, Web Team
Dept. 3226, 1000 E. University Avenue
Laramie, WY 82071-2000
Email: webhelp@uwyo.edu
-----------------------------------
Web Strategist, Shelbey Gunter
Email: sprusia@uwyo.edu