
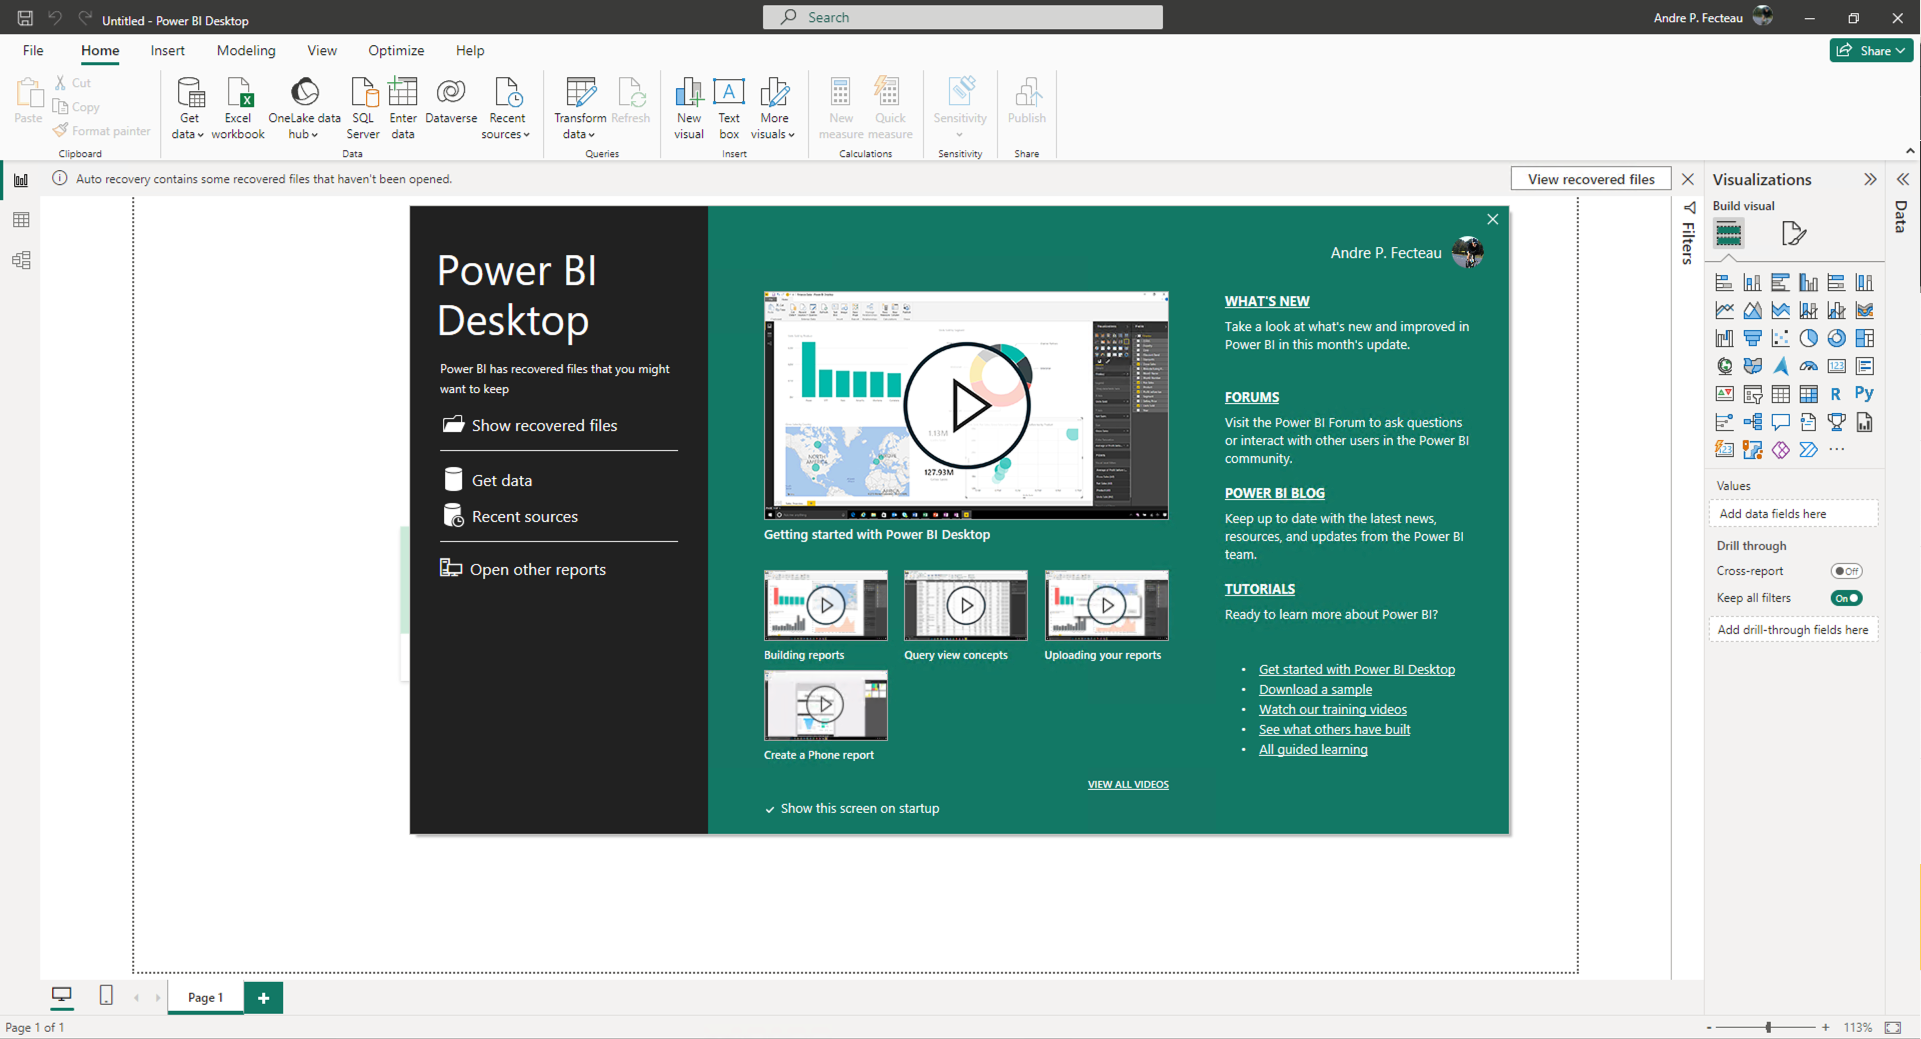
PowerBI Desktop
"Power BI Desktop is a free application you install on your local computer that lets you connect to, transform, and visualize your data." - Microsoft PowerBI Desktop Documentation
PowerBI Desktop can be downloaded from Microsoft: https://powerbi.microsoft.com/en-us/downloads/
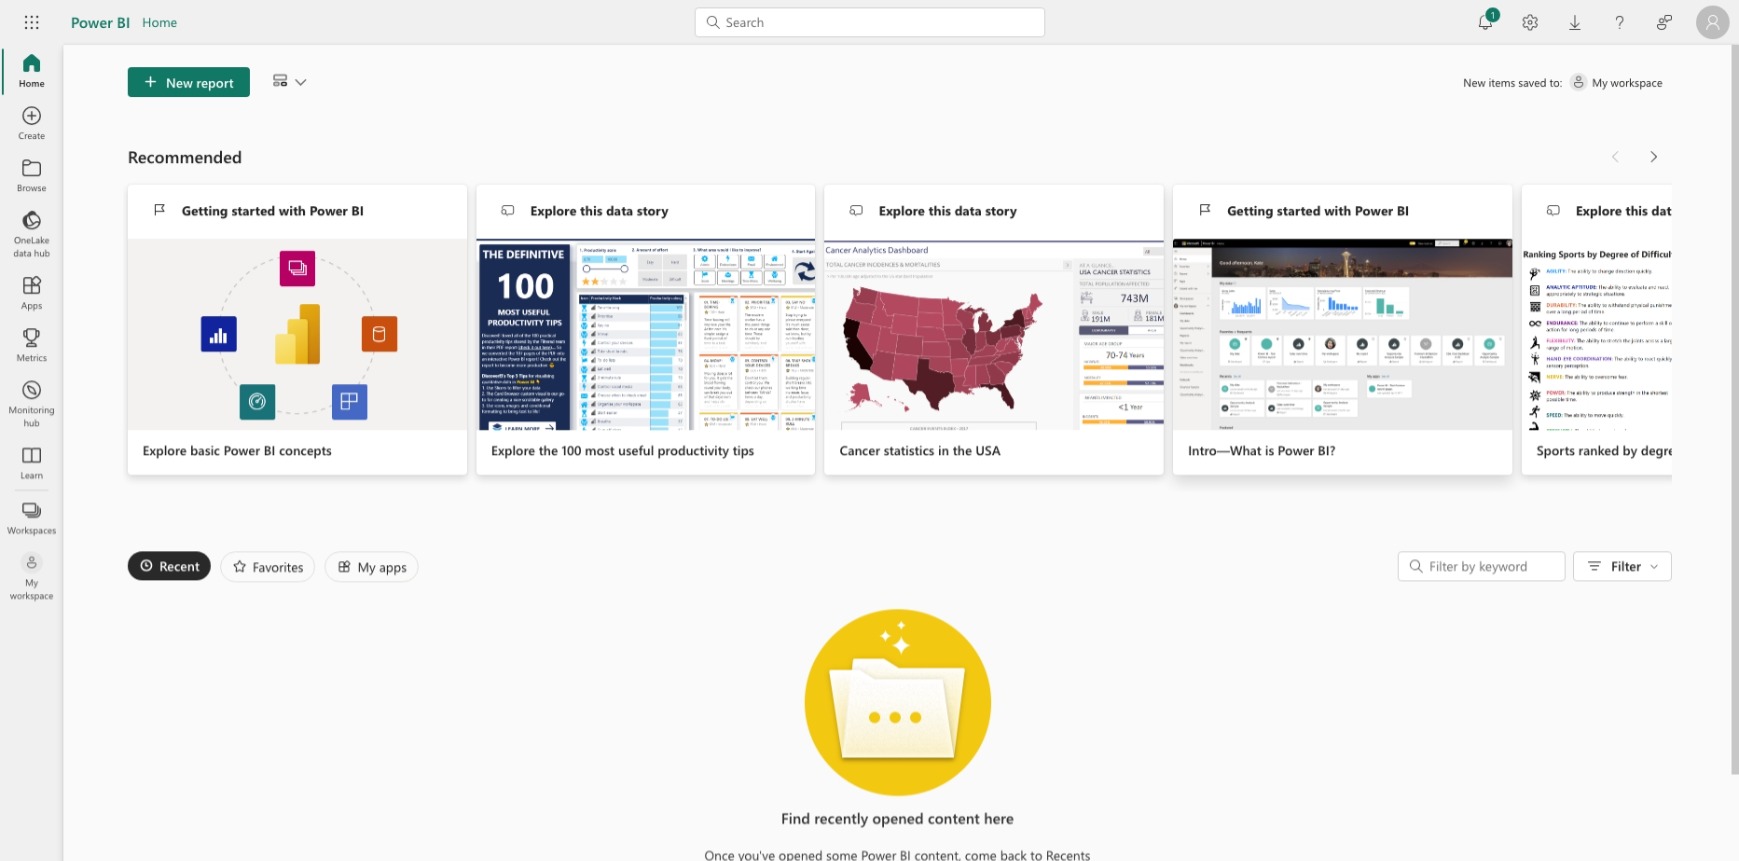
PowerBI Service
"Power BI is a collection of software services, apps, and connectors that work together to help you create, share, and consume business insights in the way that serves you and your business most effectively." - Microsoft PowerBI Service Documentation
PowerBI Service can be accessed by navigating to: https://app.powerbi.com
Datasets
To get started creating a dataset, you will most likely need a connection to one of our data systems on campus. If you don't already have access please visit our Data Access page to learn how to get started!
Reports
If you aren't sure where to begin creating a report, we have created a report template you can download. This template has the base layout that we require for governance, clarity, and continuity between reports; along with an example of how to lay out your visualizations. Review out our Report Template page to learn more.
Workspaces
Once you've created your report and dataset you'll want to share it with your colleagues. We use workspaces grouped by department/business unit, and follow a Development, Test, Production model. We call this a "workspace stack". To learn more about workspaces, the workspace stack, and how to request your groups stack visit our Workspaces page.
Publishing Reports (Deployment Pipelines)
We employ a feature of PowerBI Service called "Deployment Pipelines" to manage the Development/Test/Production lifecycle of reports and datasets. This process is explained in our Deployment Pipelines page, along with how to request your report be published.
WORKSPACES REPORT TEMPLATE DEPLOYMENT PIPELINES SHARING REPORTS