Jackson Hole Economic Forecasting
April 2024 Forecast
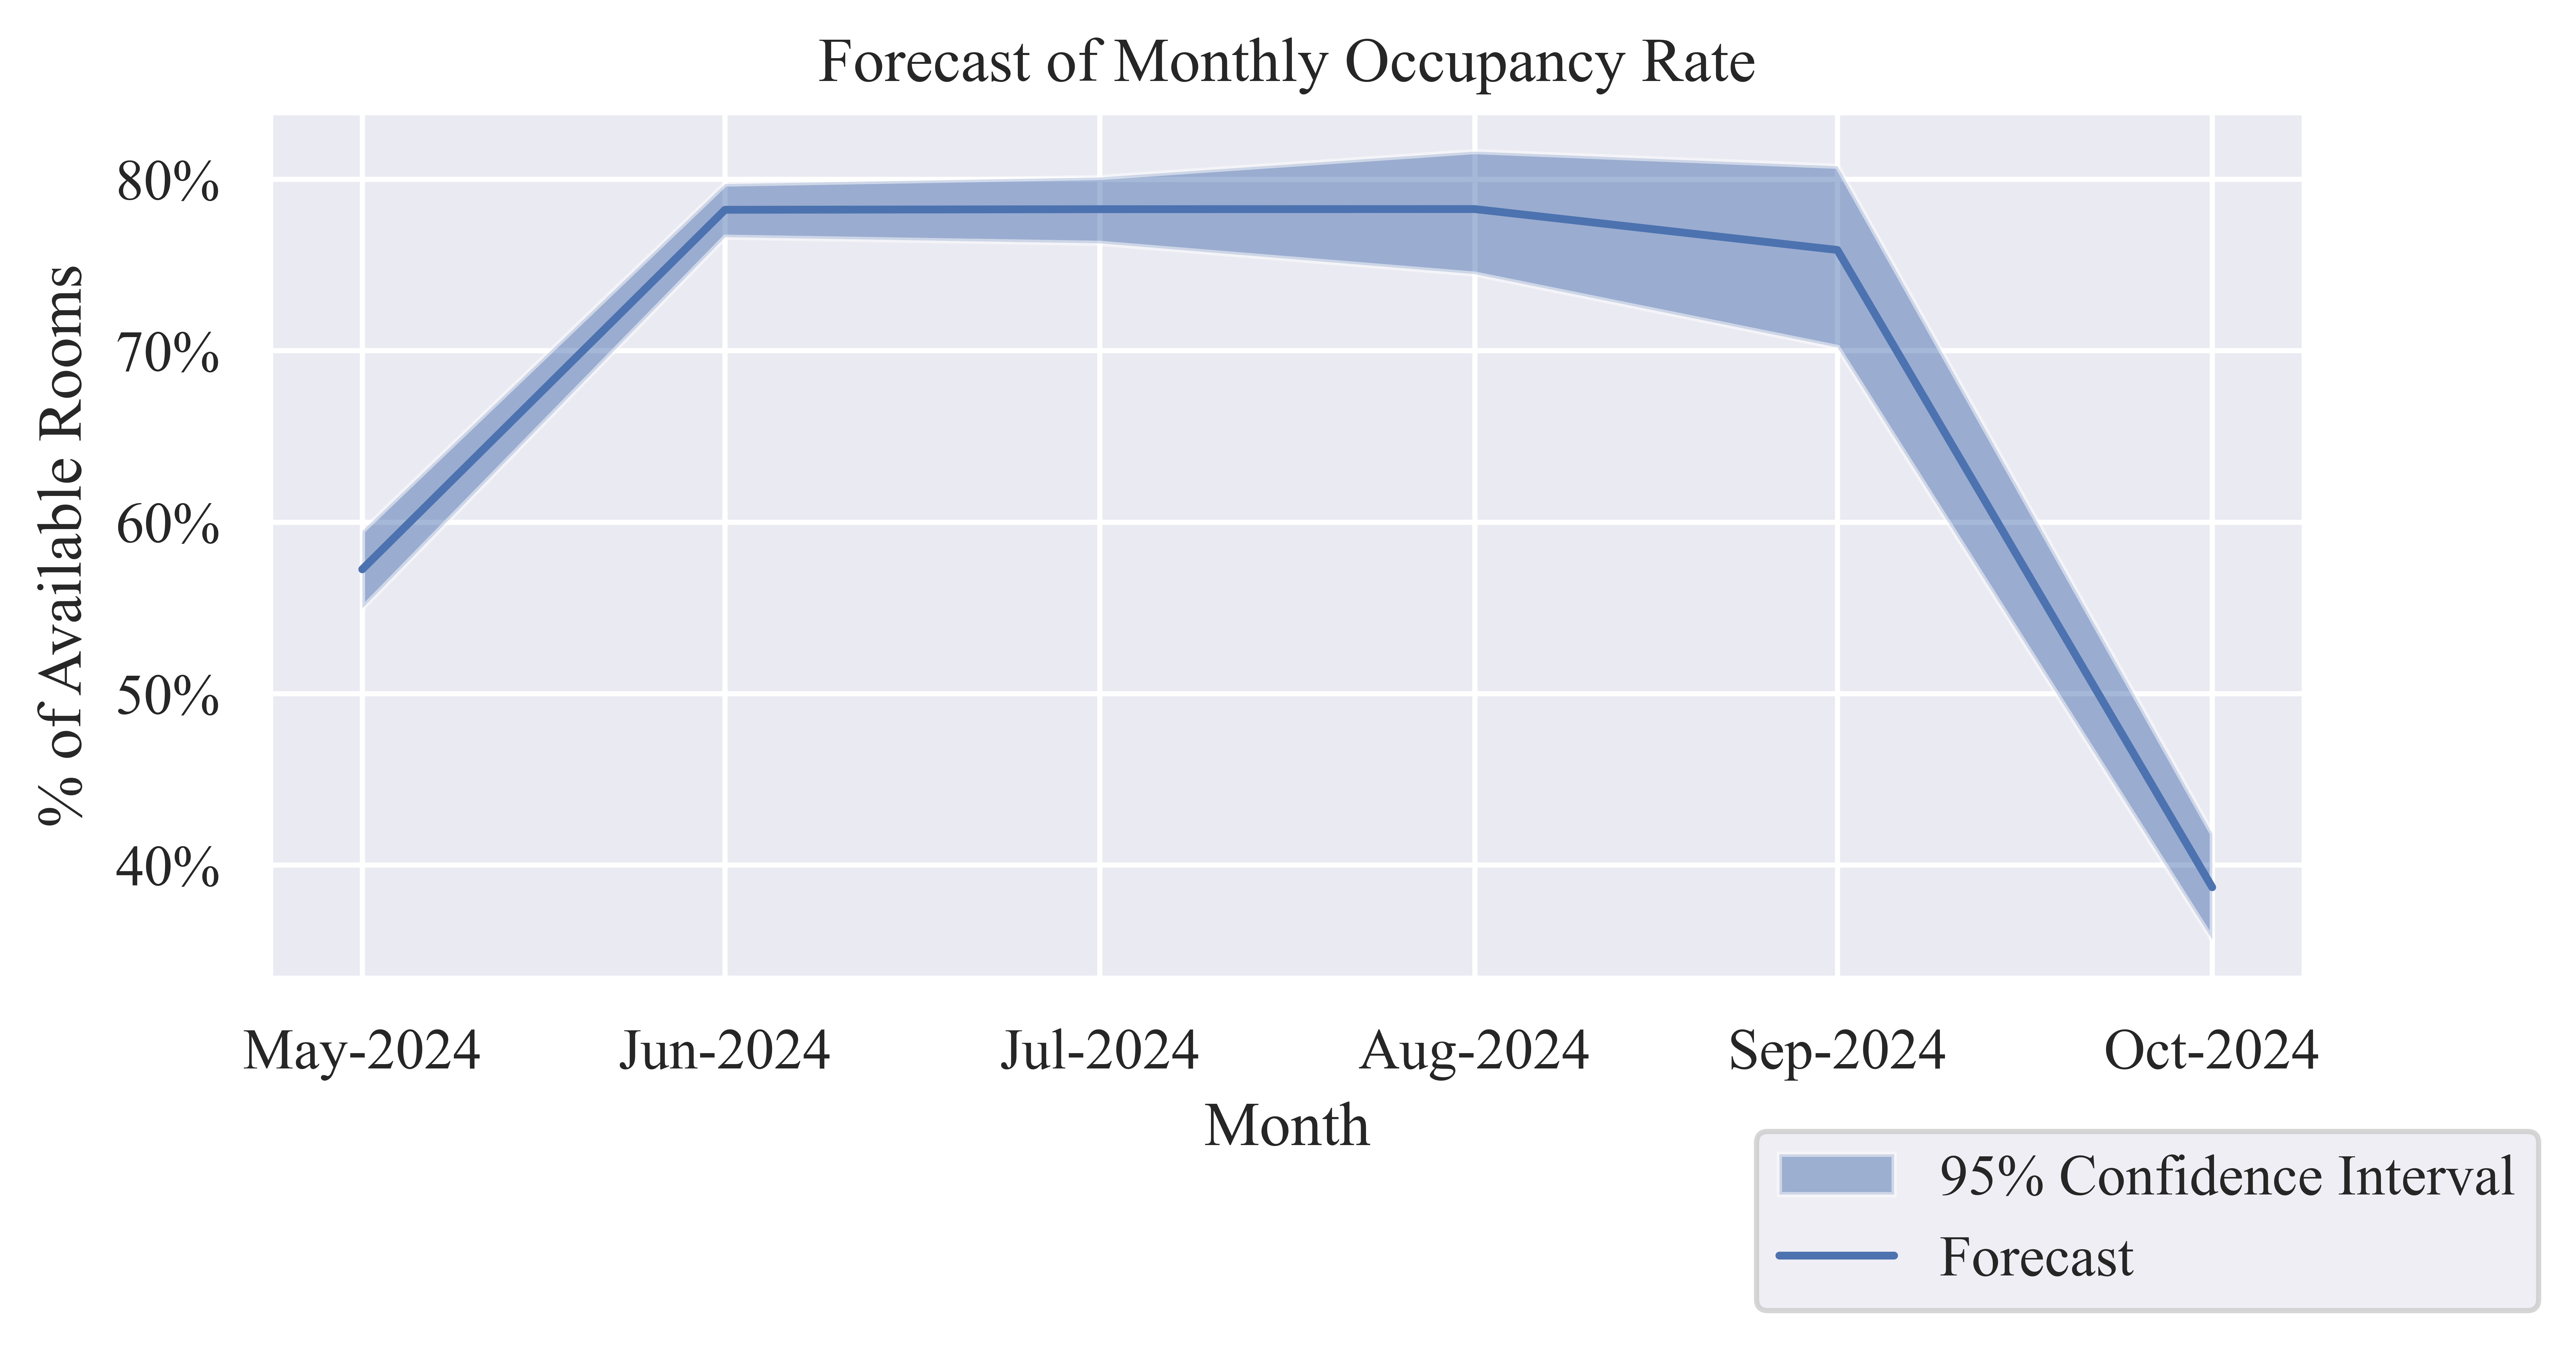
Occupancy Rate (OR)
Table 1: Forecast of Monthly Occupancy Rate
| May-2024 |
57.25% |
54.98% |
59.48% |
| Jun-2024 |
78.22% |
76.63% |
79.73% |
| Jul-2024 |
78.25% |
76.27% |
80.11% |
| Aug-2024 |
78.26% |
74.48% |
81.62% |
| Sep-2024 |
75.87% |
70.20% |
80.76% |
| Oct-2024 |
38.70% |
35.66% |
41.84% |
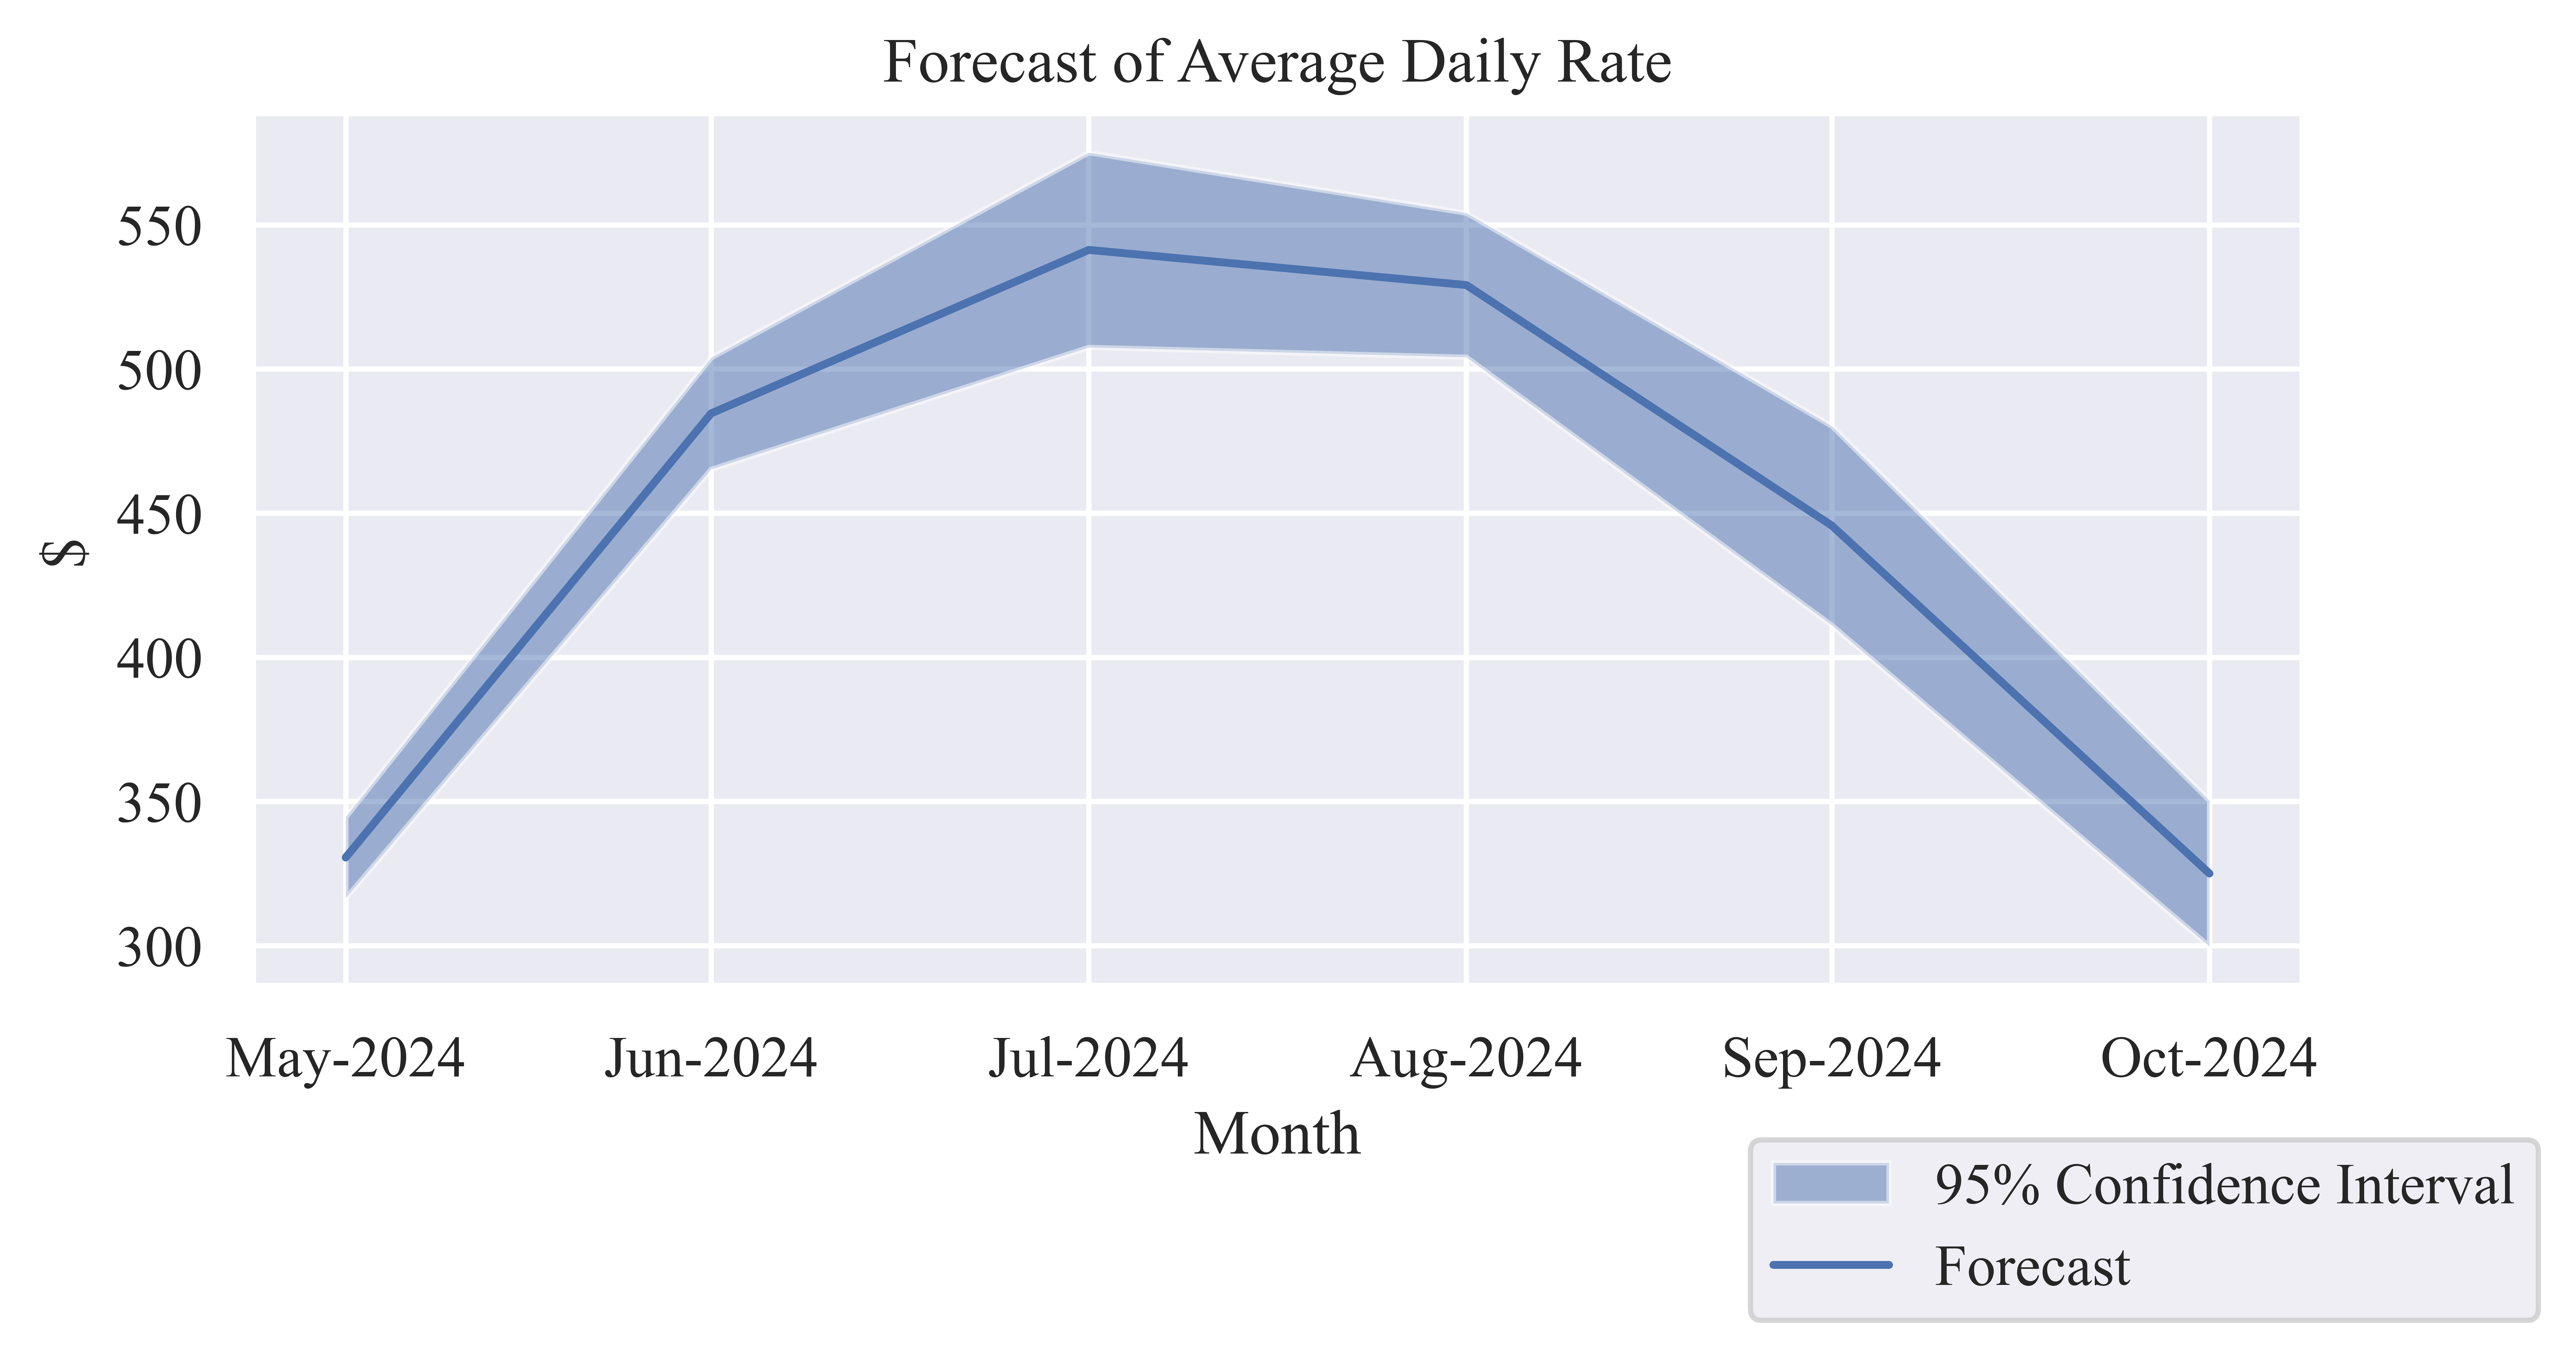
Average Daily Rate (ADR)
Table 2: Forecast of Monthly Average Daily Rate
| May-2024 |
$330.56 |
$316.51 |
$344.61 |
| Jun-2024 |
$484.59 |
$465.24 |
$503.93 |
| Jul-2024 |
$541.29 |
$507.53 |
$575.04 |
| Aug-2024 |
$529.10 |
$504.12 |
$554.09 |
| Sep-2024 |
$445.67 |
$411.13 |
$480.21 |
| Oct-2024 |
$325.02 |
$299.74 |
$350.30 |
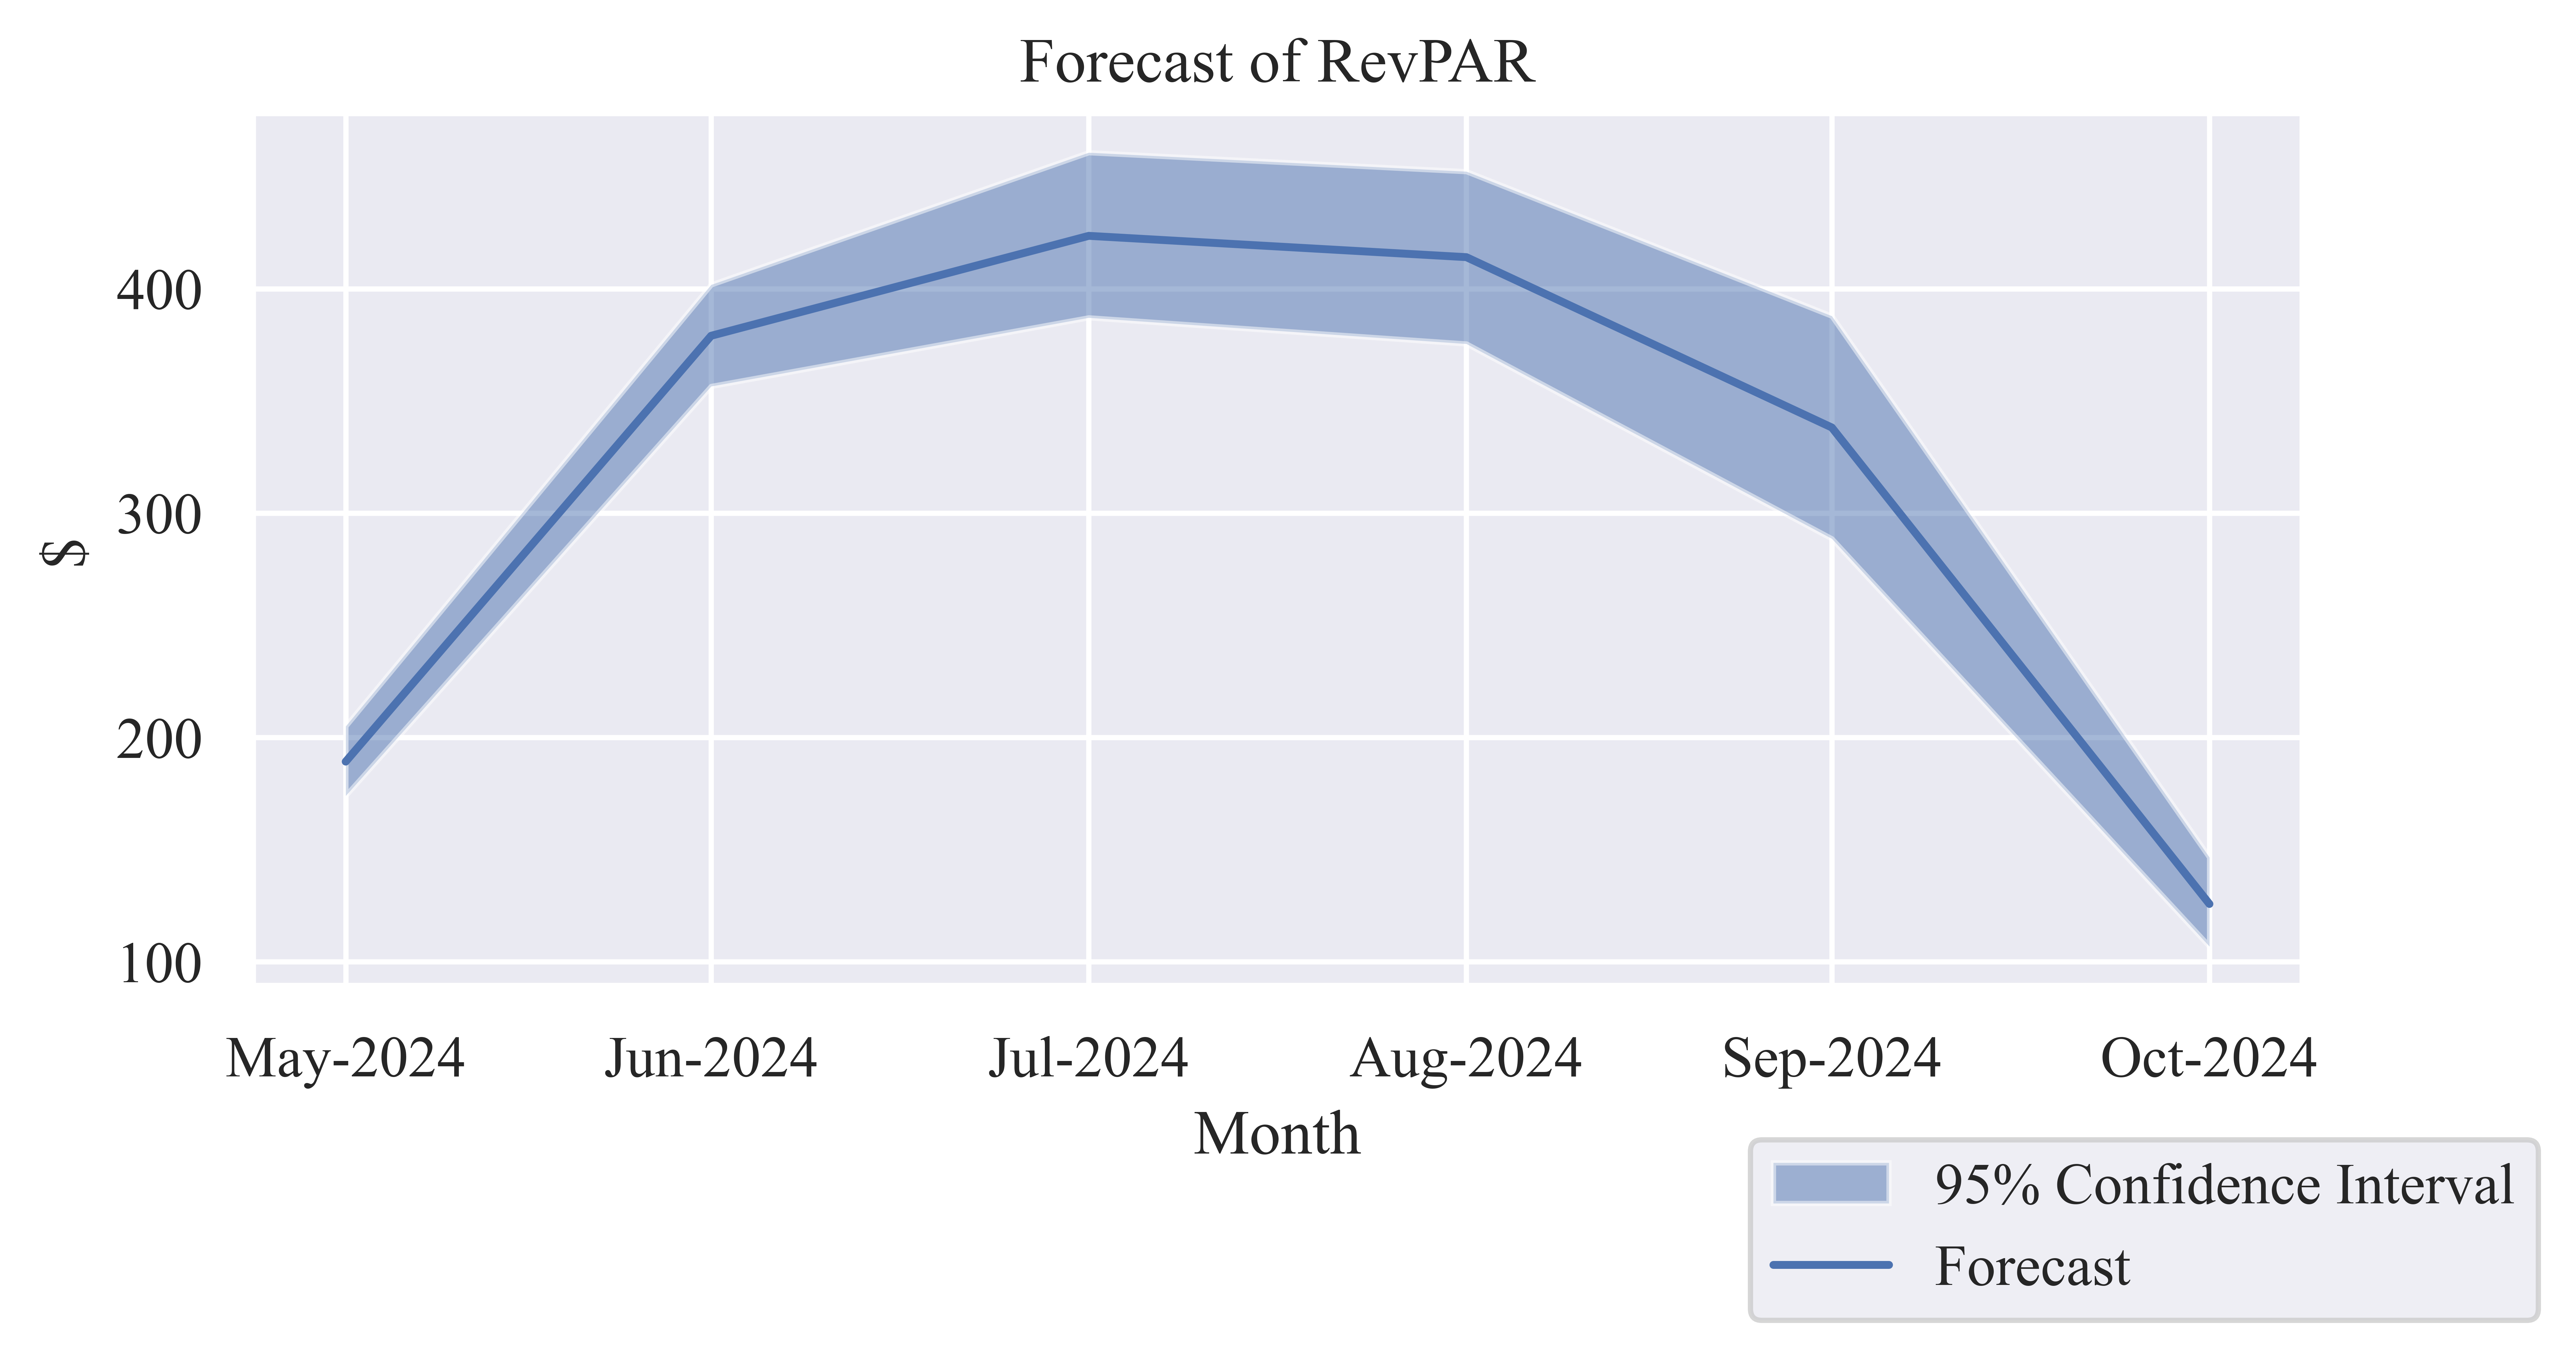
Revenue per Available Room (RevPAR)
Table 3: Forecast of Monthly RevPAR
| May-2024 |
$189.24 |
$174.02 |
$204.99 |
| Jun-2024 |
$379.03 |
$356.50 |
$401.77 |
| Jul-2024 |
$423.56 |
$387.08 |
$460.68 |
| Aug-2024 |
$414.07 |
$375.44 |
$452.24 |
| Sep-2024 |
$338.15 |
$288.61 |
$387.84 |
| Oct-2024 |
$125.79 |
$106.89 |
$146.55 |
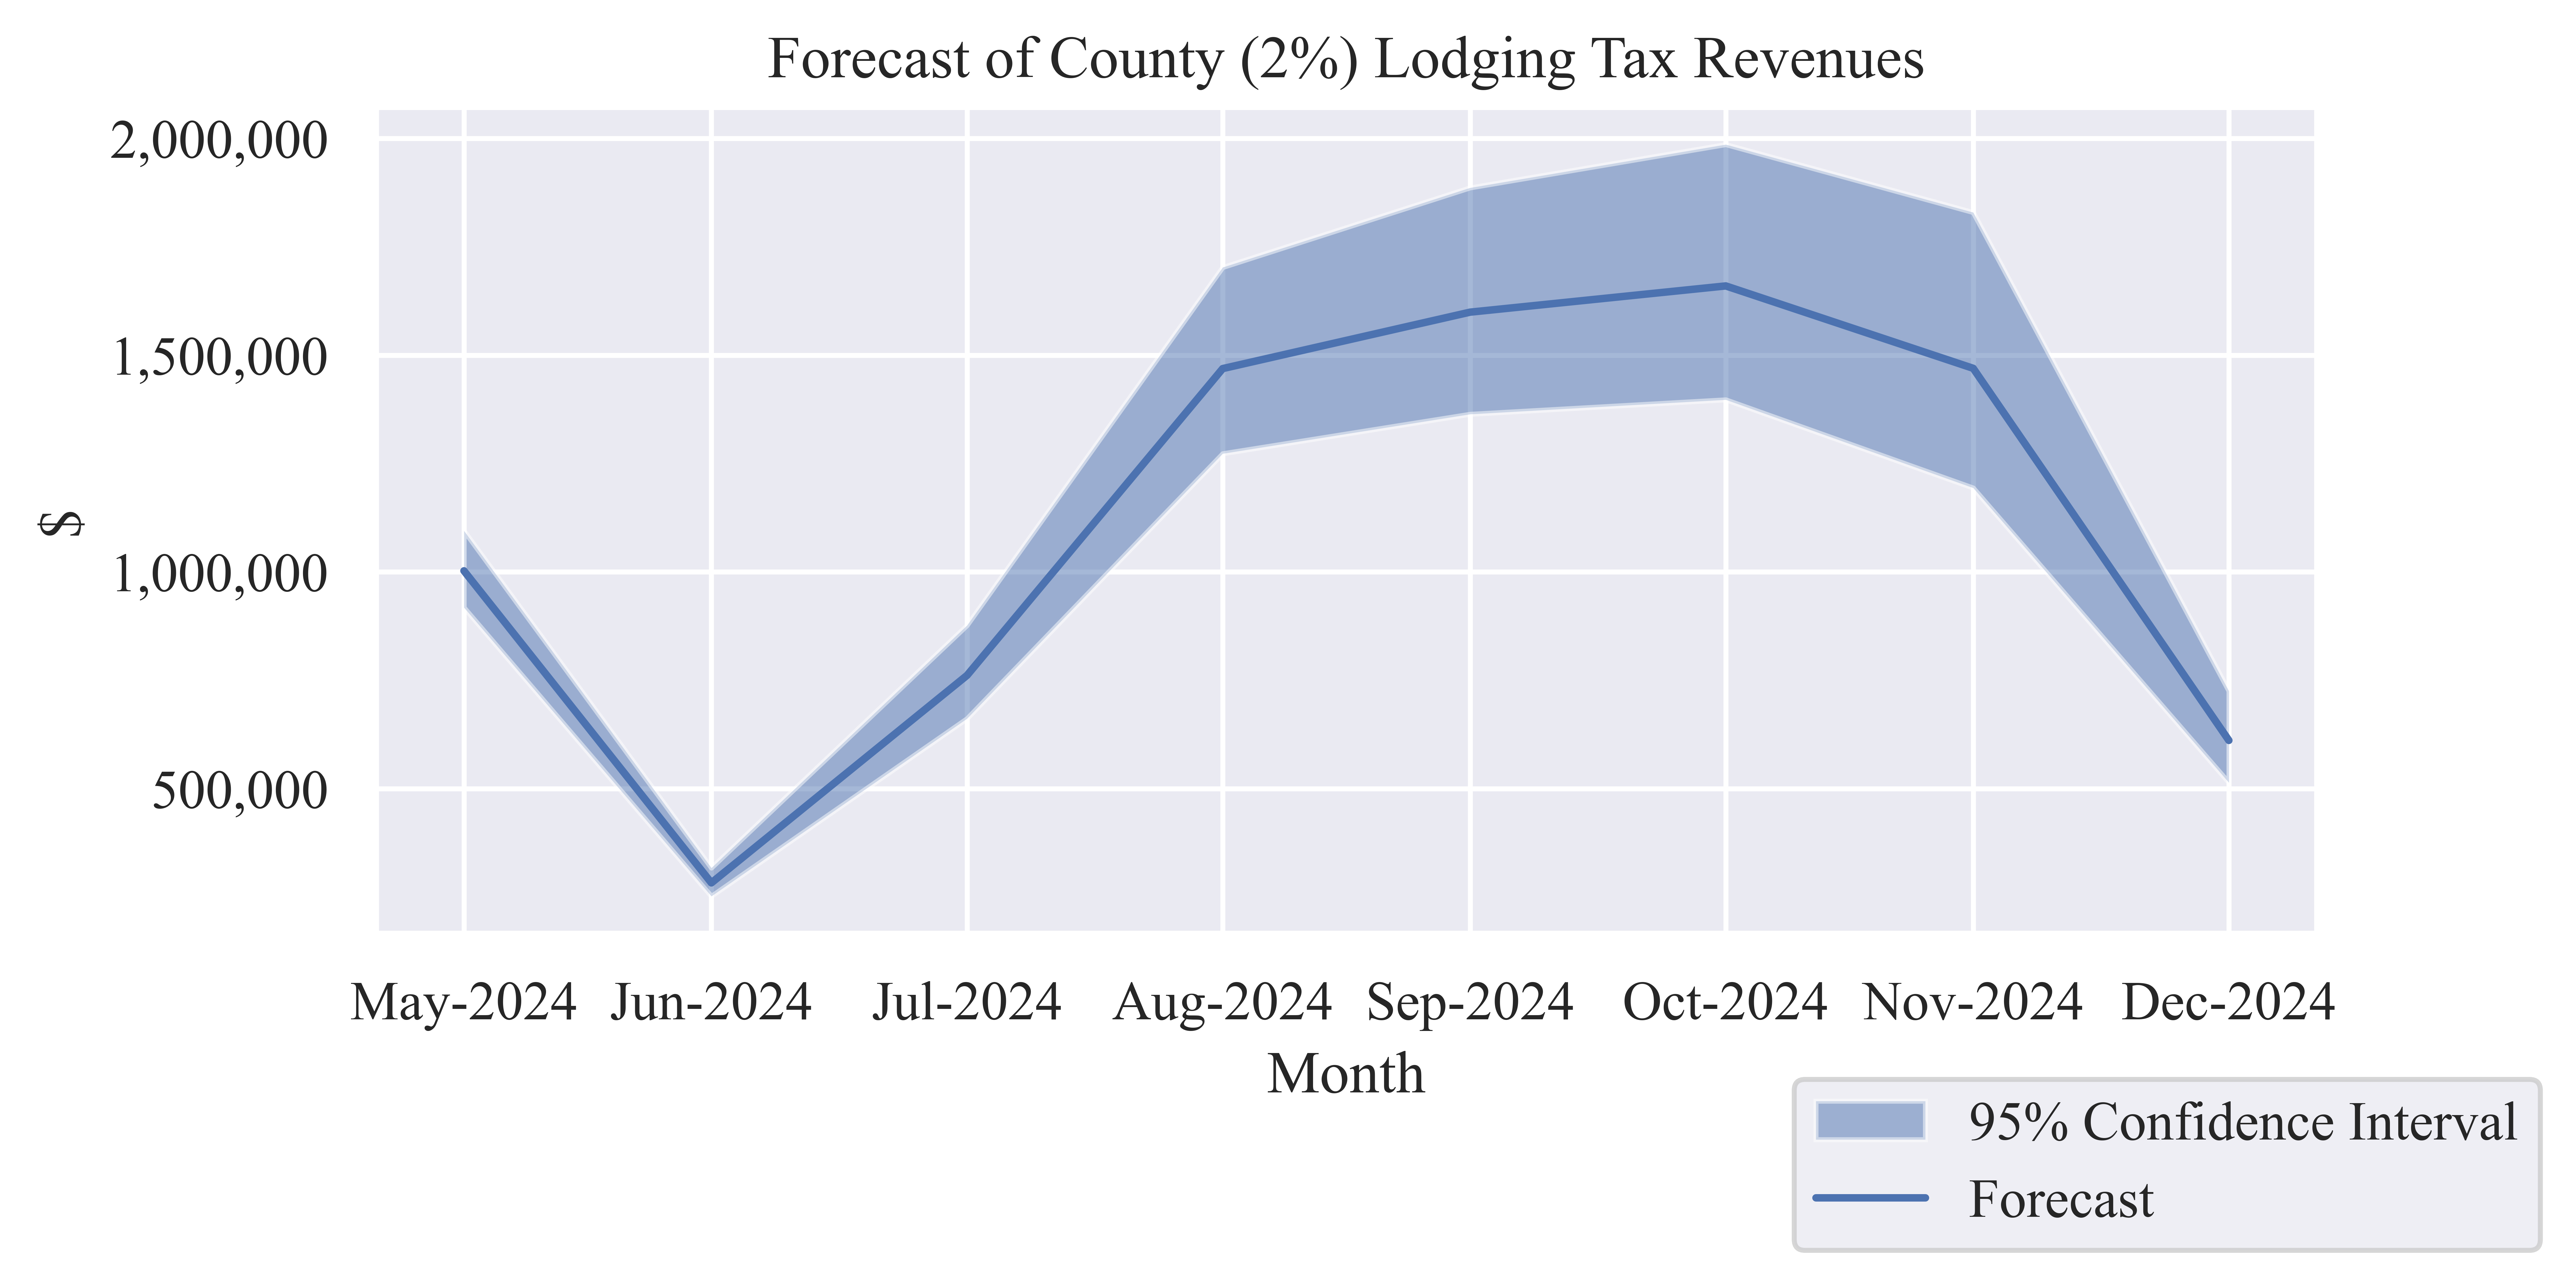
Tax Revenues
Table 4: Forecast County (2%) Lodging Tax Revenue
| May-2024 |
$1,002,704 |
$918,103 |
$1,095,102 |
| Jun-2024 |
$282,903 |
$252,130 |
$317,431 |
| Jul-2024 |
$761,568 |
$661,838 |
$876,852 |
| Aug-2024 |
$1,469,191 |
$1,273,074 |
$1,702,722 |
| Sep-2024 |
$1,599,373 |
$1,364,052 |
$1,886,330 |
| Oct-2024 |
$1,659,865 |
$1,397,390 |
$1,986,130 |
| Nov-2024 |
$1,469,811 |
$1,193,977 |
$1,829,511 |
| Dec-2024 |
$611,503 |
$514,257 |
$725,402 |
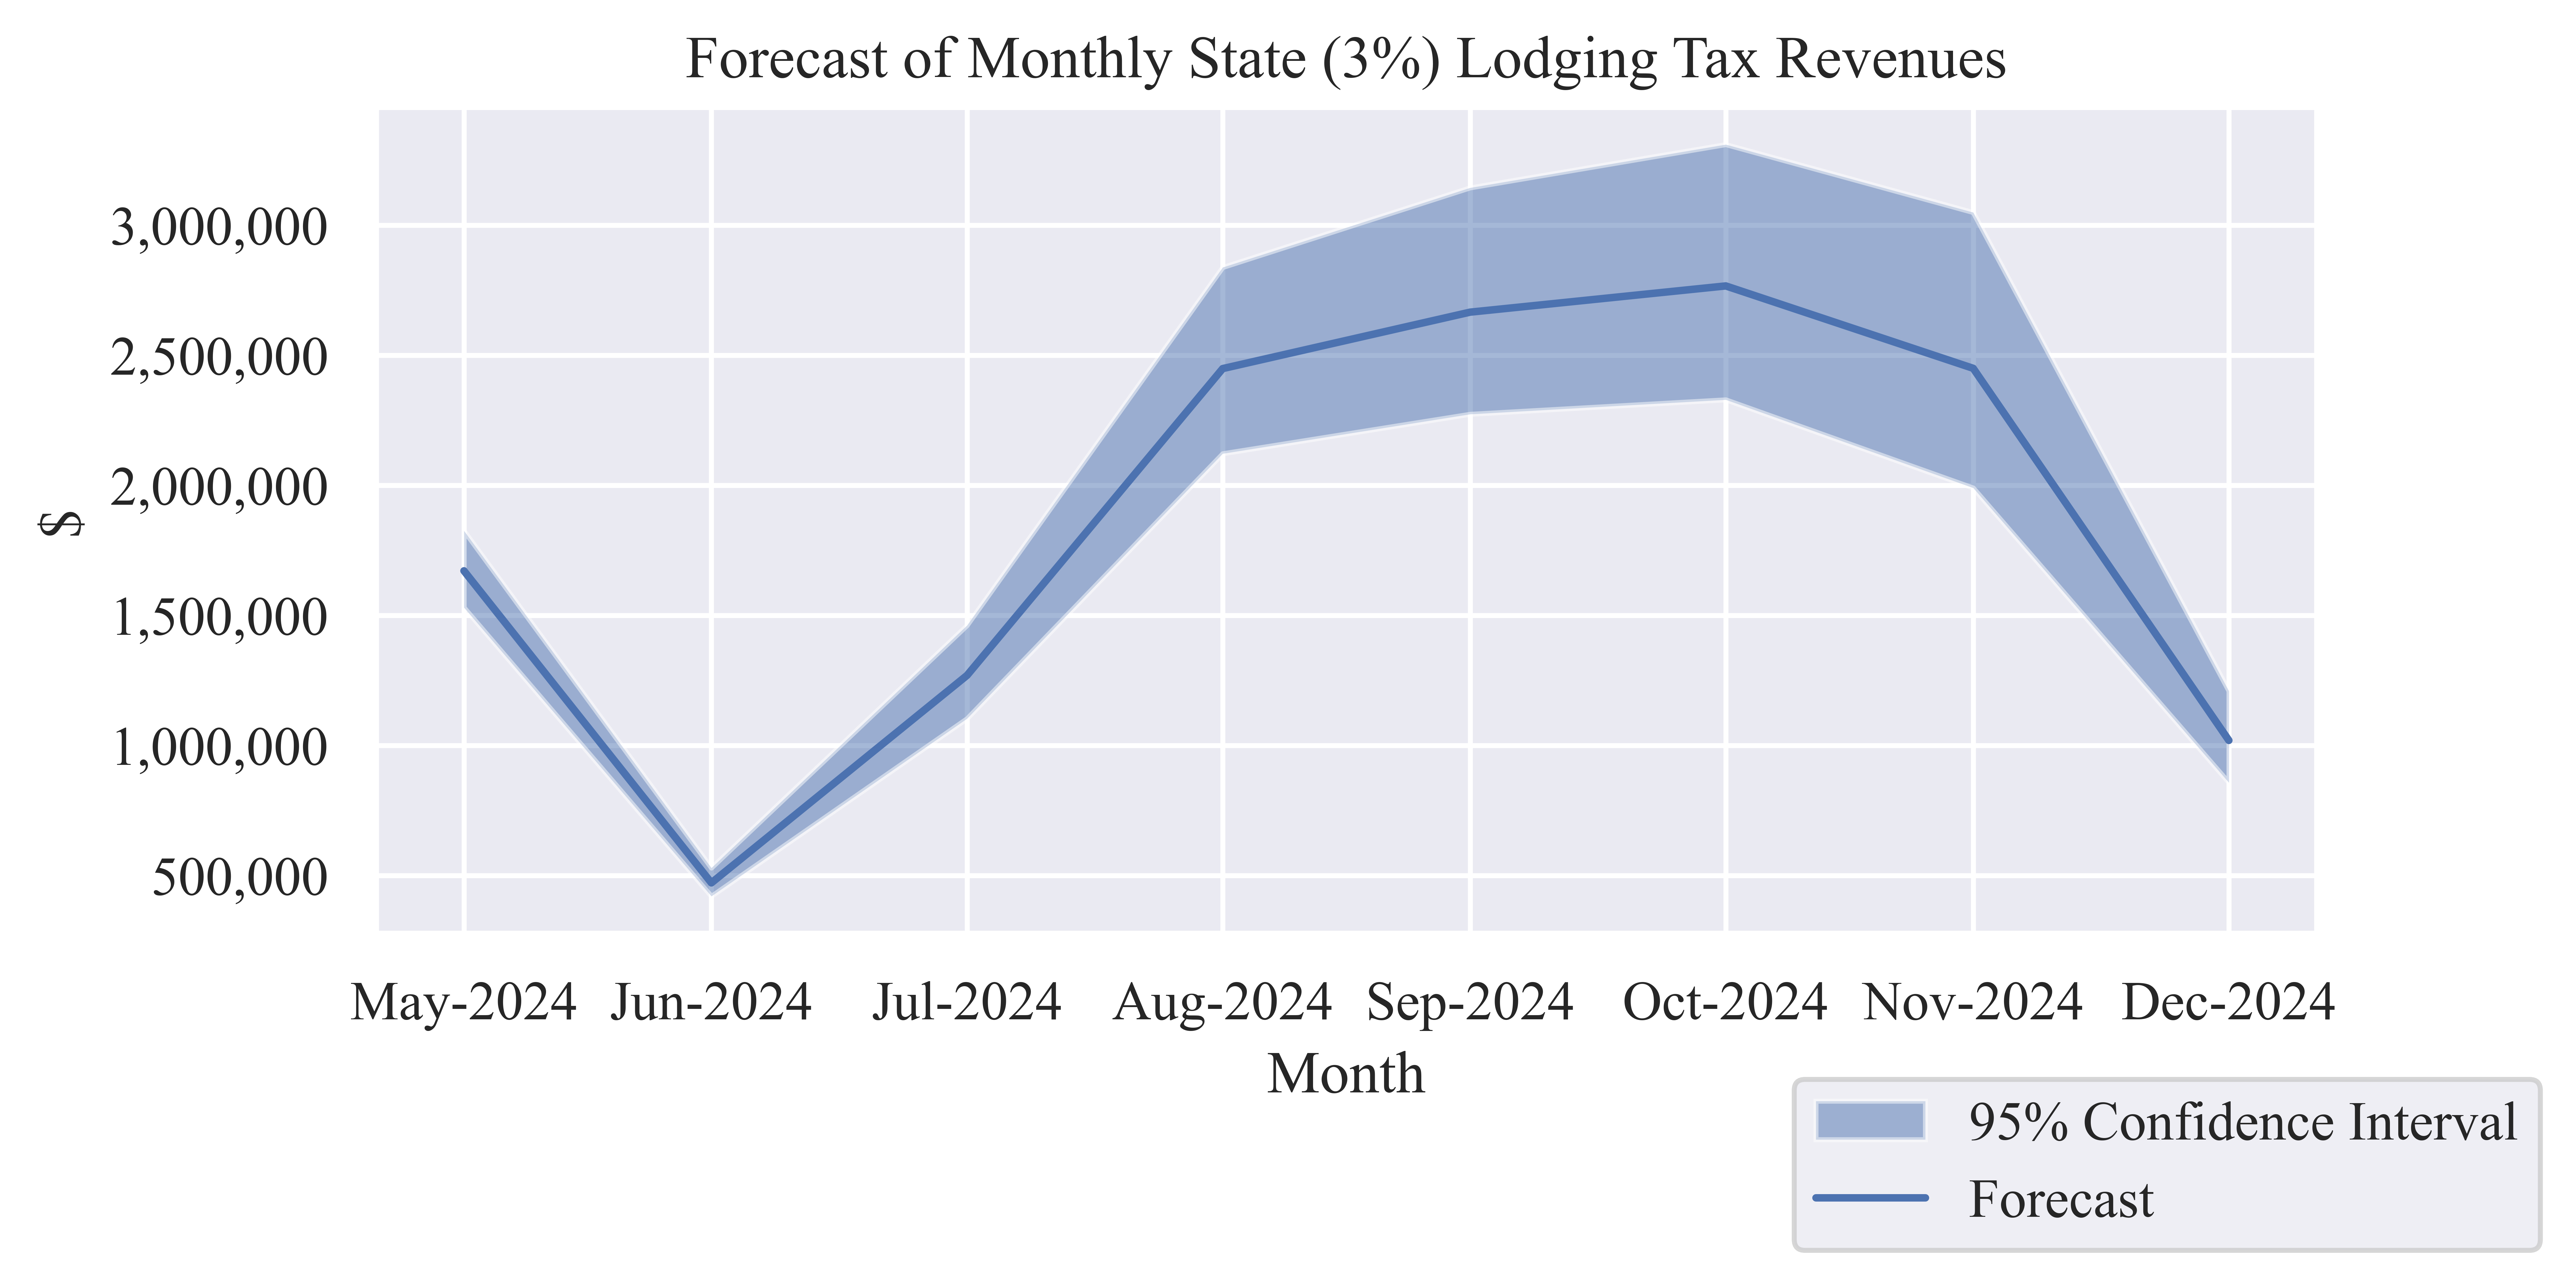
Table 5: Forecast State (3%) Lodging Tax Revenue
| May-2024 |
$1,671,174 |
$1,530,171 |
$1,825,170 |
| Jun-2024 |
$471,505 |
$420,217 |
$529,052 |
| Jul-2024 |
$1,269,280 |
$1,103,063 |
$1,461,420 |
| Aug-2024 |
$2,448,652 |
$2,121,790 |
$2,837,870 |
| Sep-2024 |
$2,665,622 |
$2,273,419 |
$3,143,883 |
| Oct-2024 |
$2,766,442 |
$2,328,983 |
$3,310,217 |
| Nov-2024 |
$2,449,685 |
$1,989,962 |
$3,049,185 |
| Dec-2024 |
$1,019,171 |
$857,095 |
$1,209,003 |
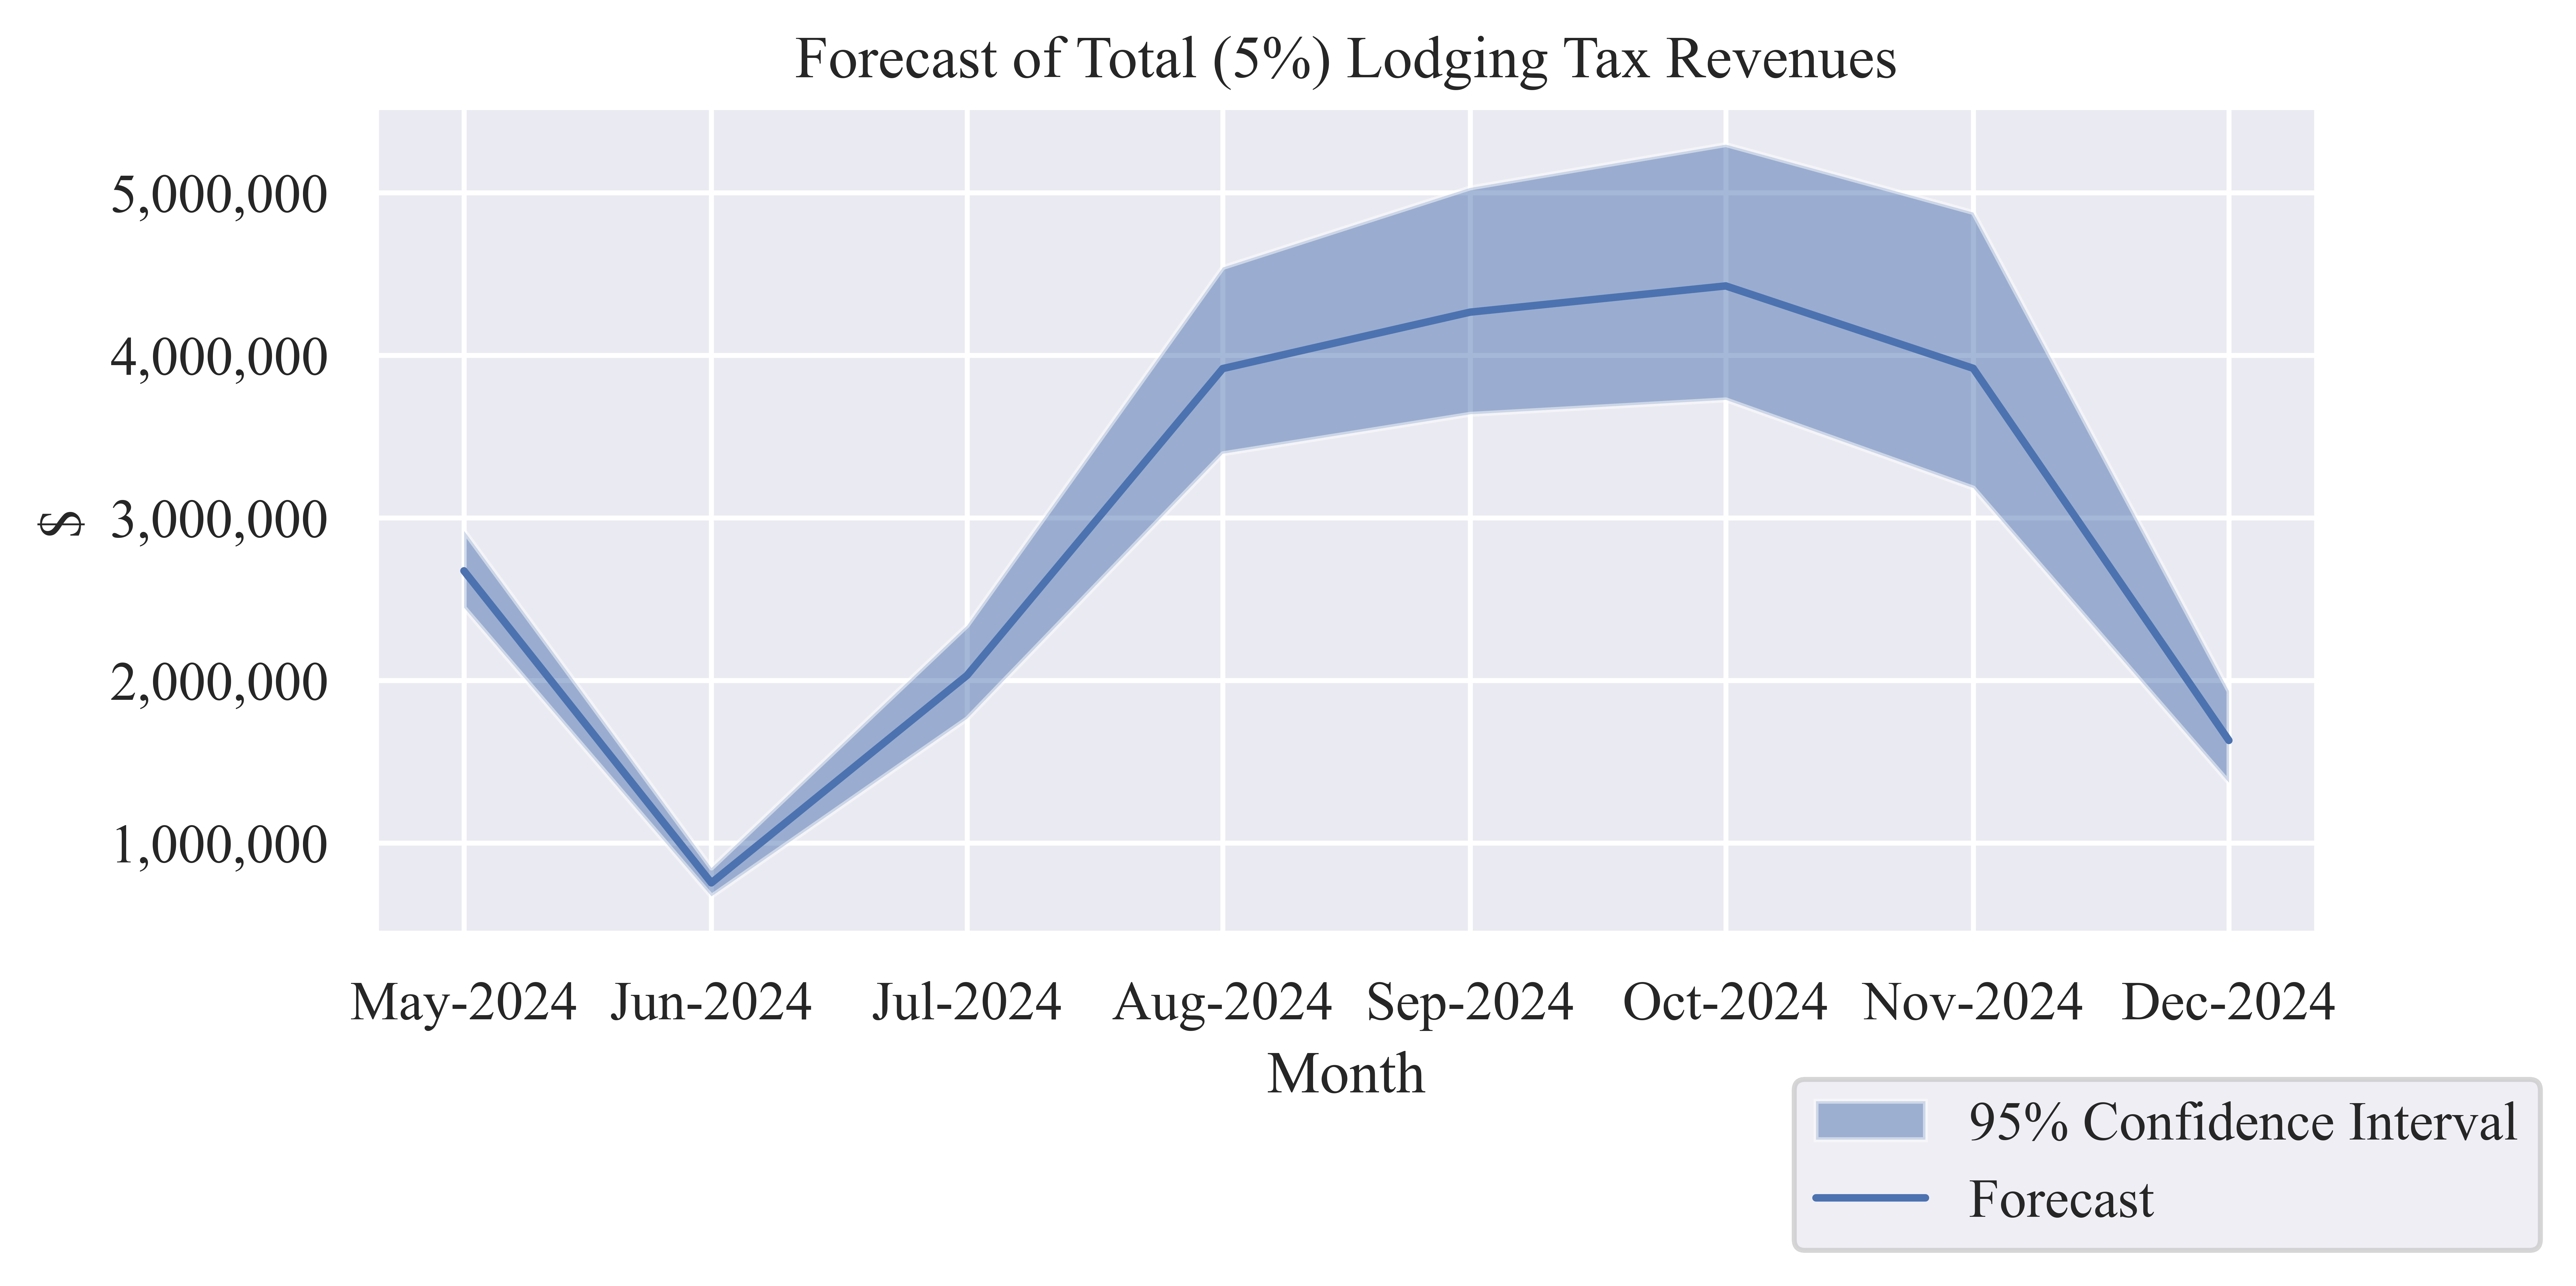
Table 6: Forecast of Monthly Total (5%) Lodging Tax Revenue
| May-2024 |
$2,673,878 |
$2,448,273 |
$2,920,272 |
| Jun-2024 |
$754,408 |
$672,347 |
$846,484 |
| Jul-2024 |
$2,030,847 |
$1,764,900 |
$2,338,272 |
| Aug-2024 |
$3,917,843 |
$3,394,864 |
$4,540,592 |
| Sep-2024 |
$4,264,995 |
$3,637,471 |
$5,030,212 |
| Oct-2024 |
$4,426,307 |
$3,726,373 |
$5,296,347 |
| Nov-2024 |
$3,919,495 |
$3,183,939 |
$4,878,696 |
| Dec-2024 |
$1,630,674 |
$1,371,353 |
$1,934,405 |
Lodging Sector Sales
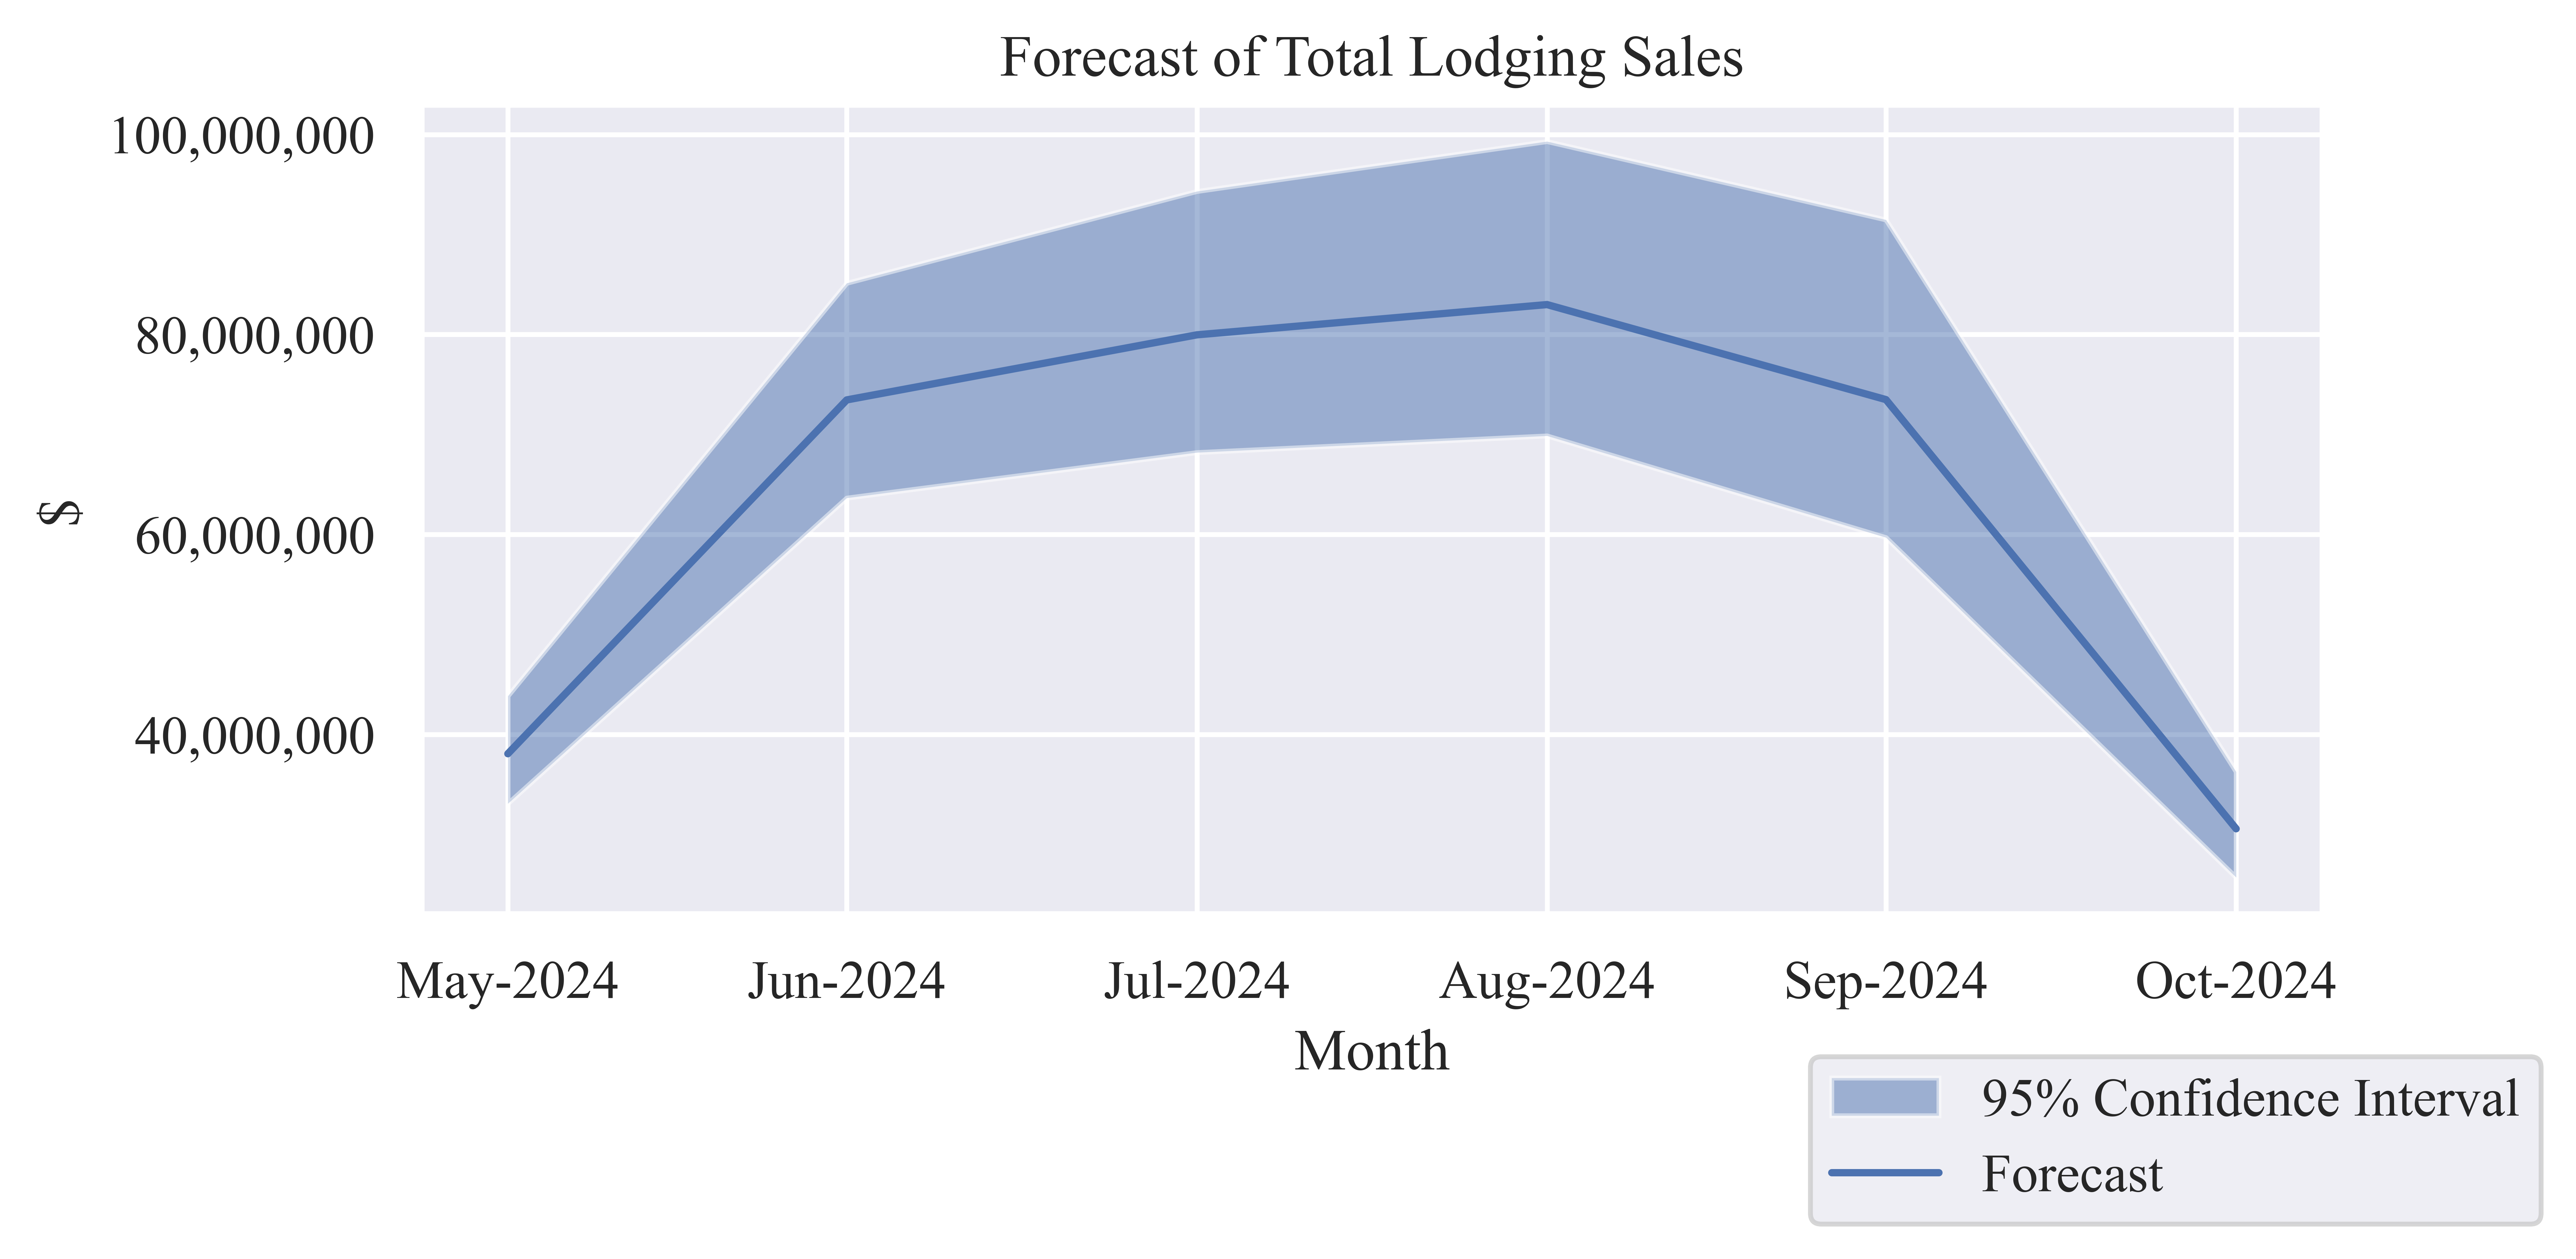
Table 7: Forecast of Monthly Lodging Sales
| May-2024 |
$38,078,385 |
$33,091,879 |
$43,842,604 |
| Jun-2024 |
$73,459,551 |
$63,653,695 |
$85,136,106 |
| Jul-2024 |
$79,968,650 |
$68,202,582 |
$94,316,482 |
| Aug-2024 |
$82,993,252 |
$69,869,493 |
$99,306,498 |
| Sep-2024 |
$73,490,538 |
$59,698,859 |
$91,475,550 |
| Oct-2024 |
$30,575,143 |
$25,712,864 |
$36,270,087 |
Economic Indicators
Table 8: Six-Month Forecast of Economic Output from Lodging Sales
| Low Estimate |
$315,293,367 |
$67,637,491 |
$16,953,096 |
$399,883,953 |
| Median Estimate |
$370,928,581 |
$79,572,493 |
$19,944,569 |
$470,445,643 |
| High Estimate |
$439,560,238 |
$94,295,535 |
$23,634,858 |
$557,490,631 |
Table 9: Six-Month Forecast of Employee Compensation from Lodging Sales
| Low Estimate |
$101,976,991 |
$22,820,537 |
$4,641,706 |
$129,439,234 |
| Median Estimate |
$119,971,380 |
$26,847,345 |
$5,460,762 |
$152,279,488 |
| High Estimate |
$142,169,278 |
$31,814,822 |
$6,471,152 |
$180,455,253 |
Table 10: Six-Month Forecast of Contribution to Gross County Product from Lodging
Sales
| Low Estimate |
$228,097,536 |
$39,792,526 |
$10,220,450 |
$278,110,513 |
| Median Estimate |
$268,346,576 |
$46,814,133 |
$12,023,909 |
$327,184,618 |
| High Estimate |
$317,997,833 |
$55,476,002 |
$14,248,659 |
$387,722,494 |
Table 11: Six-Month Forecast of Employment from Lodging Sales
| Low Estimate |
4,006 |
640 |
175 |
4,822 |
| Median Estimate |
4,713 |
753 |
206 |
5,673 |
| High Estimate |
5,585 |
893 |
245 |
6,722 |
