Jackson Hole Economic Forecasting
November 2024 Forecast
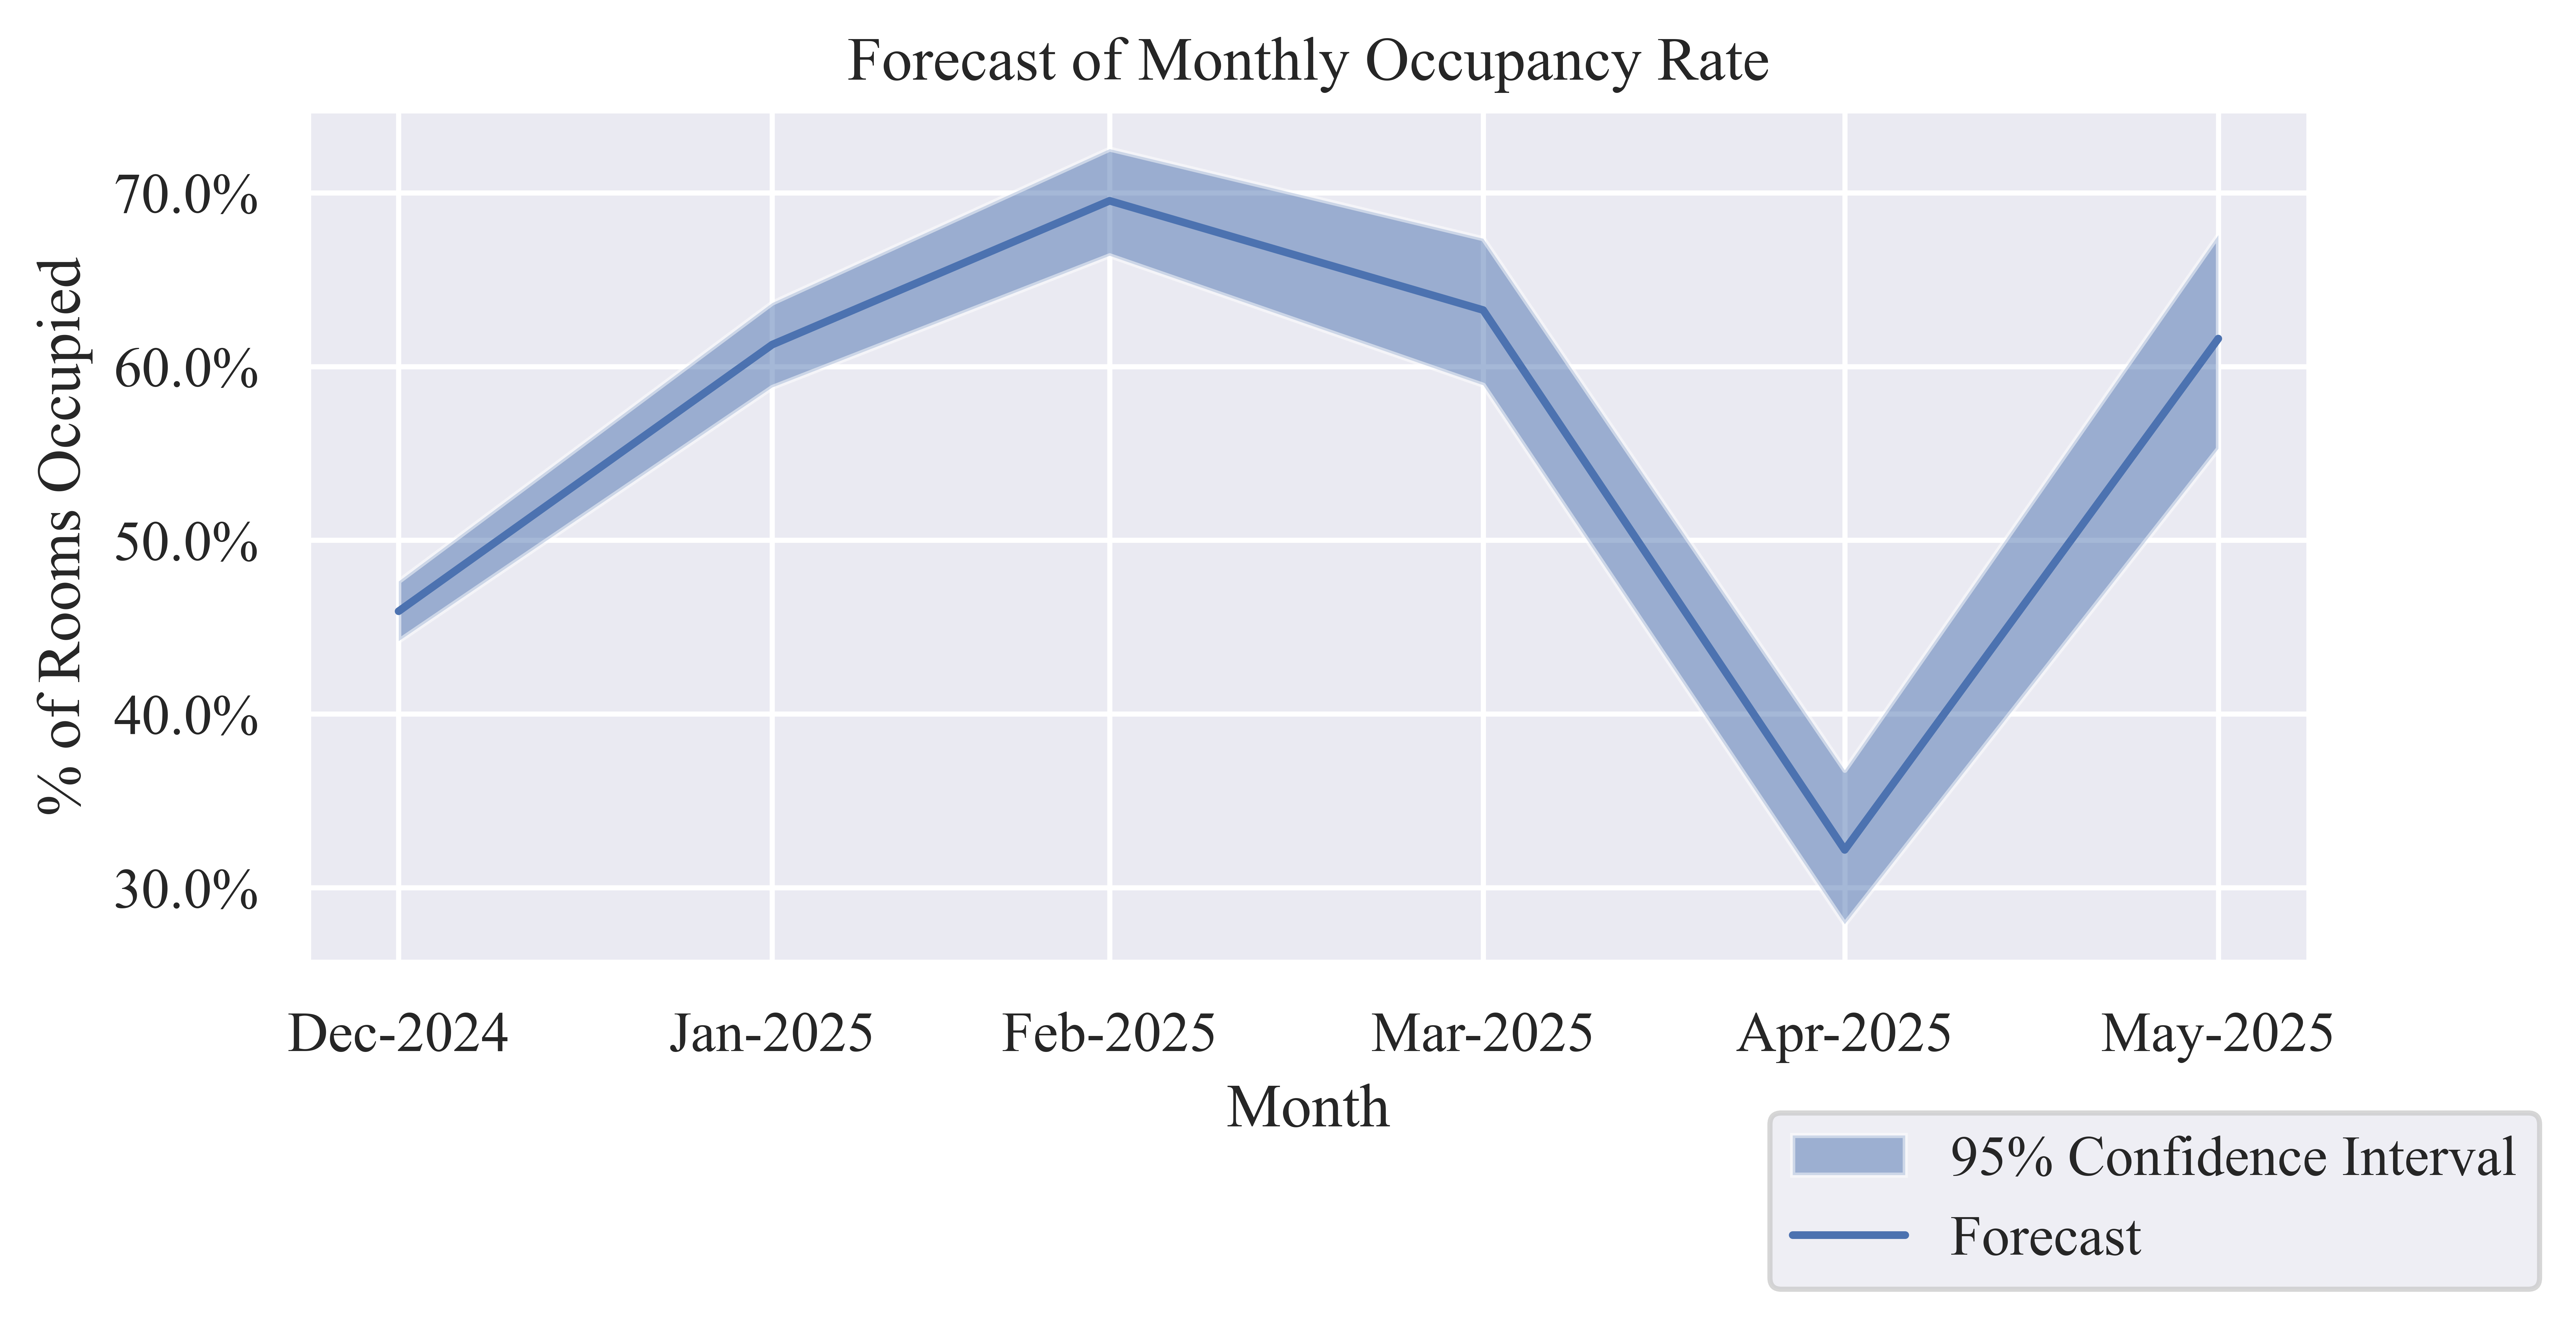
Occupancy Rate (OR)
Table 1: Forecast of Monthly Occupancy Rate
| Dec-2024 |
45.91% |
44.20% |
47.63% |
| Jan-2025 |
61.26% |
58.80% |
63.66% |
| Feb-2025 |
69.54% |
66.38% |
72.52% |
| Mar-2025 |
63.25% |
58.93% |
67.36% |
| Apr-2025 |
32.18% |
27.91% |
36.77% |
| May-2025 |
61.60% |
55.27% |
67.57% |
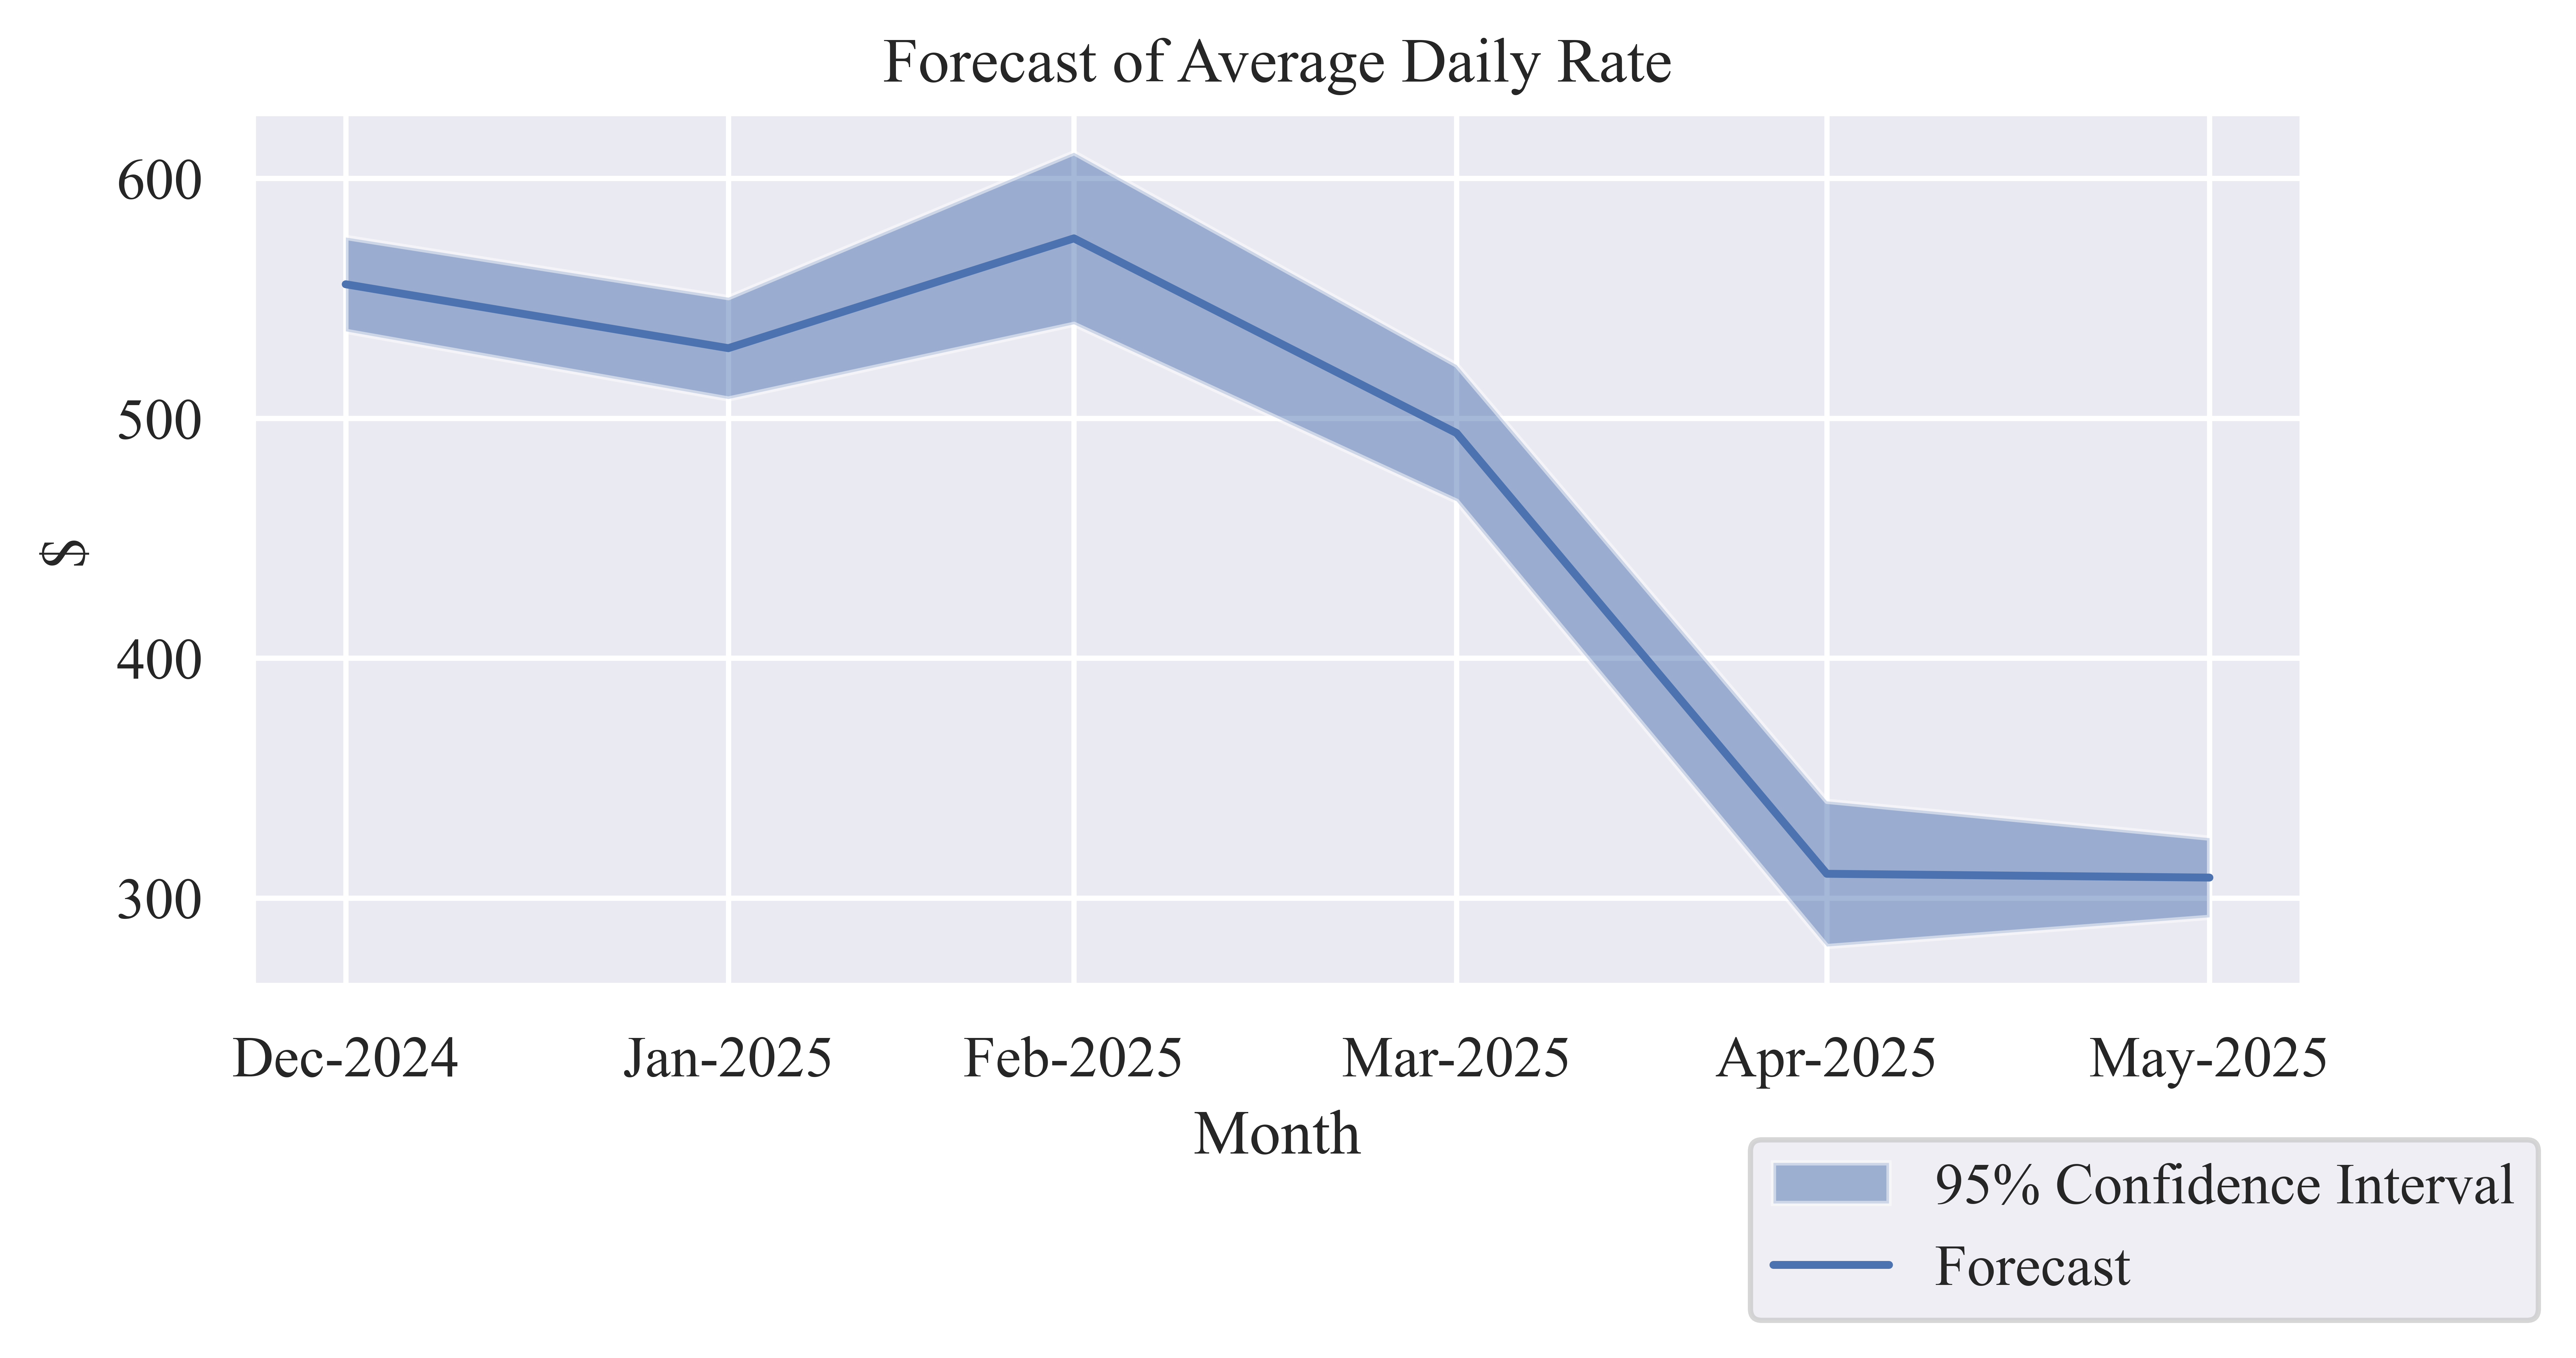
Average Daily Rate (ADR)
Table 2: Forecast of Monthly Average Daily Rate
| Dec-2024 |
$555.88 |
$536.31 |
$575.44 |
| Jan-2025 |
$529.23 |
$508.11 |
$550.35 |
| Feb-2025 |
$575.01 |
$539.25 |
$610.78 |
| Mar-2025 |
$493.85 |
$465.47 |
$522.23 |
| Apr-2025 |
$310.10 |
$279.83 |
$340.37 |
| May-2025 |
$308.52 |
$292.00 |
$325.03 |
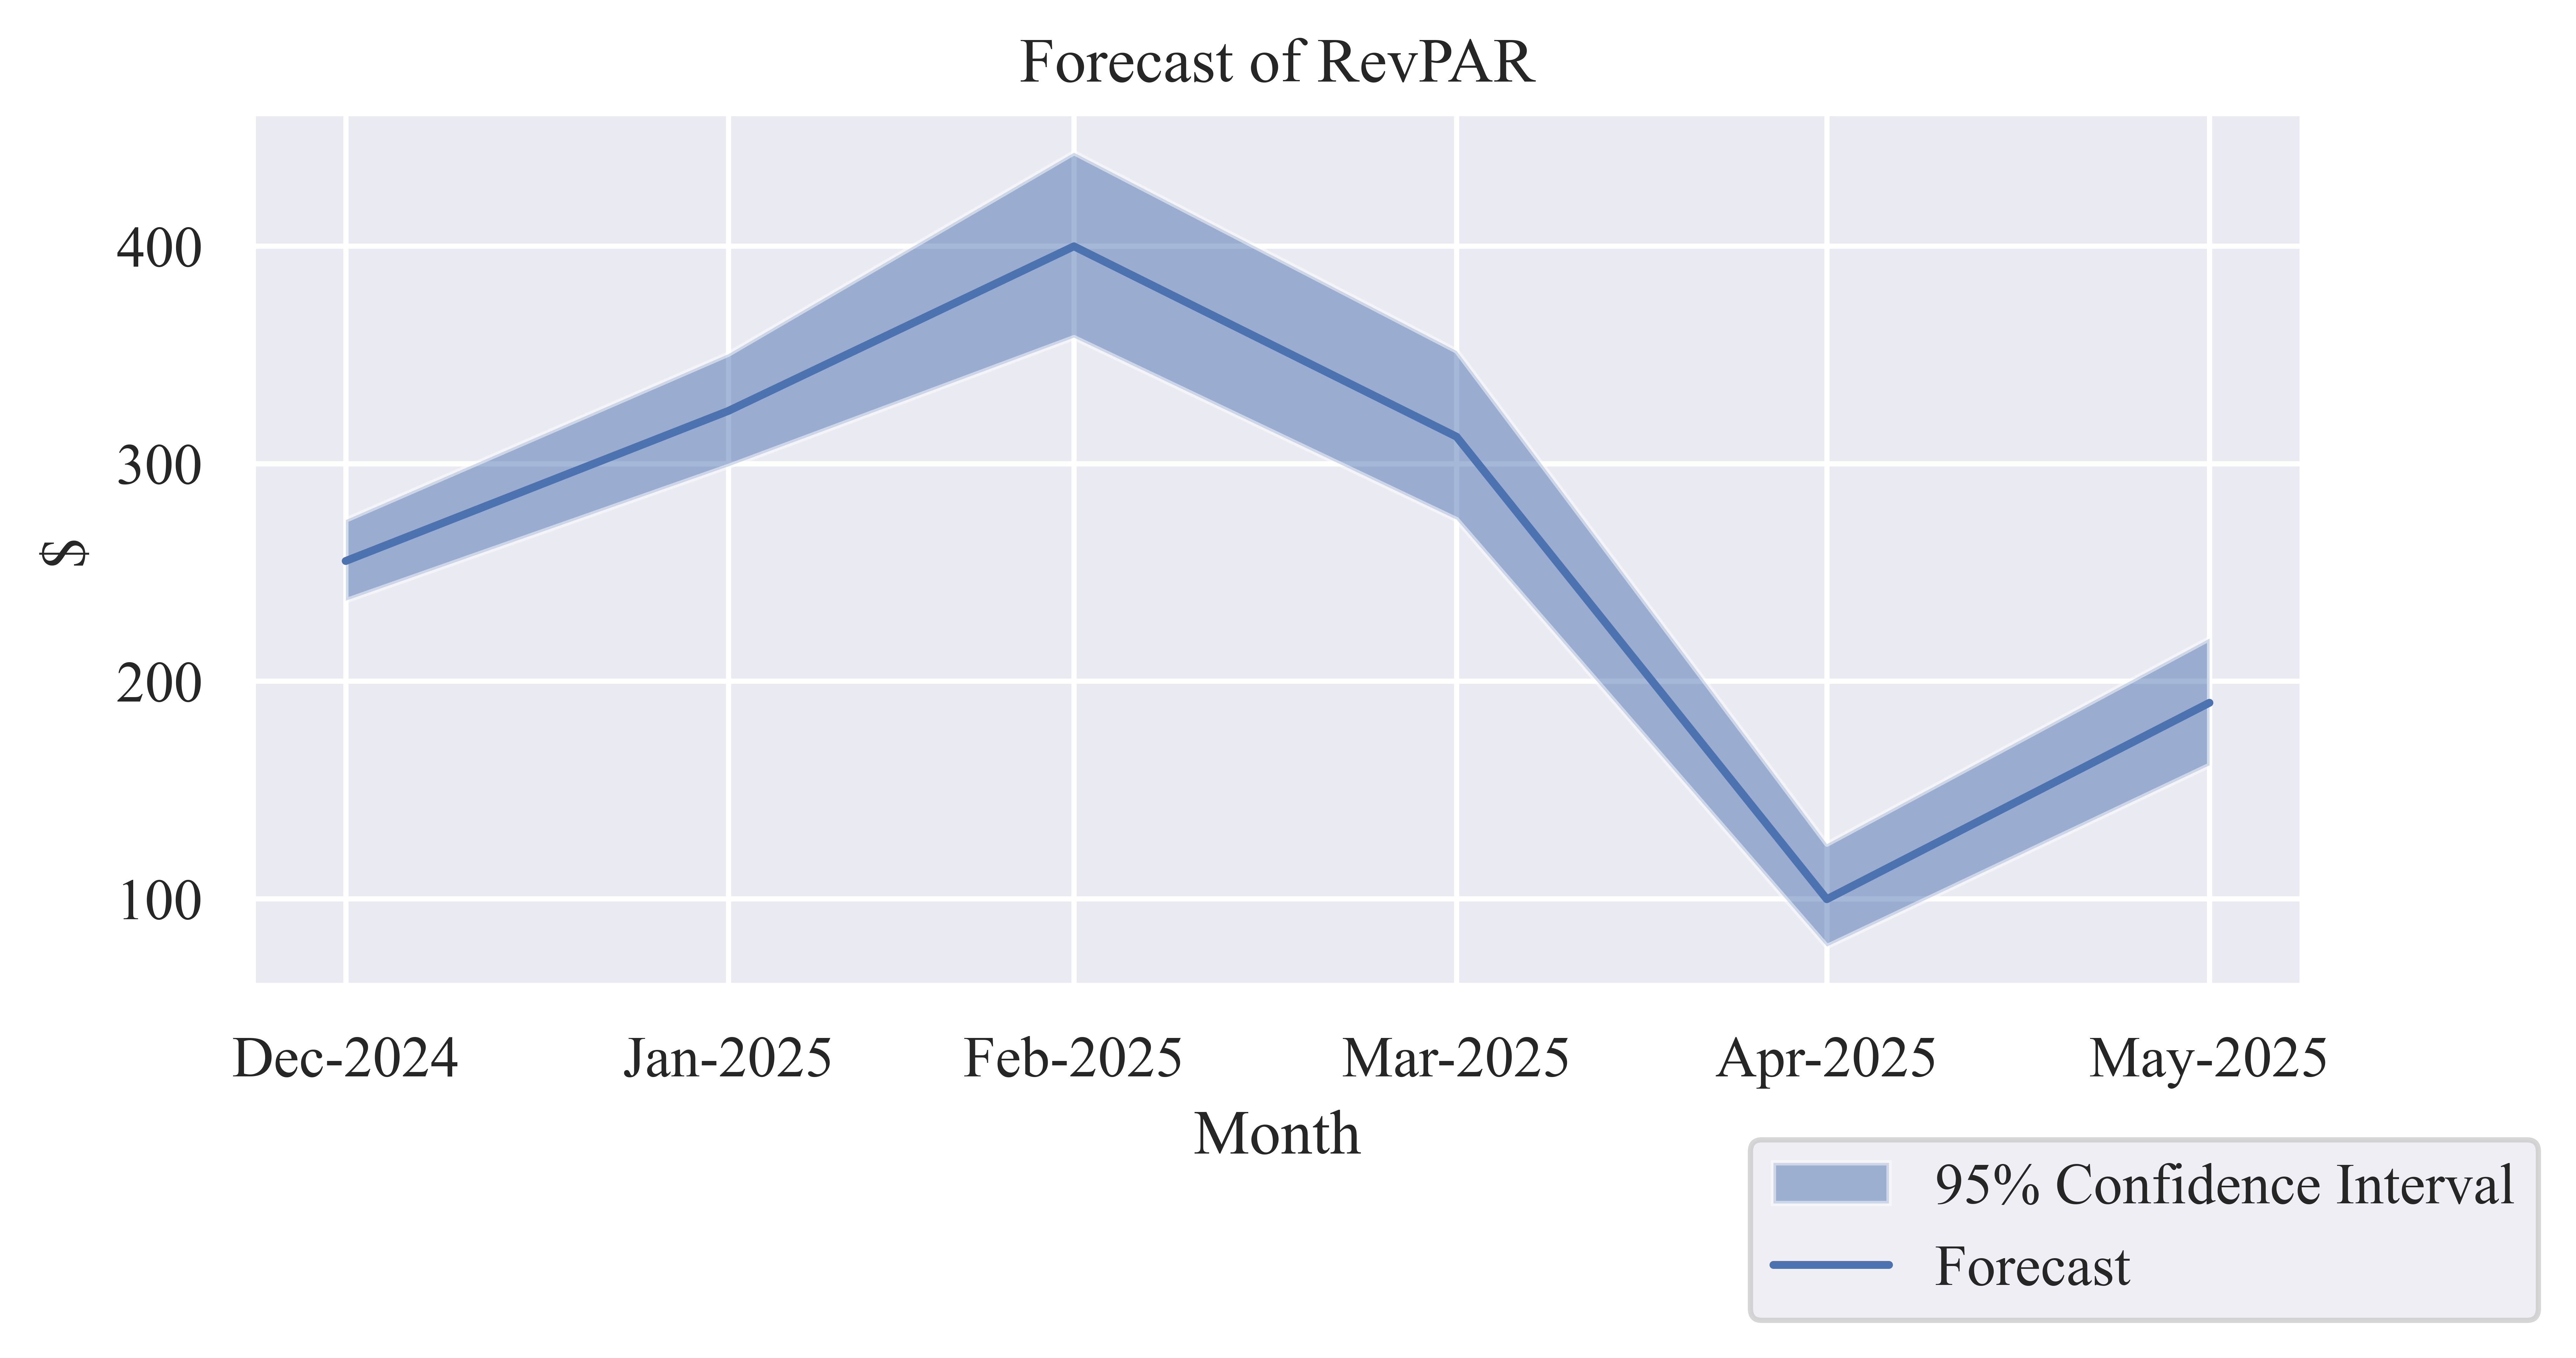
Revenue per Available Room (RevPAR)
Table 3: Forecast of Monthly RevPAR
| Dec-2024 |
$255.22 |
$237.06 |
$274.10 |
| Jan-2025 |
$324.20 |
$298.78 |
$350.35 |
| Feb-2025 |
$399.85 |
$357.96 |
$442.94 |
| Mar-2025 |
$312.35 |
$274.30 |
$351.79 |
| Apr-2025 |
$99.78 |
$78.09 |
$125.15 |
| May-2025 |
$190.06 |
$161.39 |
$219.62 |
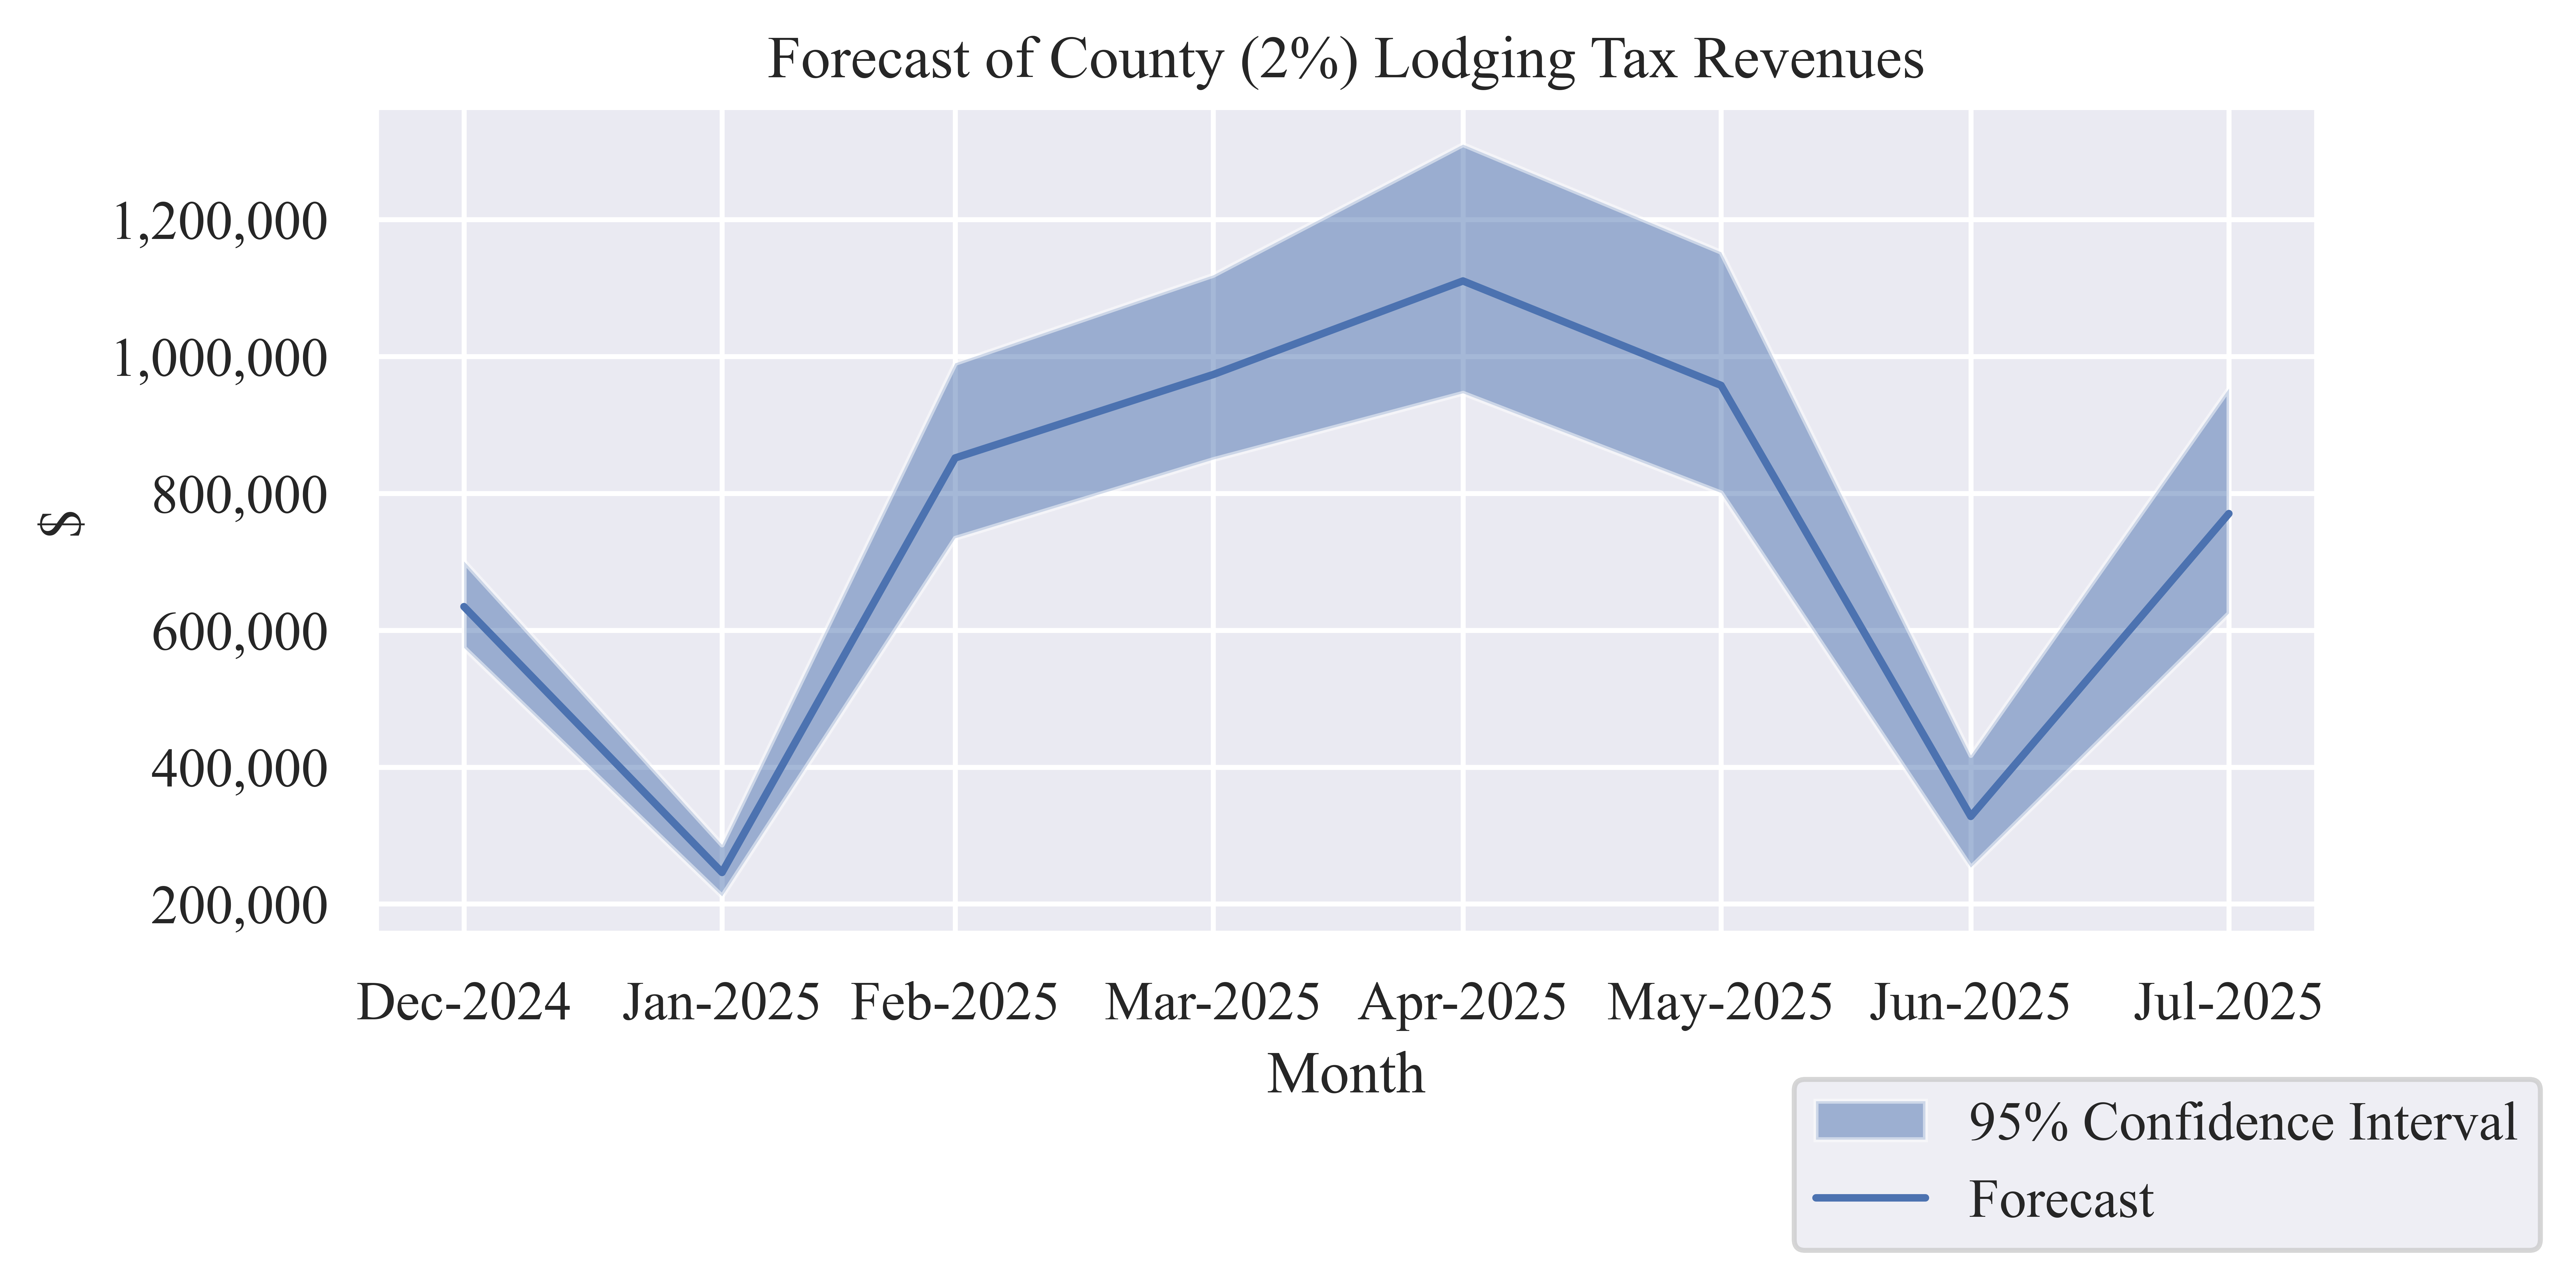
Tax Revenues
Table 4: Forecast County (2%) Lodging Tax Revenue
| Dec-2024 |
$634,540 |
$574,574 |
$700,765 |
| Jan-2025 |
$246,100 |
$211,394 |
$286,504 |
| Feb-2025 |
$851,758 |
$734,539 |
$990,211 |
| Mar-2025 |
$973,654 |
$849,539 |
$1,118,807 |
| Apr-2025 |
$1,110,403 |
$946,425 |
$1,309,804 |
| May-2025 |
$957,834 |
$800,820 |
$1,152,613 |
| Jun-2025 |
$328,008 |
$253,394 |
$417,302 |
| Jul-2025 |
$770,499 |
$624,806 |
$953,269 |
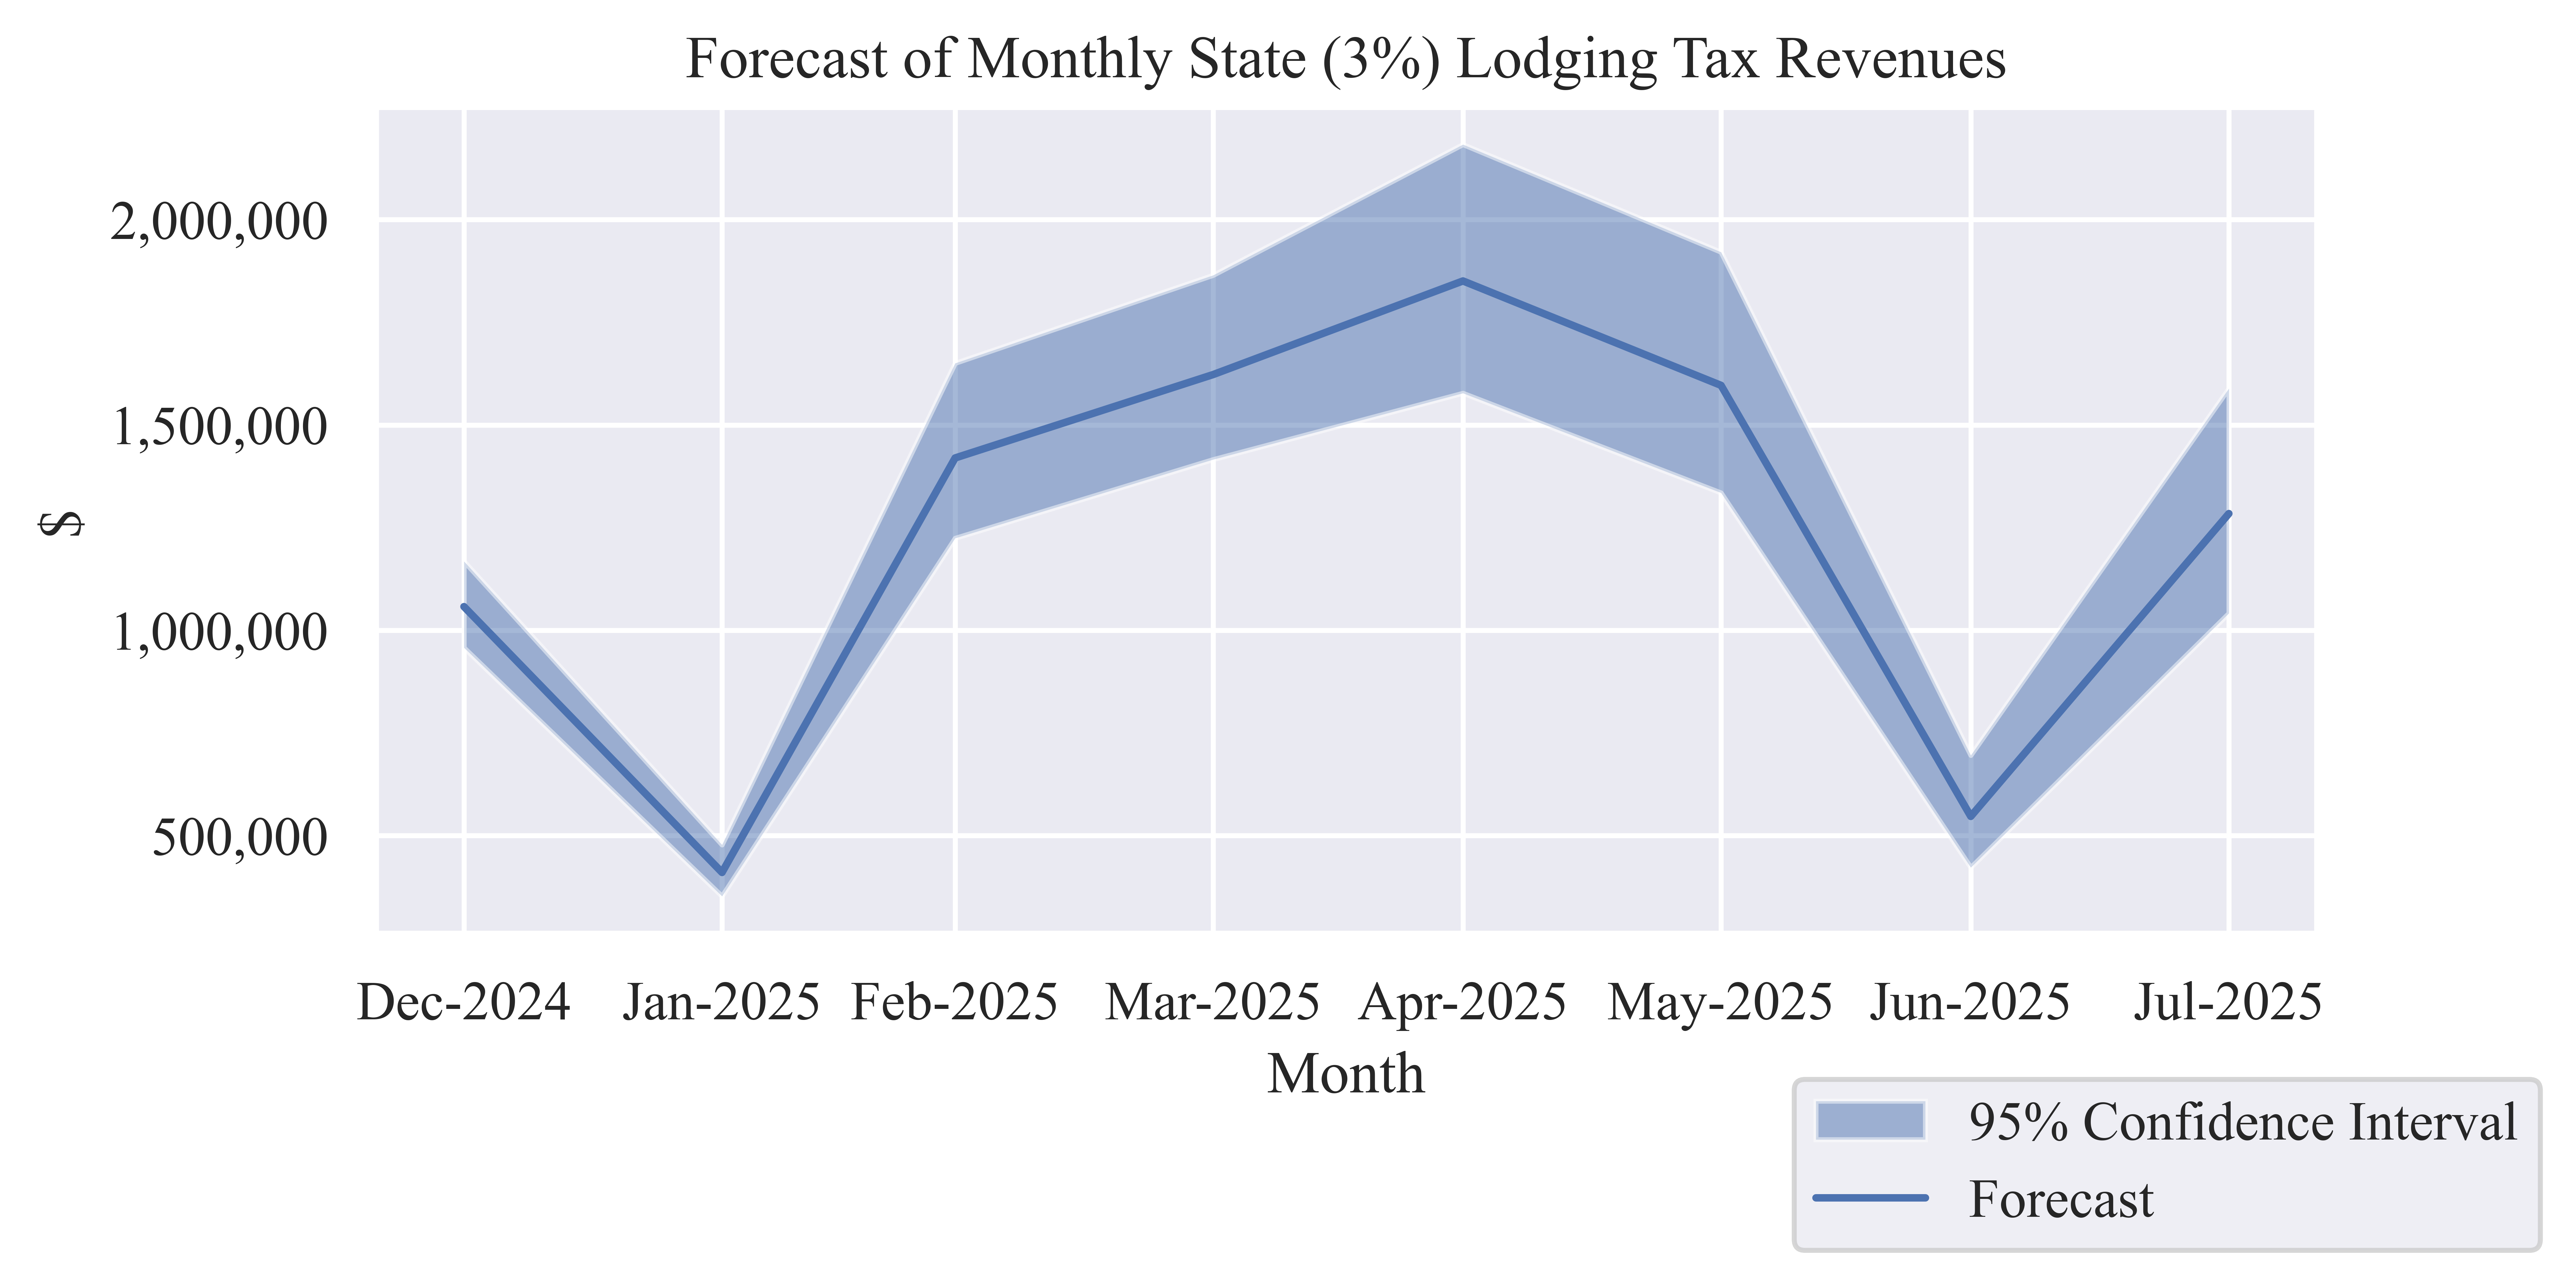
Table 5: Forecast State (3%) Lodging Tax Revenue
| Dec-2024 |
$1,057,567 |
$957,623 |
$1,167,942 |
| Jan-2025 |
$410,167 |
$352,324 |
$477,506 |
| Feb-2025 |
$1,419,597 |
$1,224,232 |
$1,650,351 |
| Mar-2025 |
$1,622,756 |
$1,415,899 |
$1,864,678 |
| Apr-2025 |
$1,850,671 |
$1,577,376 |
$2,183,007 |
| May-2025 |
$1,596,389 |
$1,334,699 |
$1,921,021 |
| Jun-2025 |
$546,680 |
$422,323 |
$695,504 |
| Jul-2025 |
$1,284,165 |
$1,041,343 |
$1,588,781 |
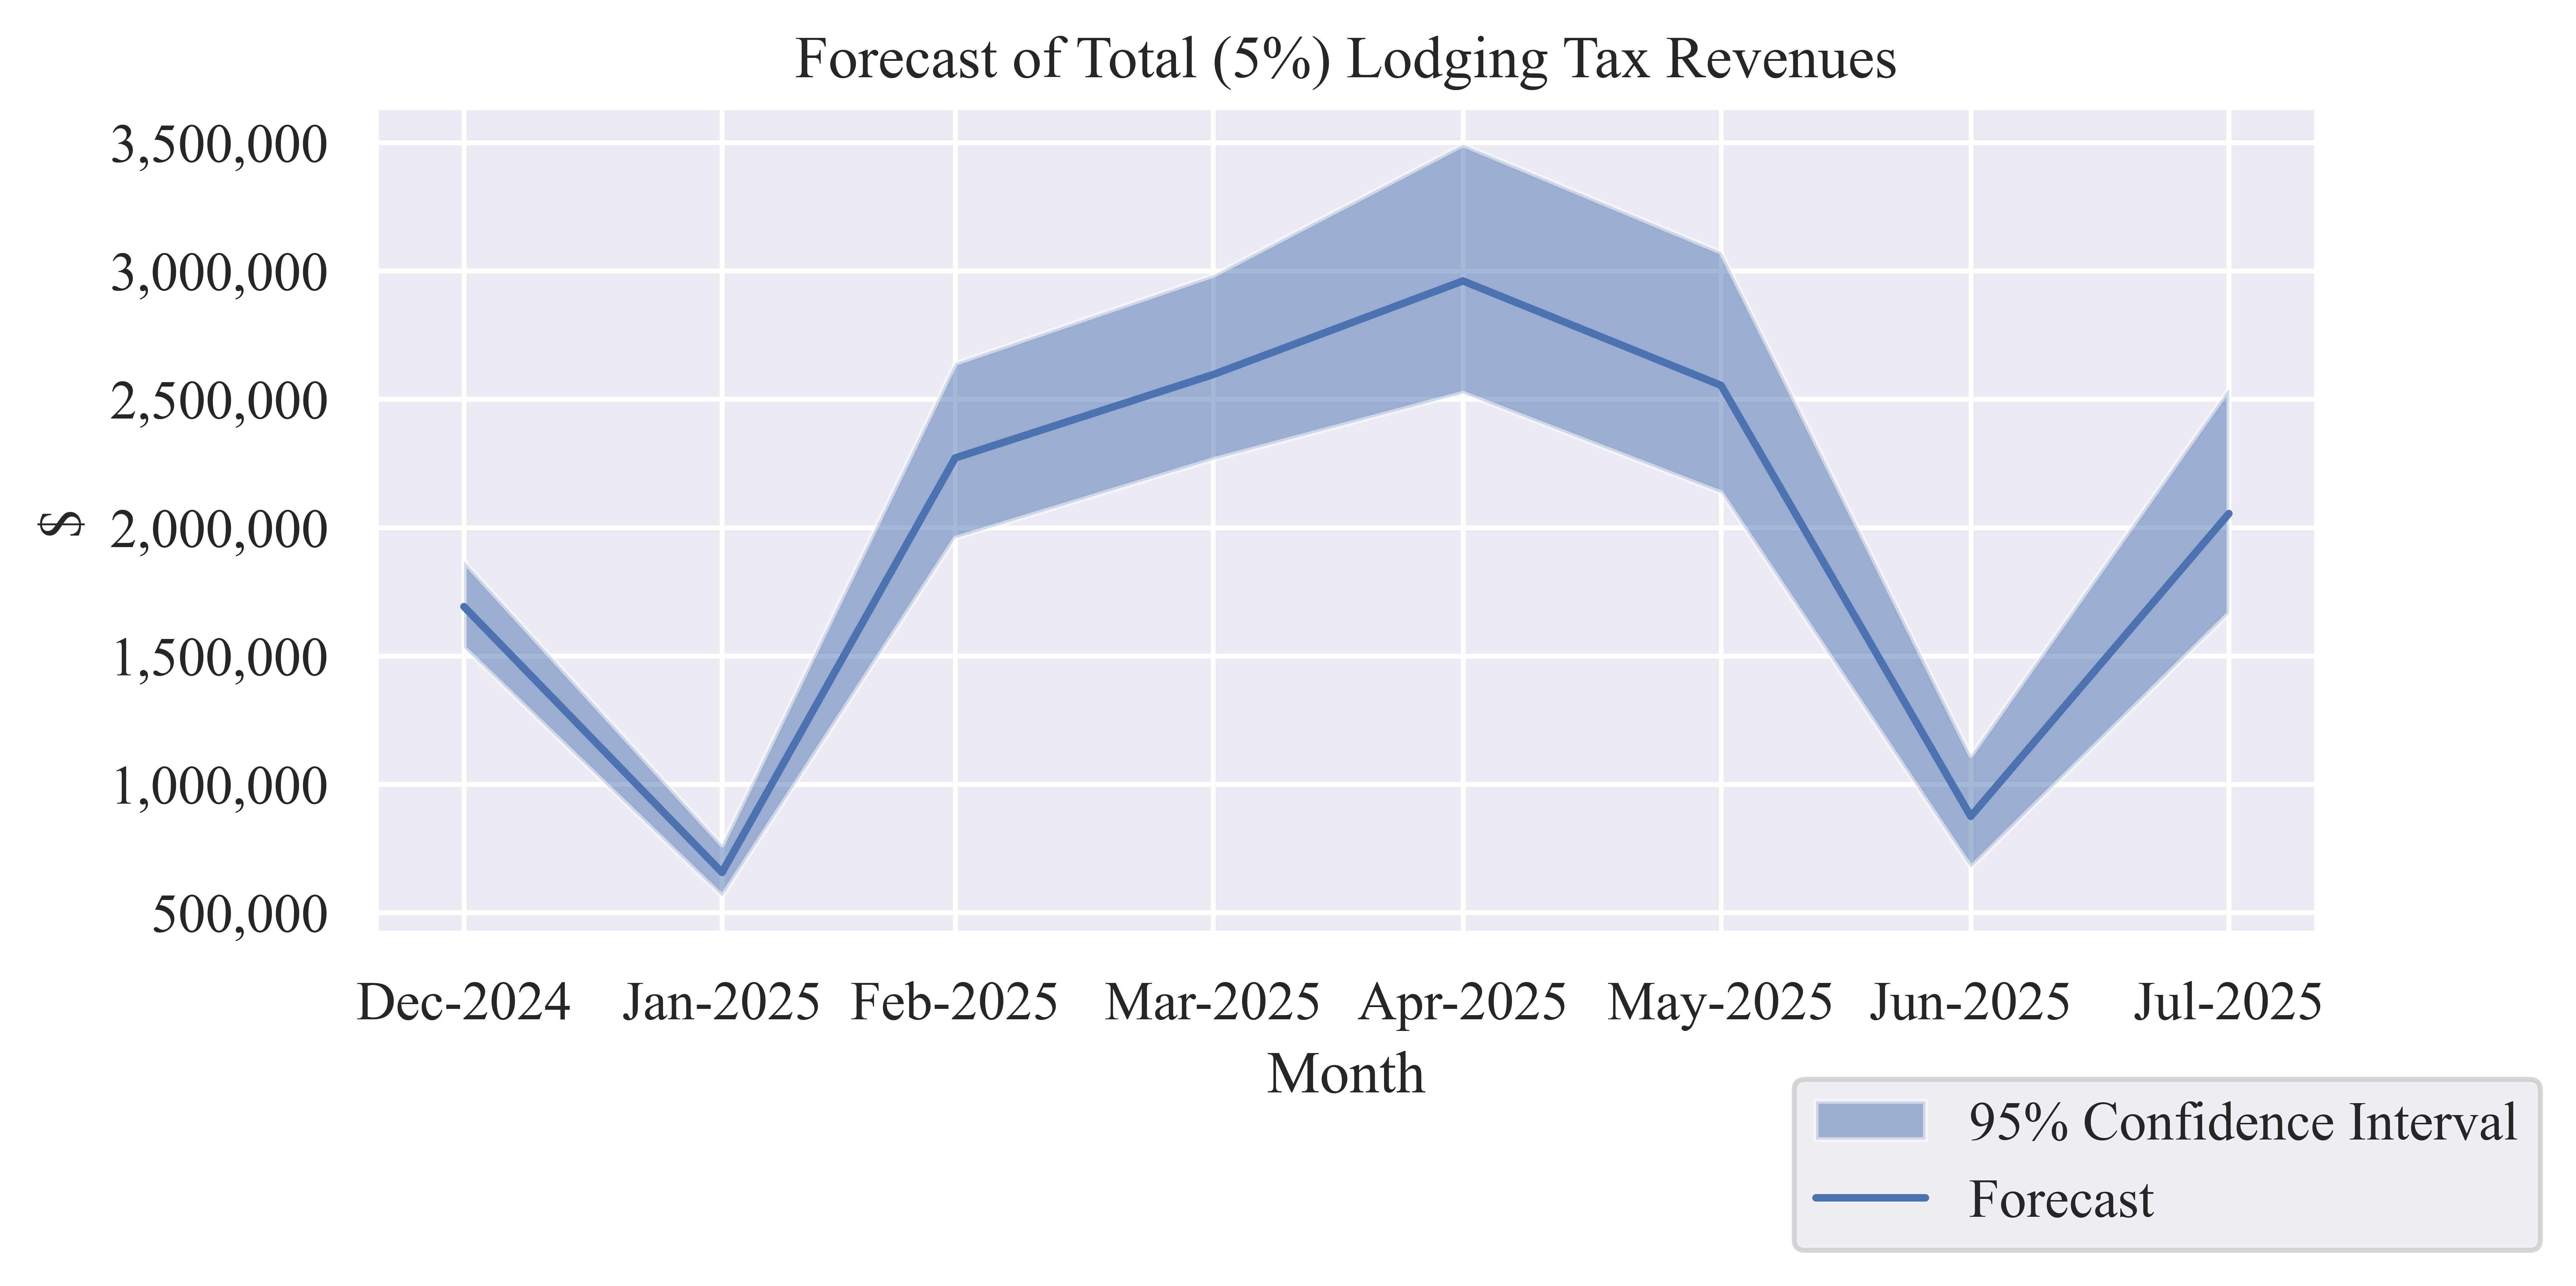
Table 6: Forecast of Monthly Total (5%) Lodging Tax Revenue
| Dec-2024 |
$1,692,107 |
$1,532,197 |
$1,868,707 |
| Jan-2025 |
$656,267 |
$563,718 |
$764,009 |
| Feb-2025 |
$2,271,356 |
$1,958,772 |
$2,640,562 |
| Mar-2025 |
$2,596,410 |
$2,265,438 |
$2,983,484 |
| Apr-2025 |
$2,961,073 |
$2,523,801 |
$3,492,811 |
| May-2025 |
$2,554,223 |
$2,135,519 |
$3,073,634 |
| Jun-2025 |
$874,688 |
$675,718 |
$1,112,806 |
| Jul-2025 |
$2,054,664 |
$1,666,148 |
$2,542,049 |
Lodging Sector Sales
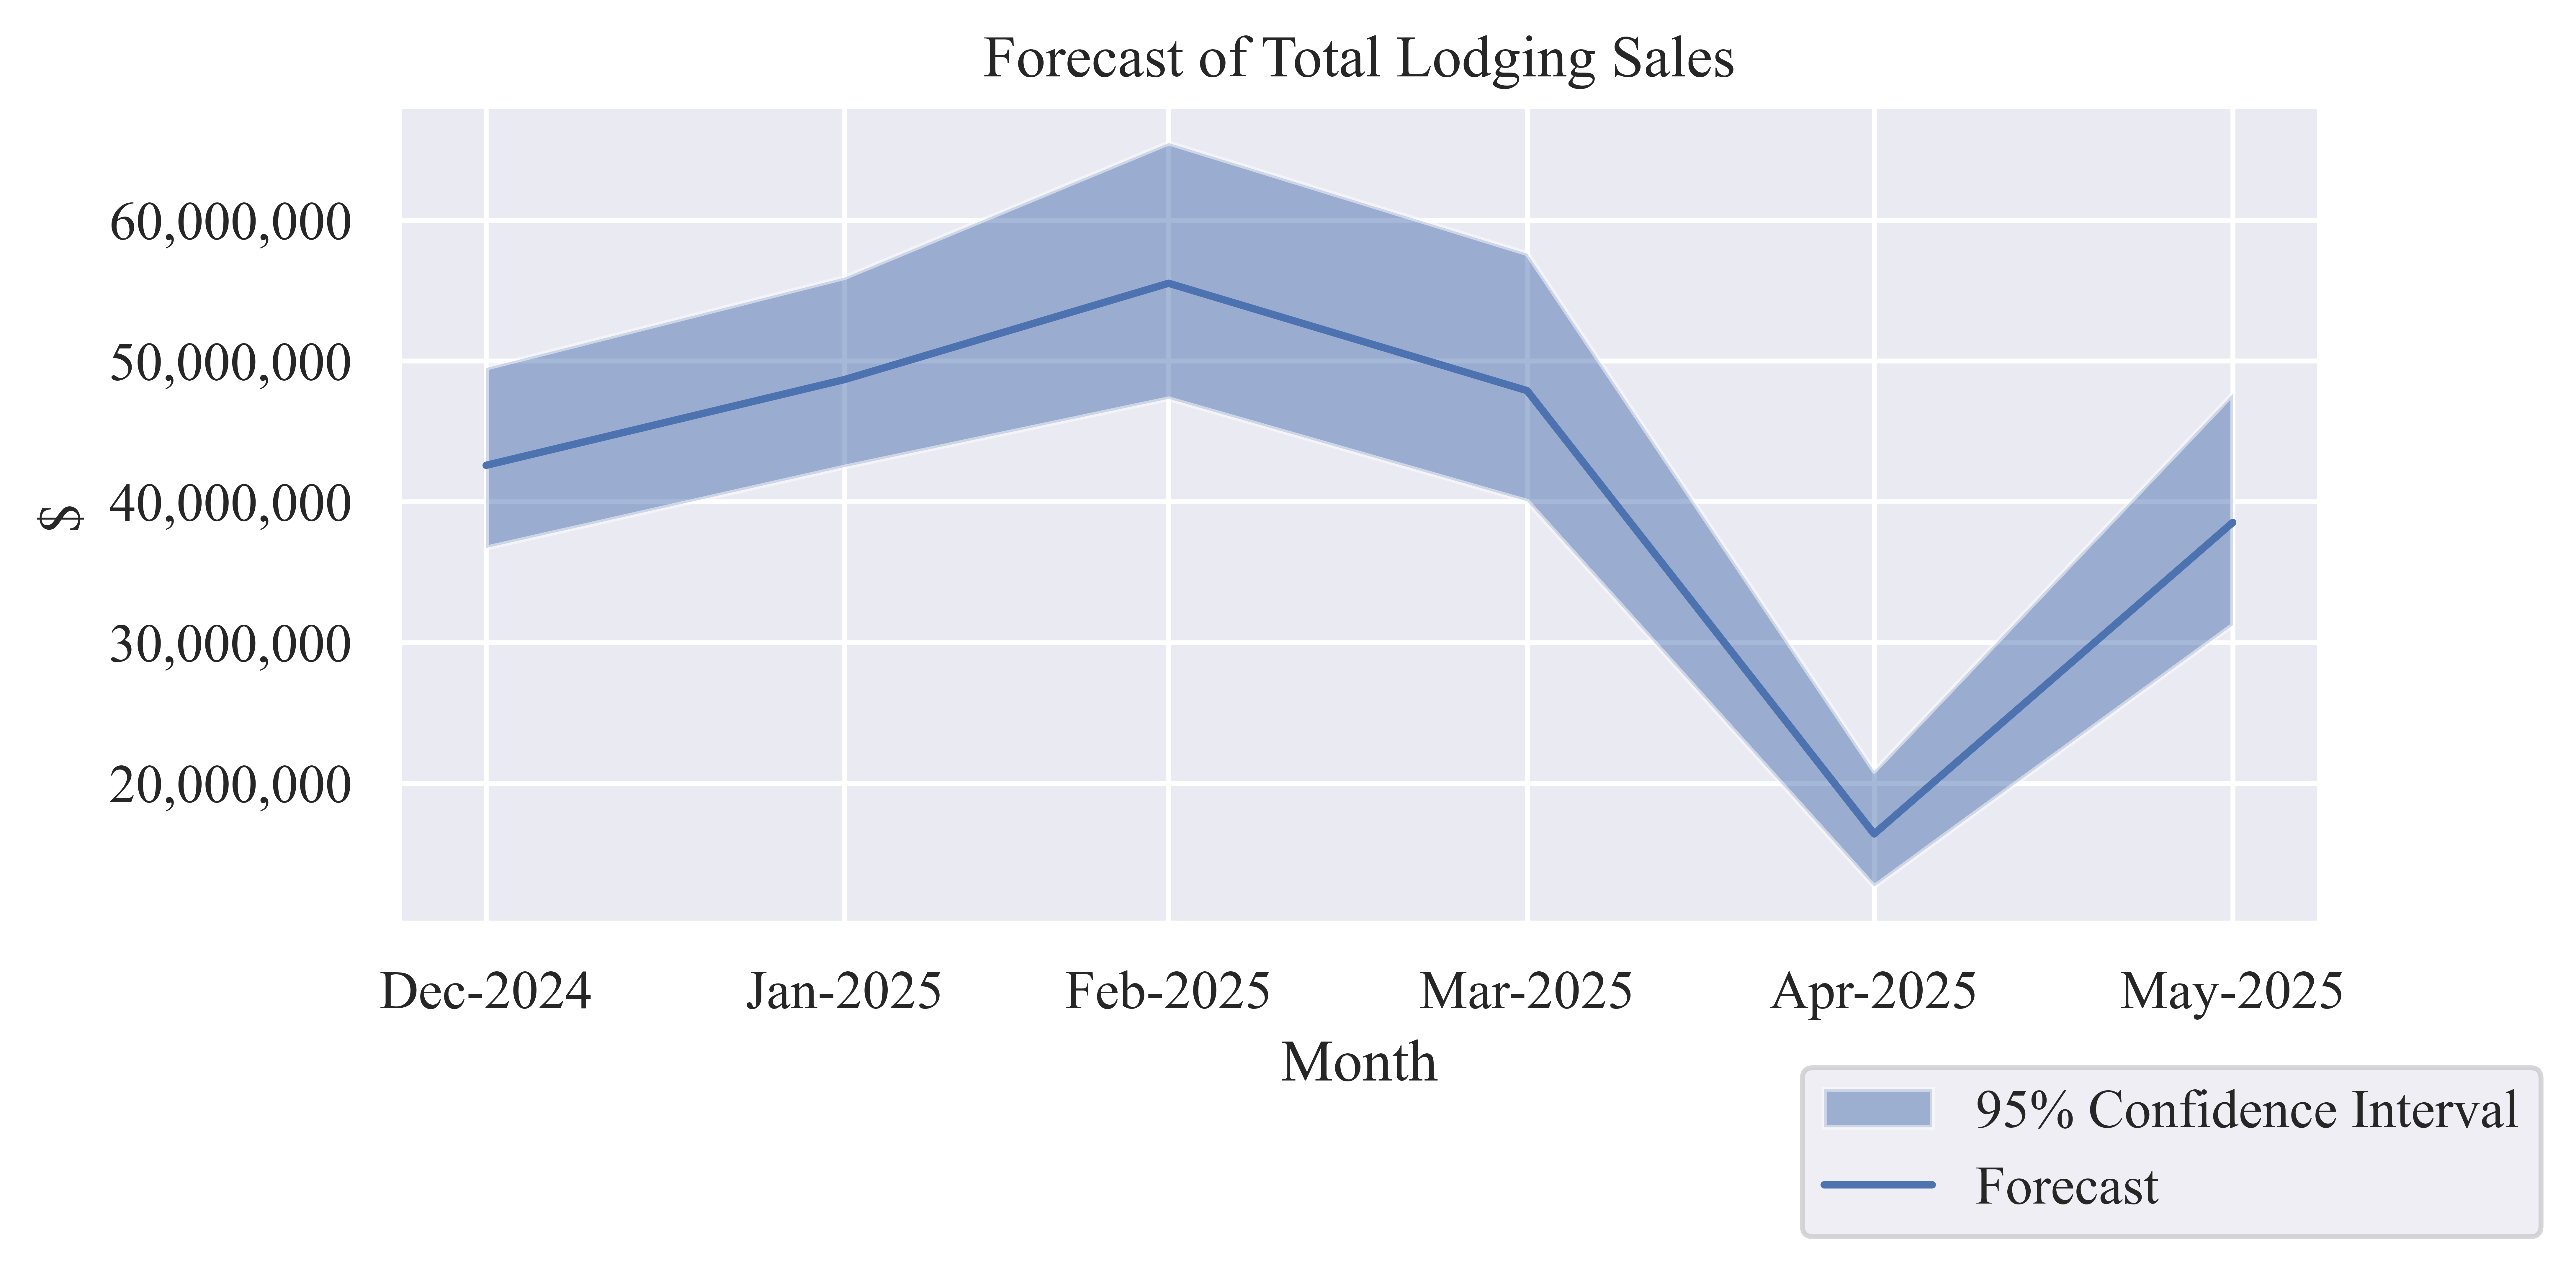
Table 7: Forecast of Monthly Lodging Sales
| Dec-2024 |
$42,587,916 |
$36,726,969 |
$49,510,540 |
| Jan-2025 |
$48,682,679 |
$42,476,960 |
$55,940,331 |
| Feb-2025 |
$55,520,127 |
$47,321,270 |
$65,490,214 |
| Mar-2025 |
$47,891,679 |
$40,040,977 |
$57,630,638 |
| Apr-2025 |
$16,400,396 |
$12,669,705 |
$20,865,114 |
| May-2025 |
$38,524,949 |
$31,240,275 |
$47,663,426 |
Economic Indicators
Table 8: Six-Month Forecast of Economic Output from Lodging Sales
| Low Estimate |
$210,476,157 |
$45,419,762 |
$11,430,343 |
$267,326,263 |
| Median Estimate |
$249,607,746 |
$53,864,175 |
$13,555,465 |
$317,027,386 |
| High Estimate |
$297,100,262 |
$64,112,840 |
$16,134,656 |
$377,347,758 |
Table 9: Six-Month Forecast of Employee Compensation from Lodging Sales
| Low Estimate |
$68,075,410 |
$15,303,567 |
$3,153,180 |
$86,532,156 |
| Median Estimate |
$80,731,945 |
$18,148,796 |
$3,739,417 |
$102,620,158 |
| High Estimate |
$96,092,699 |
$21,601,943 |
$4,450,913 |
$122,145,556 |
Table 10: Six-Month Forecast of Contribution to Gross County Product from Lodging
Sales
| Low Estimate |
$152,268,008 |
$26,693,531 |
$6,895,554 |
$185,857,093 |
| Median Estimate |
$180,577,576 |
$31,656,374 |
$8,177,571 |
$220,411,521 |
| High Estimate |
$214,935,818 |
$37,679,590 |
$9,733,513 |
$262,348,922 |
Table 11: Six-Month Forecast of Employment from Lodging Sales
| Low Estimate |
2,674 |
429 |
119 |
3,223 |
| Median Estimate |
3,172 |
509 |
141 |
3,822 |
| High Estimate |
3,775 |
606 |
168 |
4,549 |
