Jackson Hole Economic Forecasting
May 2024 Forecast
Occupancy Rate (OR)
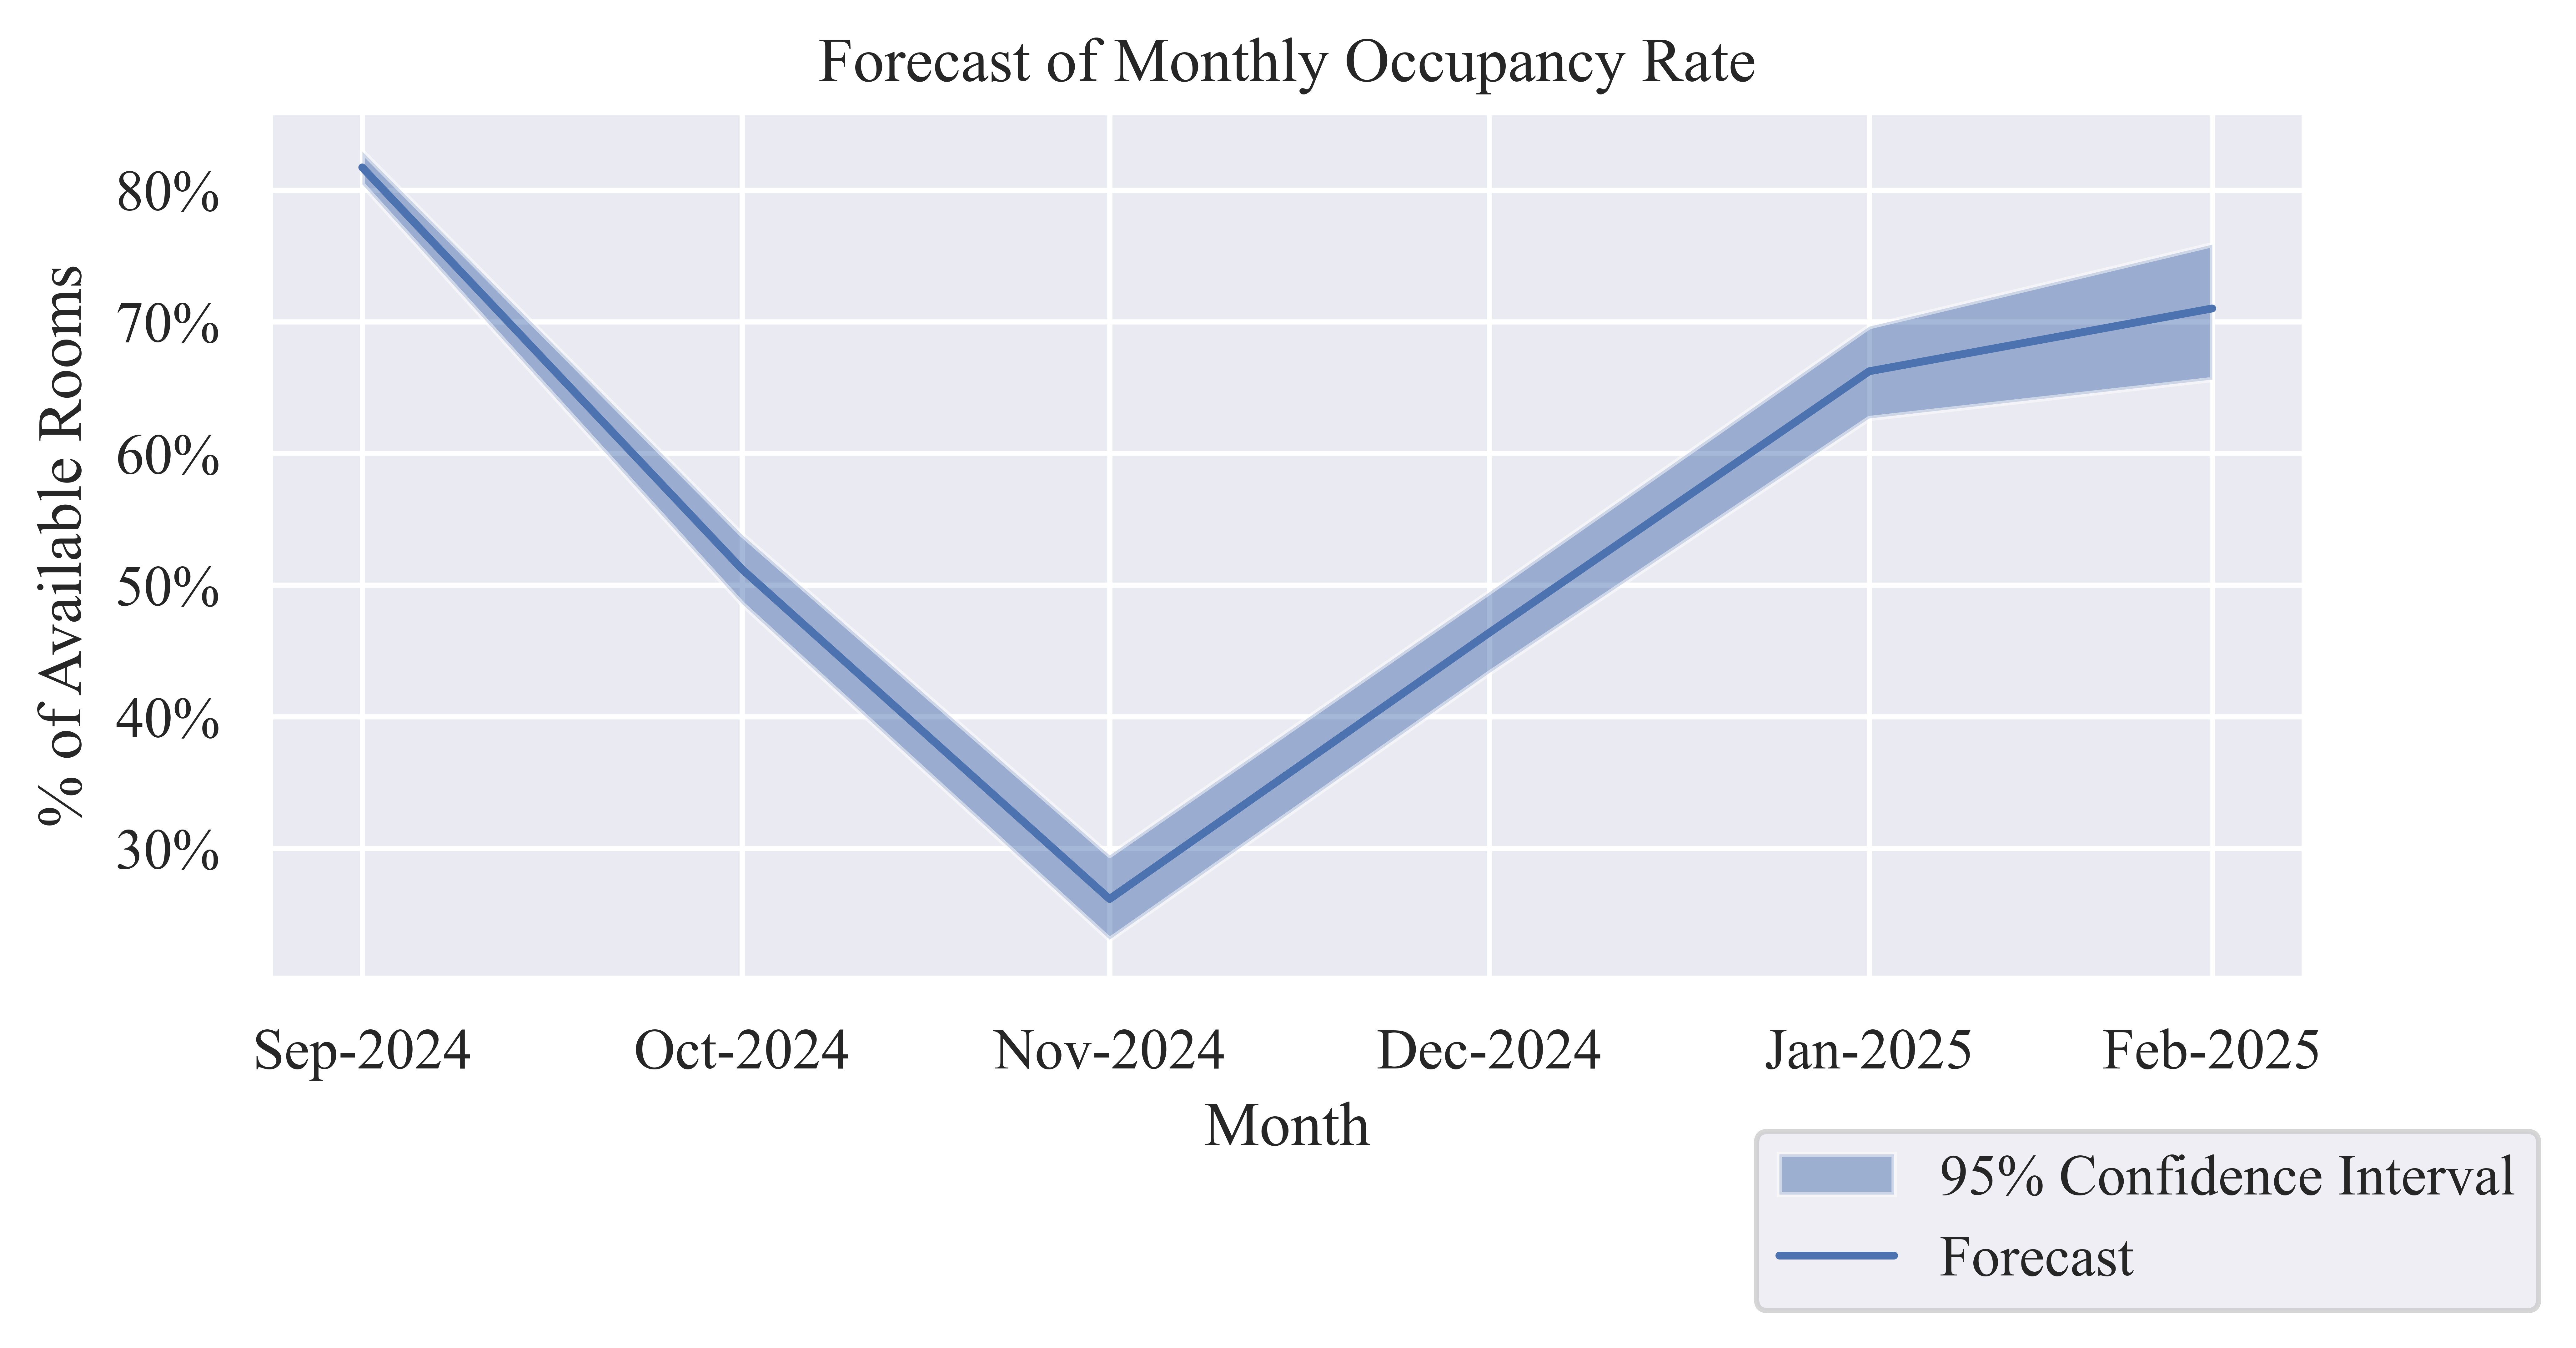
Table 1: Forecast of Monthly Occupancy Rate
| Sep-2024 |
81.72% |
80.44% |
82.93% |
| Oct-2024 |
51.20% |
48.57% |
53.83% |
| Nov-2024 |
26.15% |
23.09% |
29.47% |
| Dec-2024 |
46.38% |
43.33% |
49.46% |
| Jan-2025 |
66.23% |
62.66% |
69.63% |
| Feb-2025 |
71.00% |
65.61% |
75.86% |
Average Daily Rate (ADR)
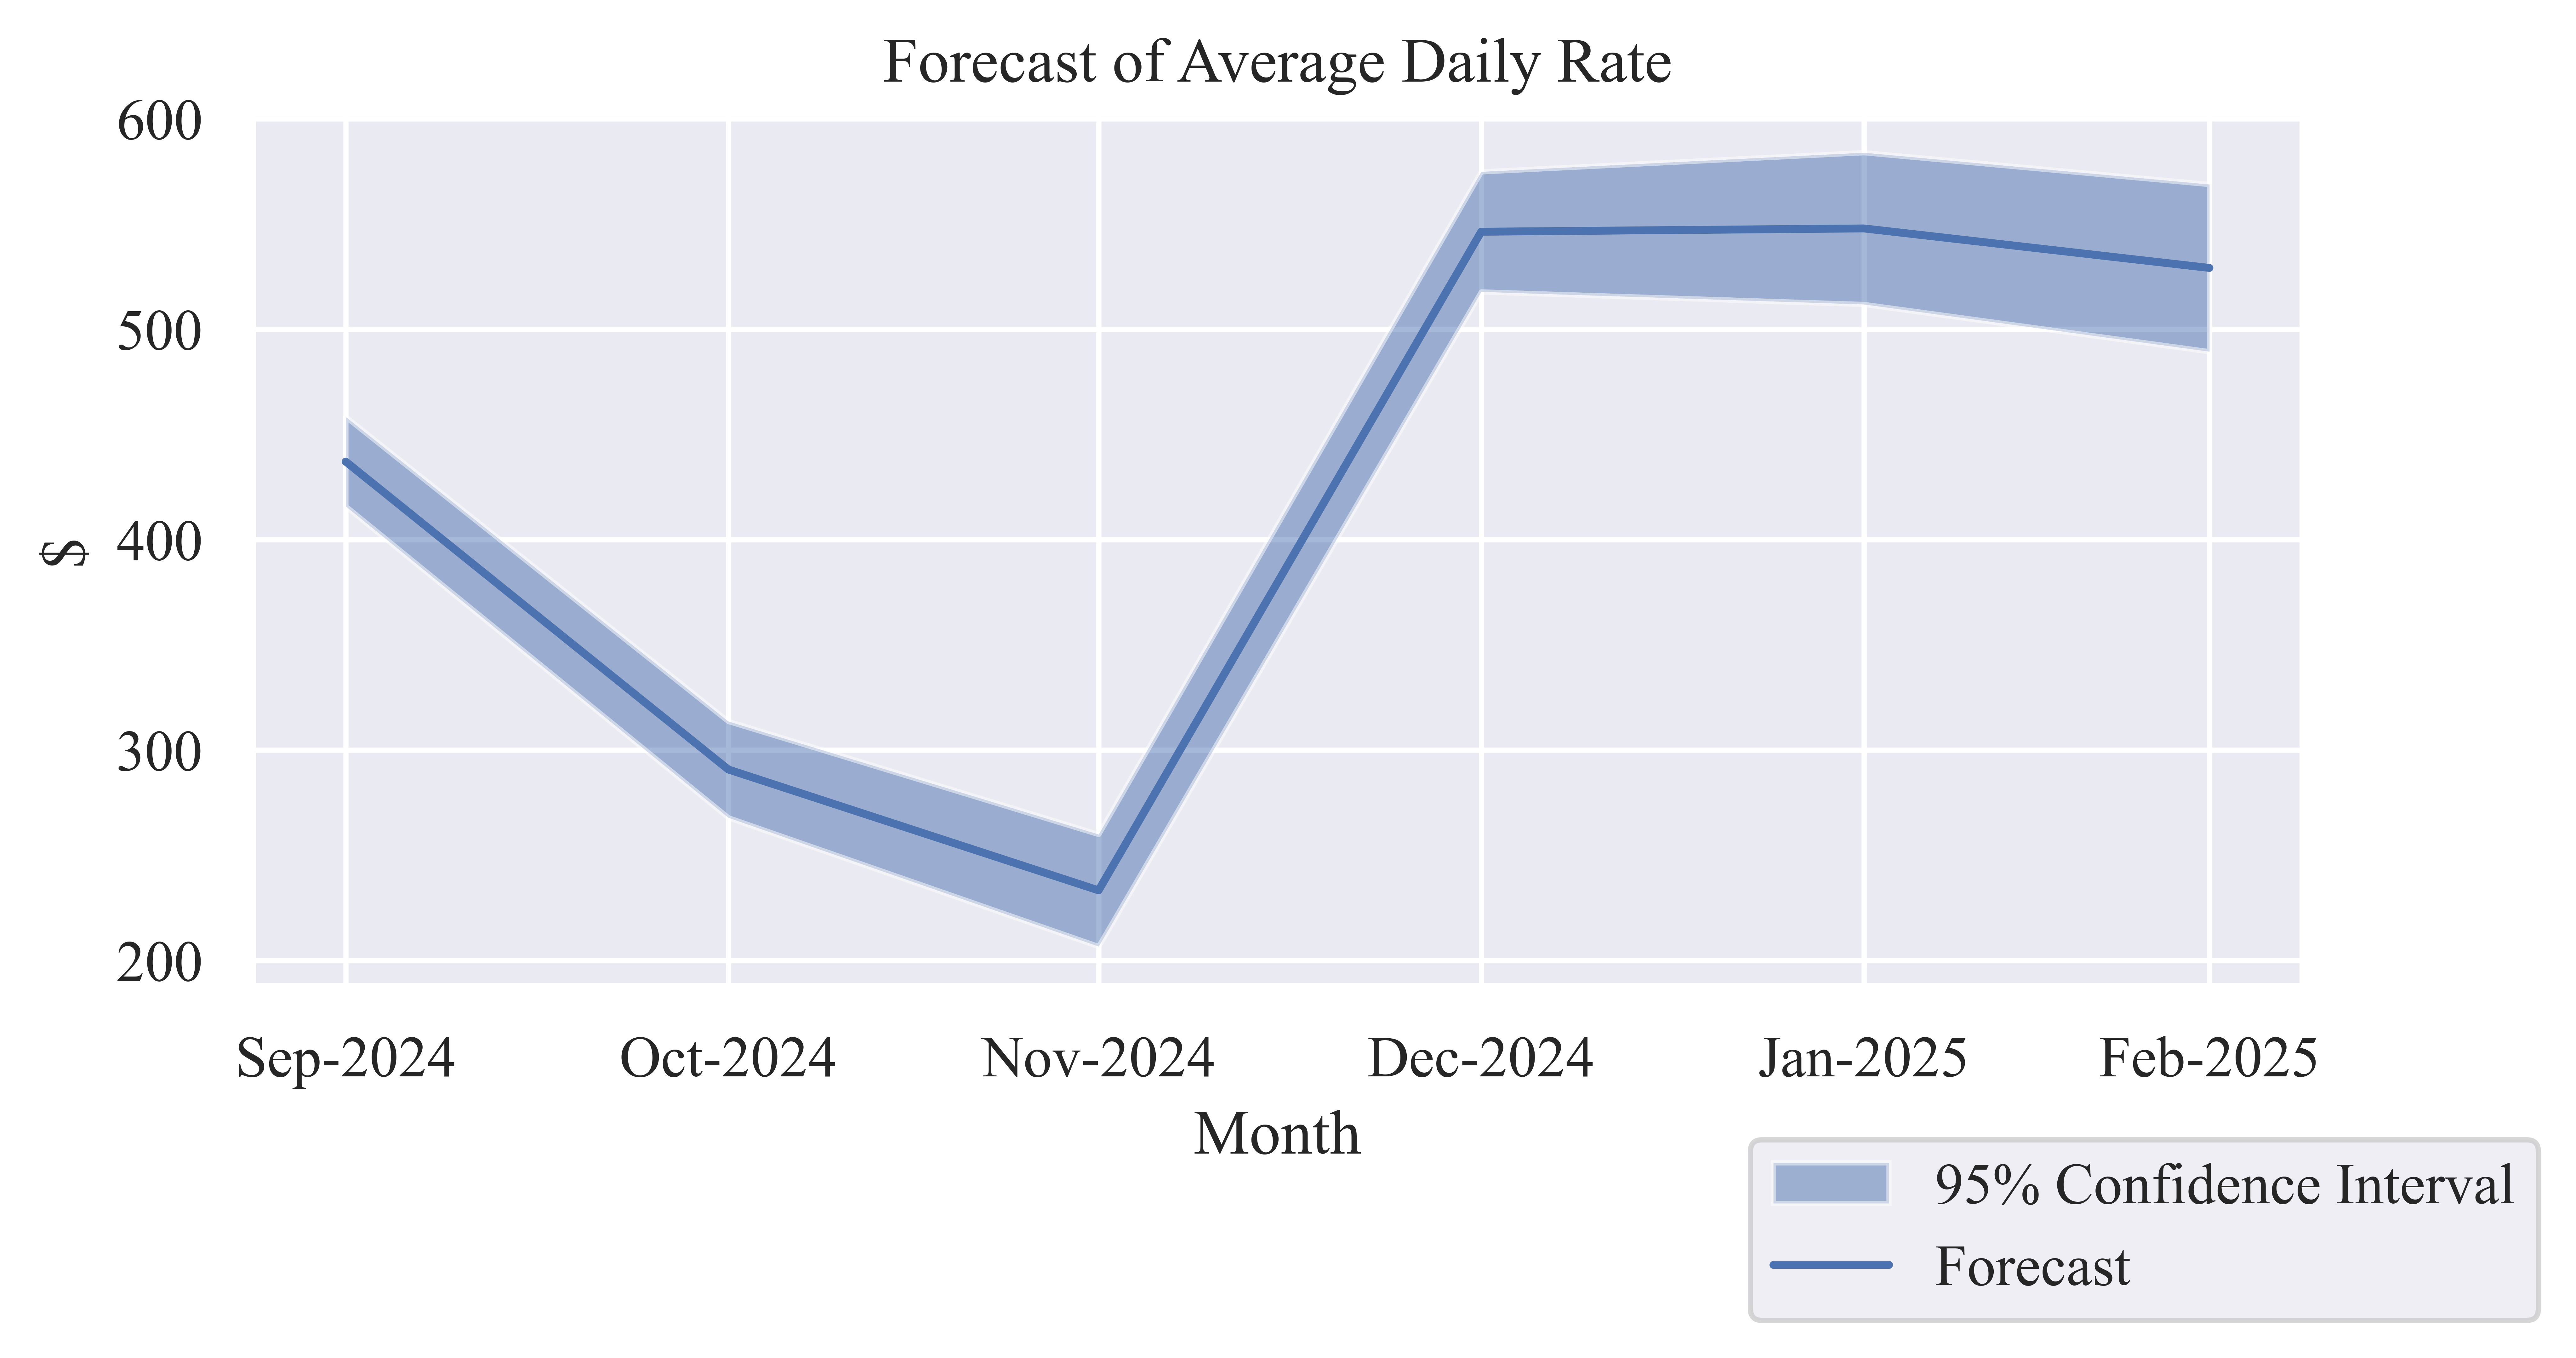
Table 2: Forecast of Monthly Average Daily Rate
| Sep-2024 |
$437.16 |
$415.92 |
$458.40 |
| Oct-2024 |
$290.83 |
$267.94 |
$313.71 |
| Nov-2024 |
$233.39 |
$206.76 |
$260.02 |
| Dec-2024 |
$546.39 |
$517.86 |
$574.91 |
| Jan-2025 |
$547.95 |
$511.90 |
$584.01 |
| Feb-2025 |
$529.19 |
$489.46 |
$568.91 |
Revenue per Available Room (RevPAR)
Table 3: Forecast of Monthly RevPAR
| Sep-2024 |
$357.23 |
$334.55 |
$380.14 |
| Oct-2024 |
$148.90 |
$130.13 |
$168.86 |
| Nov-2024 |
$61.04 |
$47.73 |
$76.64 |
| Dec-2024 |
$253.42 |
$224.38 |
$284.37 |
| Jan-2025 |
$362.93 |
$320.75 |
$406.65 |
| Feb-2025 |
$375.74 |
$321.16 |
$431.57 |
Tax Revenues
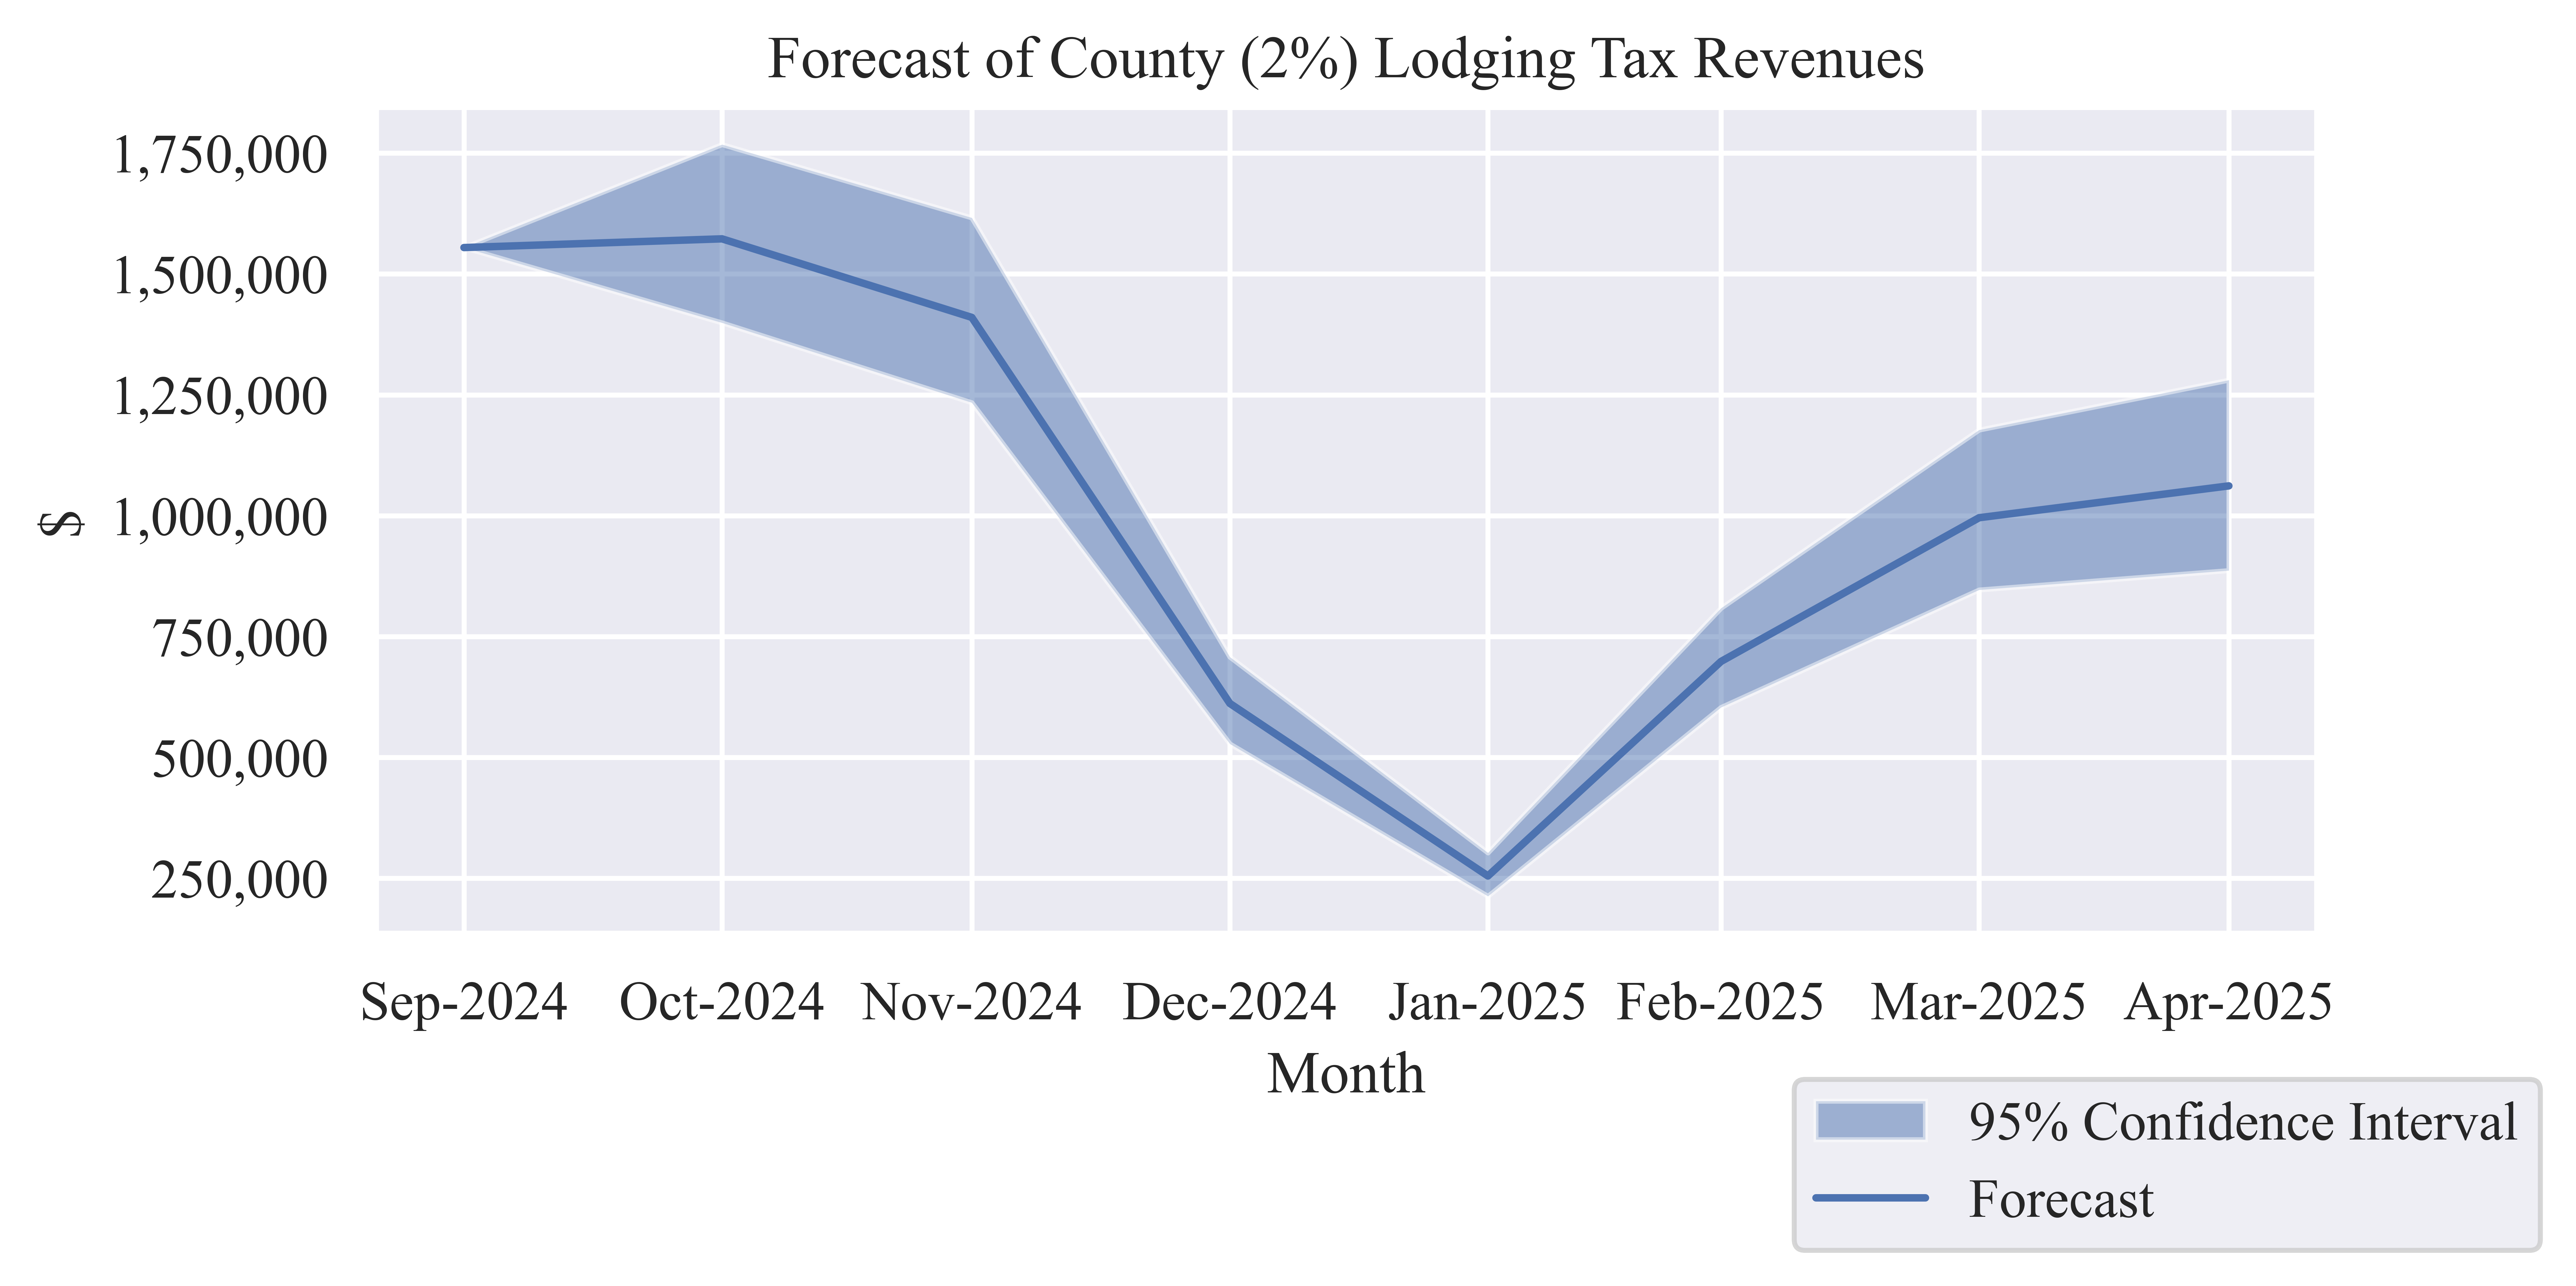
Table 4: Forecast County (2%) Lodging Tax Revenue
| Sep-2024 |
$1,554,629 |
$1,554,629 |
$1,554,629 |
| Oct-2024 |
$1,572,679 |
$1,399,065 |
$1,767,837 |
| Nov-2024 |
$1,410,189 |
$1,233,900 |
$1,616,306 |
| Dec-2024 |
$611,740 |
$528,131 |
$707,831 |
| Jan-2025 |
$254,847 |
$212,990 |
$302,818 |
| Feb-2025 |
$698,569 |
$603,617 |
$808,885 |
| Mar-2025 |
$995,844 |
$846,647 |
$1,177,478 |
| Apr-2025 |
$1,061,729 |
$886,704 |
$1,280,563 |
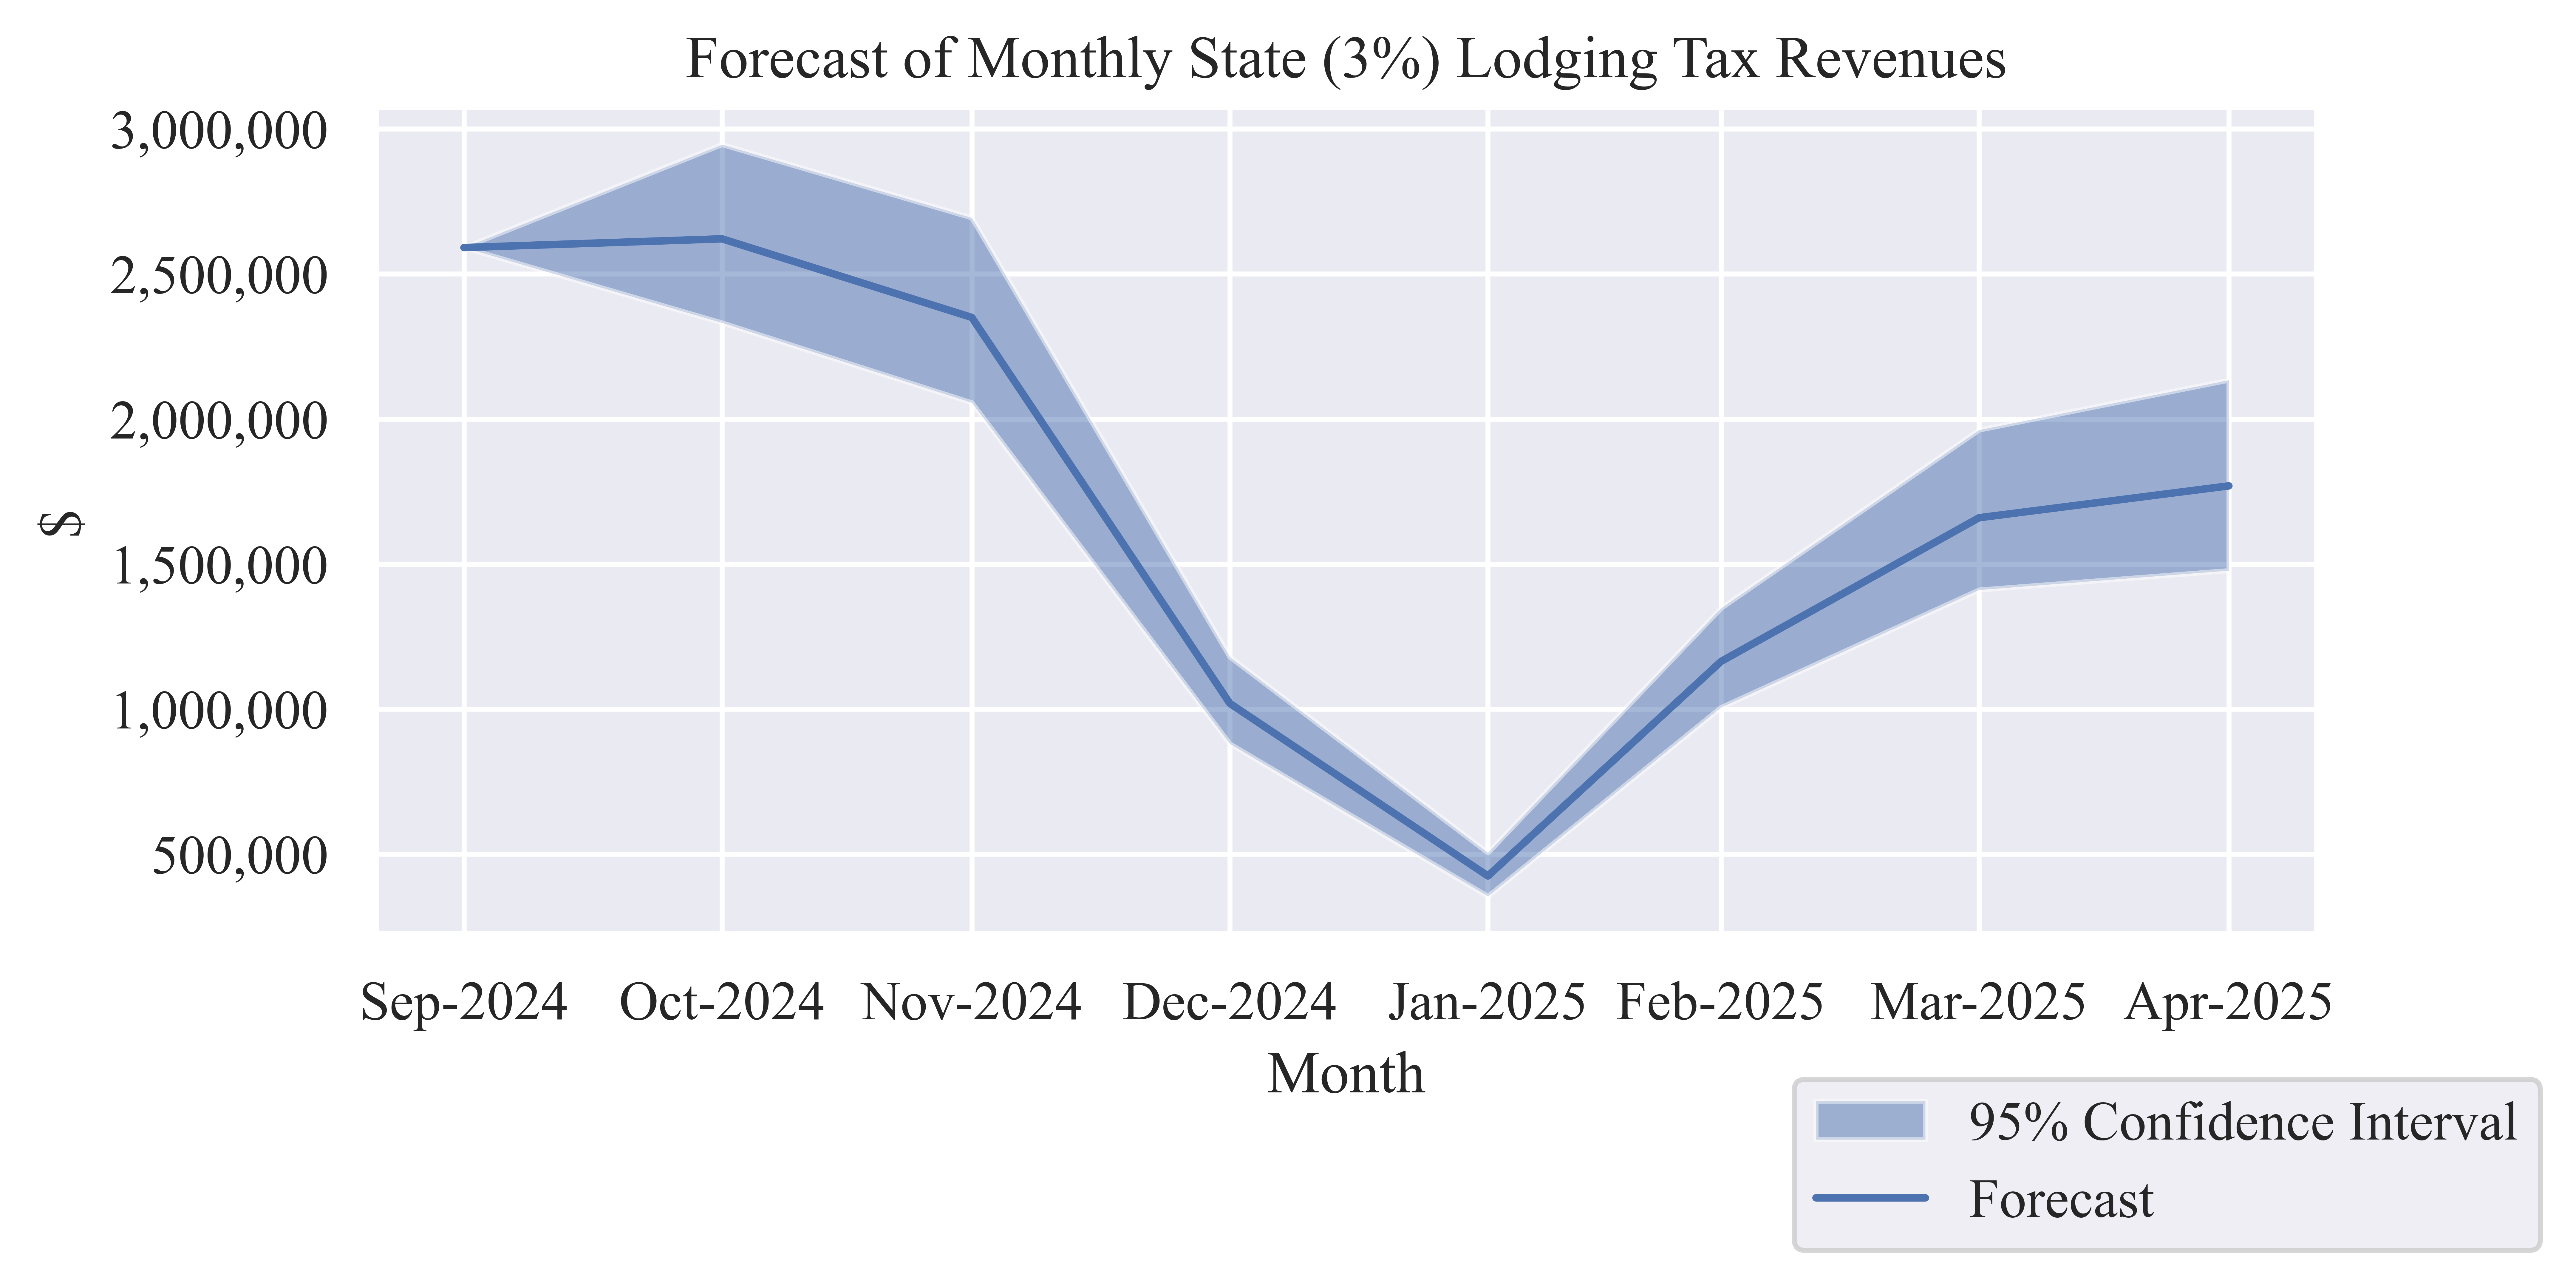
Table 5: Forecast State (3%) Lodging Tax Revenue
| Sep-2024 |
$2,591,048 |
$2,591,048 |
$2,591,048 |
| Oct-2024 |
$2,621,132 |
$2,331,775 |
$2,946,395 |
| Nov-2024 |
$2,350,316 |
$2,056,500 |
$2,693,843 |
| Dec-2024 |
$1,019,567 |
$880,218 |
$1,179,719 |
| Jan-2025 |
$424,745 |
$354,983 |
$504,696 |
| Feb-2025 |
$1,164,281 |
$1,006,028 |
$1,348,141 |
| Mar-2025 |
$1,659,741 |
$1,411,078 |
$1,962,463 |
| Apr-2025 |
$1,769,549 |
$1,477,839 |
$2,134,272 |
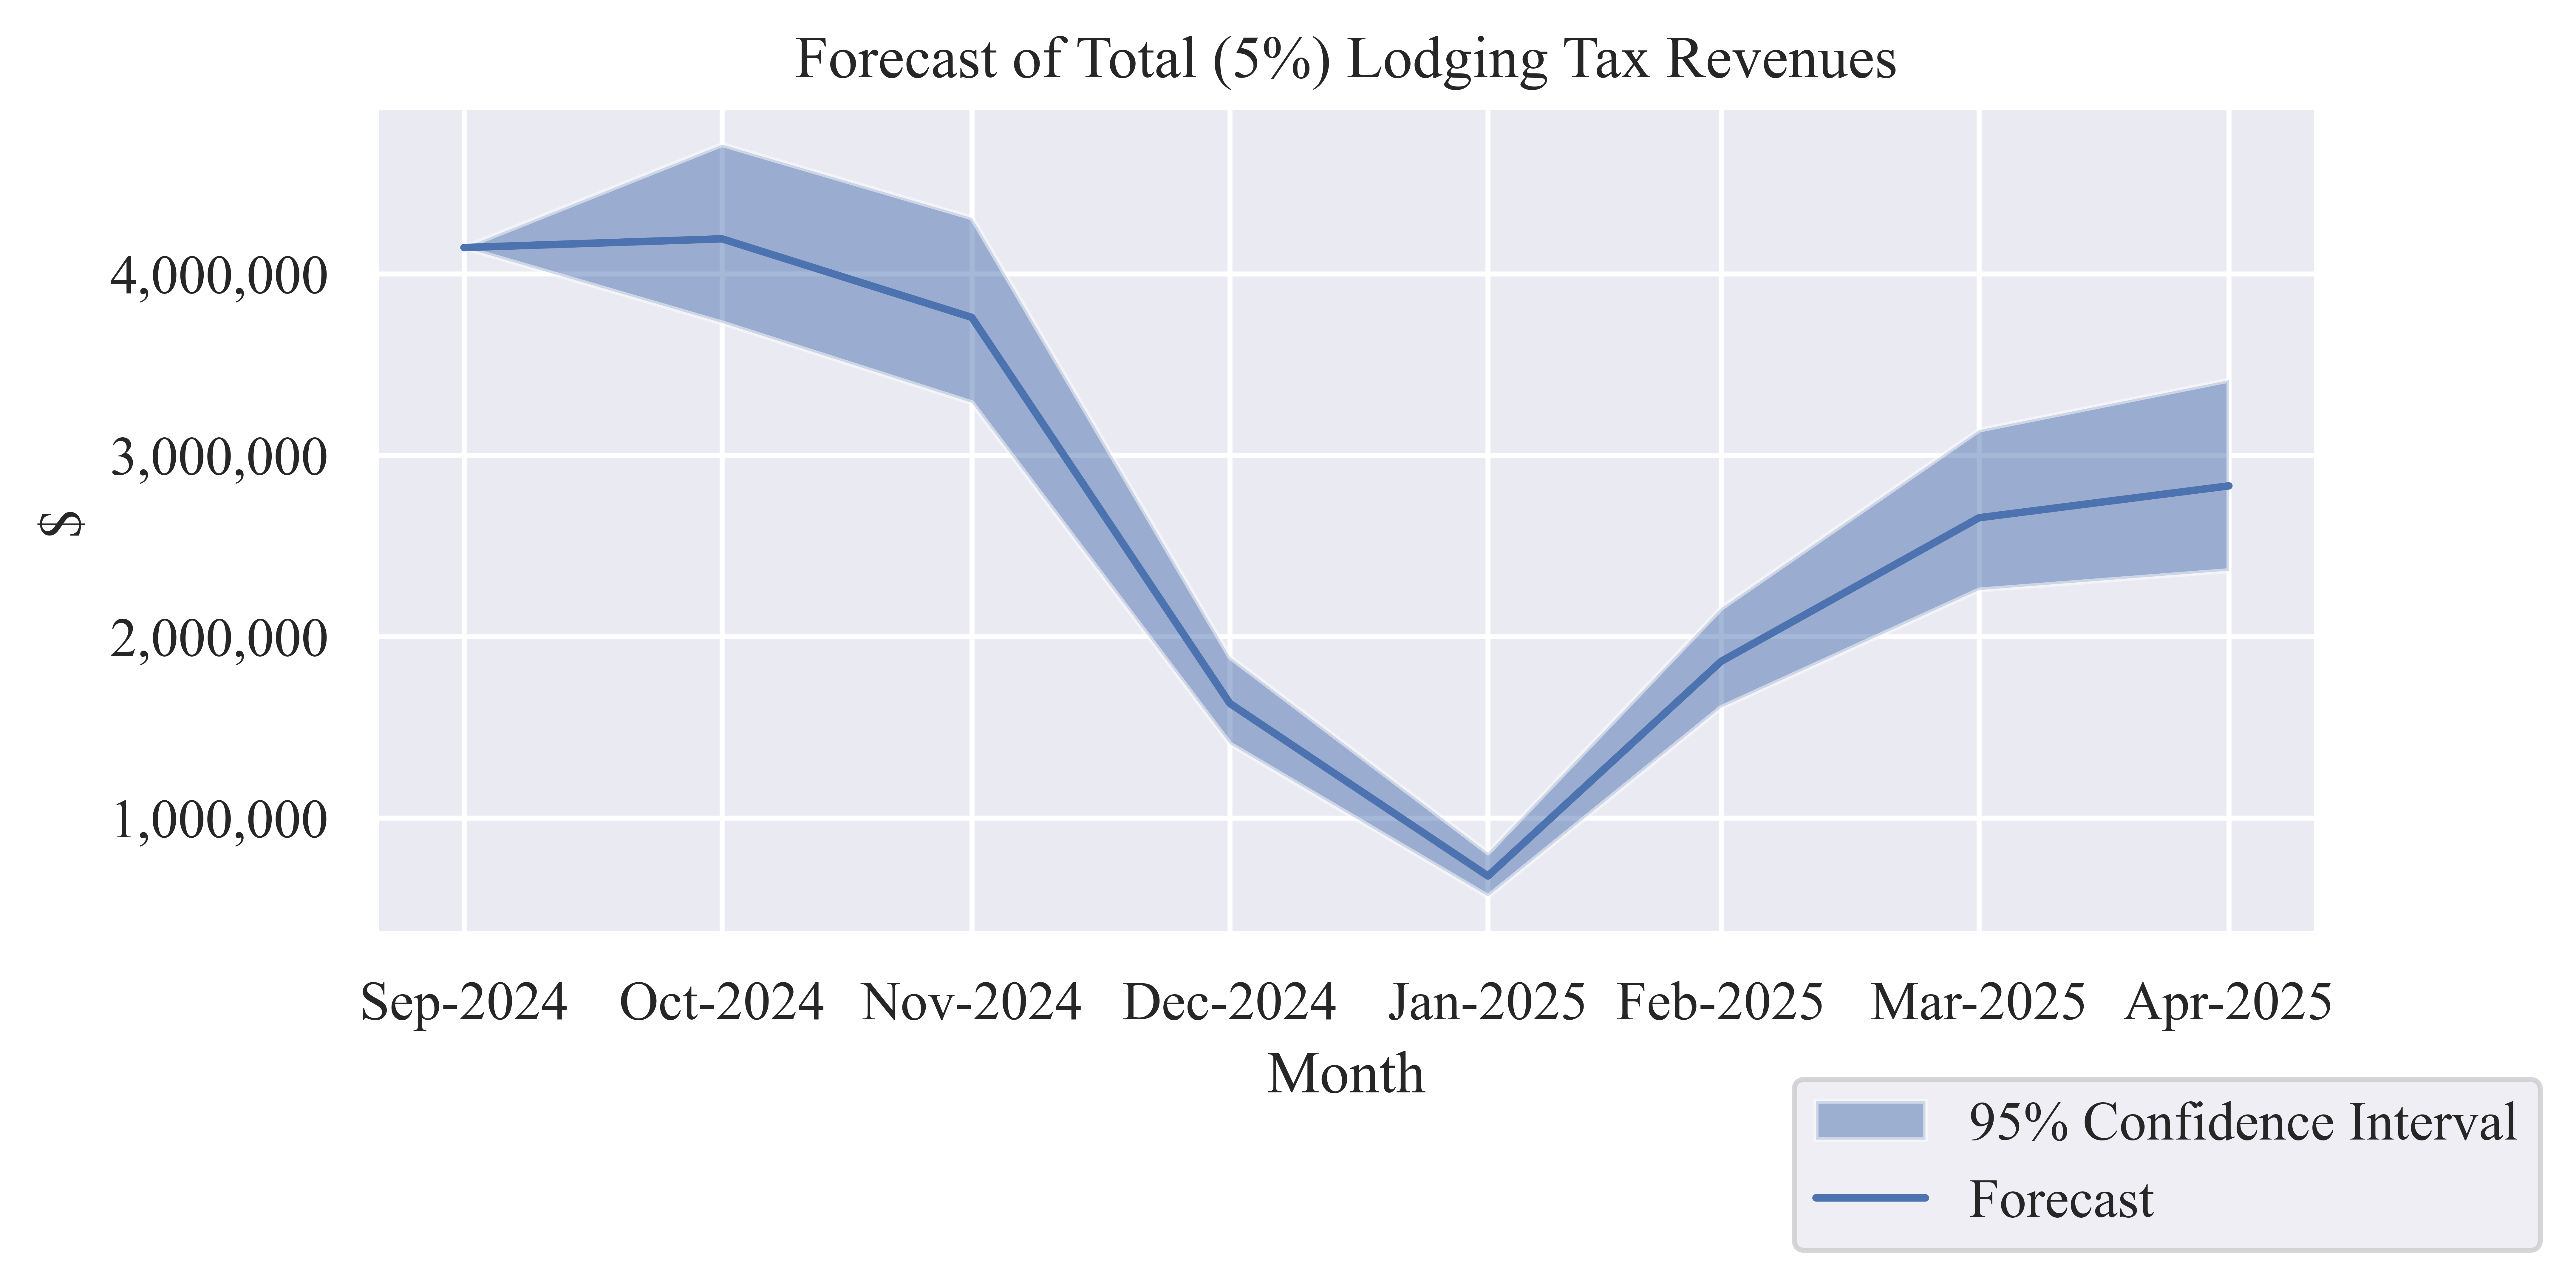
Table 6: Forecast of Monthly Total (5%) Lodging Tax Revenue
| Sep-2024 |
$4,145,676 |
$4,145,676 |
$4,145,676 |
| Oct-2024 |
$4,193,811 |
$3,730,840 |
$4,714,233 |
| Nov-2024 |
$3,760,505 |
$3,290,400 |
$4,310,148 |
| Dec-2024 |
$1,631,307 |
$1,408,349 |
$1,887,550 |
| Jan-2025 |
$679,592 |
$567,973 |
$807,514 |
| Feb-2025 |
$1,862,850 |
$1,609,645 |
$2,157,026 |
| Mar-2025 |
$2,655,585 |
$2,257,725 |
$3,139,941 |
| Apr-2025 |
$2,831,278 |
$2,364,543 |
$3,414,836 |
Lodging Sector Sales
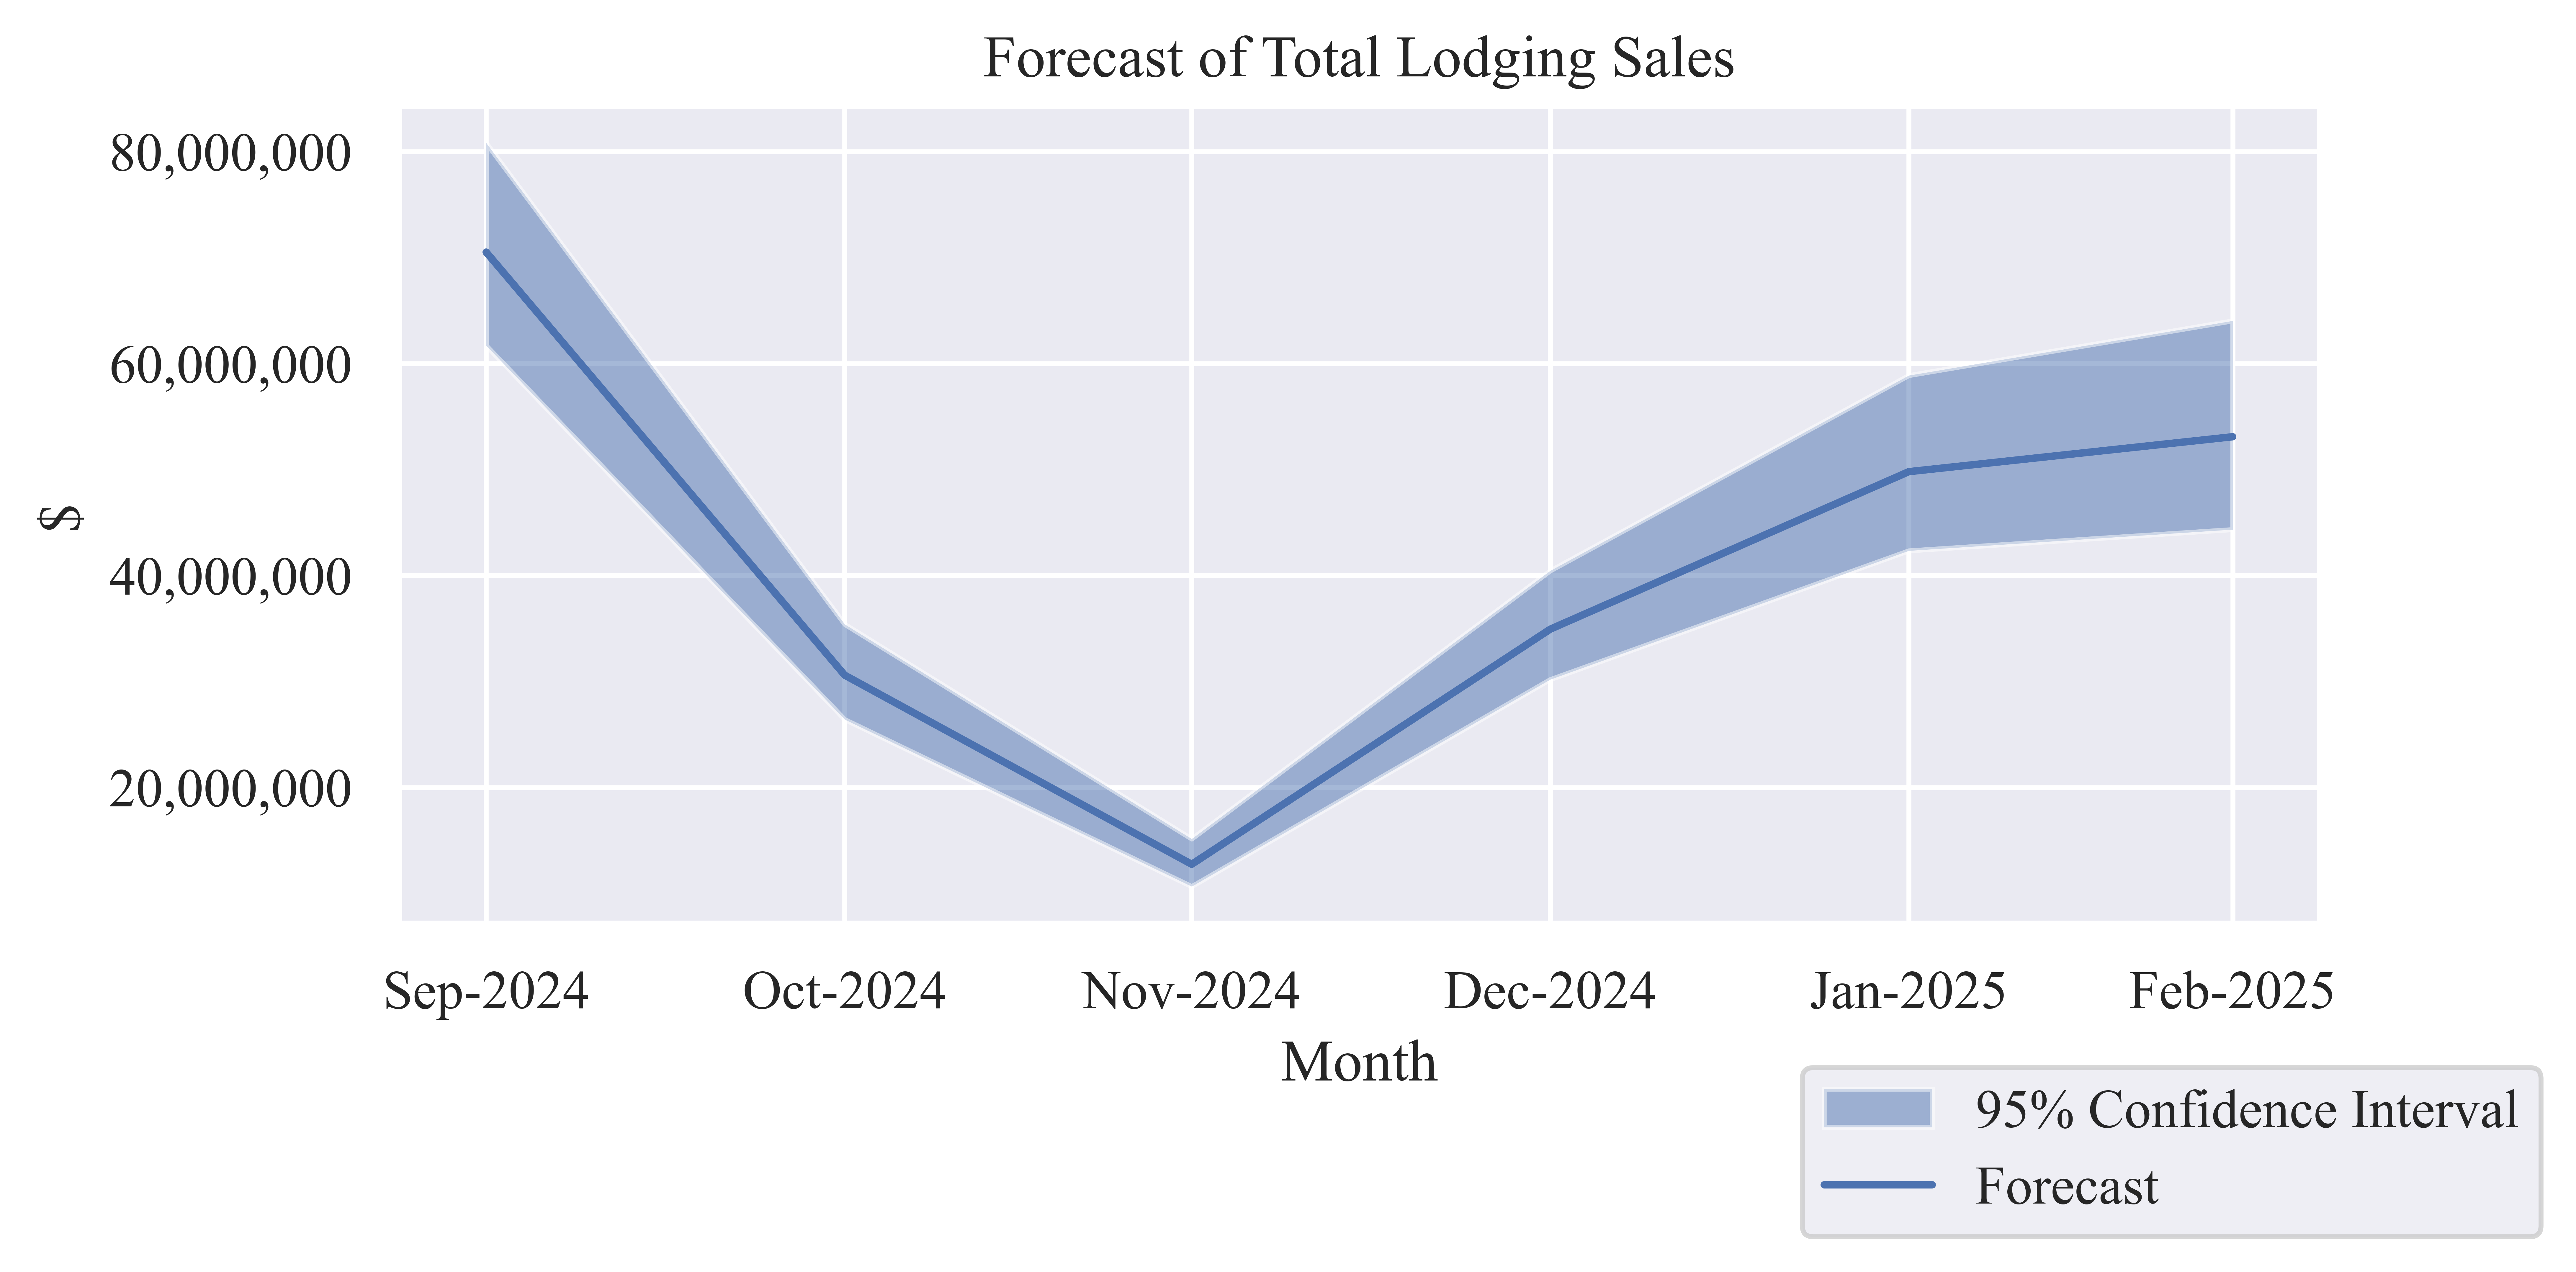
Table 7: Forecast of Monthly Lodging Sales
| Sep-2024 |
$70,509,468 |
$61,695,000 |
$80,815,277 |
| Oct-2024 |
$30,587,013 |
$26,406,543 |
$35,391,560 |
| Nov-2024 |
$12,742,342 |
$10,649,501 |
$15,140,879 |
| Dec-2024 |
$34,928,432 |
$30,180,853 |
$40,444,239 |
| Jan-2025 |
$49,792,219 |
$42,332,337 |
$58,873,896 |
| Feb-2025 |
$53,086,456 |
$44,335,180 |
$64,028,168 |
Economic Indicators
Table 8: Six-Month Forecast of Economic Output from Lodging Sales
| Low Estimate |
$215,599,413 |
$46,525,337 |
$11,708,572 |
$273,833,322 |
| Median Estimate |
$251,645,932 |
$54,304,006 |
$13,666,153 |
$319,616,091 |
| High Estimate |
$294,694,019 |
$63,593,584 |
$16,003,980 |
$374,291,582 |
Table 9: Six-Month Forecast of Employee Compensation from Lodging Sales
| Low Estimate |
$69,732,451 |
$15,676,075 |
$3,229,932 |
$88,638,459 |
| Median Estimate |
$81,391,166 |
$18,296,991 |
$3,769,951 |
$103,458,109 |
| High Estimate |
$95,314,435 |
$21,426,987 |
$4,414,865 |
$121,156,288 |
Table 10: Six-Month Forecast of Contribution to Gross County Product from Lodging
Sales
| Low Estimate |
$155,974,404 |
$27,343,285 |
$7,063,401 |
$190,381,089 |
| Median Estimate |
$182,052,092 |
$31,914,866 |
$8,244,346 |
$222,211,304 |
| High Estimate |
$213,195,033 |
$37,374,420 |
$9,654,680 |
$260,224,133 |
Table 11: Six-Month Forecast of Employment from Lodging Sales
| Low Estimate |
2,739 |
440 |
122 |
3,301 |
| Median Estimate |
3,197 |
513 |
142 |
3,853 |
| High Estimate |
3,744 |
601 |
167 |
4,512 |
